Predicting Outdoor Sound
Also available from Taylor & Francis Urban Sound Environment J Kang Hb: 0–415–35857–4 Acoust...
282 downloads
2082 Views
13MB Size
Report
This content was uploaded by our users and we assume good faith they have the permission to share this book. If you own the copyright to this book and it is wrongfully on our website, we offer a simple DMCA procedure to remove your content from our site. Start by pressing the button below!
Report copyright / DMCA form
Predicting Outdoor Sound
Also available from Taylor & Francis Urban Sound Environment J Kang Hb: 0–415–35857–4 Acoustics H Kuttruff Hb: 0–415–38679–9 Pb: 0–415–38680–2 Engineering Noise Control 3rd edition D Bies and C Hansen Hb: 0–415–26713–7 Pb: 0–415–26714–5 Fundamentals of Noise & Vibration F Fahy and J Walker Hb: 0–419–24180–9 Pb: 0–419–22700–8 Advanced Applications in Acoustics, Noise and Vibration F Fahy and J Walker Hb: 0–415–23729–7 Information and ordering details For price, availability and ordering visit our website www.tandf.co.uk/builtenvironment Alternatively our books are available from all good bookshops.
Predicting Outdoor Sound Keith Attenborough, Kai Ming Li and Kirill Horoshenkov
LONDON AND NEW YORK
First published 2007 by Taylor & Francis 2 Park Square, Milton Park, Abingdon, Oxon OX 14 4RN Simultaneously published in the USA and Canada by Taylor & Francis 270 Madison Ave, New York, NY 10016 Taylor & Francis is an imprint of the Taylor & Francis Group, an informa business This edition published in the Taylor & Francis e-Library, 2007. “To purchase your own copy of this or any of Taylor & Francis or Routledge’s collection of thousands of eBooks please go to www.eBookstore.tandf.co.uk.” © 2007 Keith Attenborough, Kai Ming Li and Kirill Horoshenkov All rights reserved. No part of this book may be reprinted or reproduced or utilised in any form or by any electronic, mechanical, or other means, now known or hereafter invented, including photocopying and recording, or in any information storage or retrieval system, without permission in writing from the publishers. The publisher makes no representation, express or implied, with regard to the accuracy of the information contained in this book and cannot accept any legal responsibility or liability for any efforts or omissions that may be made. British Library Cataloguing in Publication Data A catalogue record for this book is available from the British Library Library of Congress Cataloging in Publication Data Attenborough, K. (Keith). Predicting outdoor sound/Keith Attenborough, Kai Ming Li and Kirill Horoshenkov. p. cm. Includes bibliographical references and index. I. Outdoor sounds—Measurement. 2. Sound—Recording and reproducing. I. Li, Kai Ming. II. Horoshenkov, Kirill. III. Title. QC246.A88 2006 534–dc22 2006013566 ISBN 0-203-08873-5 Master e-book ISBN
ISBN 10: 0-419-23510-8 (Print Edition) ISBN 13: 978-0-19-23510-1 (hbk) ISBN 10: 0-203-08873-5 (Print Edition) ISBN 13: 978-0-203-08873-9 (ebk)
Contents Preface
ix
List of symbols
x
1 Introduction
1
1.1 Early observations
1
1.2 A brief survey of outdoor sound attenuation mechanisms
1
1.3 Data including combined effects of ground and meteorology
2
1.4 Classification of meteorological conditions for outdoor sound prediction
9
1.5 Typical sound speed profiles
14
1.6 Air absorption
21
2 The propagation of sound near ground surfaces in a homogeneous medium 25 2.1 Introduction
25
2.2 Mathematical formulation for a point source near to the ground
25
2.3 The sound field above a locally reacting ground
34
2.4 The sound field above a layered extended-reaction ground
42
2.5 The propagation of surface waves above a porous ground
50
2.6 Experimental data and numerical predictions
54
2.7 The sound field due to a line source near the ground
60
3 Predicting the acoustical properties of outdoor ground surfaces
66
3.1 Introduction
66
3.2 Models for ground impedance
67
3.3 Effects of surface roughness
84
3.4 Effects of ground elasticity
97
4 Measurements of the acoustical properties of ground surfaces and comparisons with models 4.1 Impedance measurement methods
110 110
4.2 Comparisons of impedance data with model predictions
118
4.3 Measured and predicted roughness effects
120
4.4 Measured and predicted effects of ground elasticity
130
4.5 Comparisons between ‘template’ fits and direct impedance fits for ground impedance
135
4.6 Measured flow resistivities and porosities
142
4.7 Effective flow resistivities and other fitted parameters
143
5 Predicting effects of source characteristics on outdoor sound
148
5.1 Introduction
148
5.2 The sound field due to a dipole source
148
5.3 The sound field due to an arbitrarily orientated quadrupole
168
5.4 Source directivity and railway noise prediction
173
6 Predictions, approximations and empirical results for ground effect excluding meteorological effects 6.1 Approximations for frequency and range dependency
177 177
6.2 Approximations and data for A-weighted levels over continuous ground 180 6.3 Predictions of the variation of A-weighted noise over discontinuous surfaces 7 Influence of source motion on ground effect and diffraction
185 191
7.1 Introduction
191
7.2 A monopole source moving at constant speed and height above a ground surface
192
7.3 The sound field of a source moving with arbitrary velocity
200
7.4 Comparison with heuristic calculations
206
7.5 Diffraction of sound due to a point source moving at constant speed and 210 height parallel to a rigid wedge 7.6 Source moving parallel to a ground discontinuity
215
7.7 Source moving along a rigid barrier above the ground
222
8 Predicting effects of mixed impedance ground
229
8.1 Introduction
229
8.2 Single discontinuity
229
8.3 Propagation over impedance strips
239
8.4 Effects of refraction above mixed impedance ground
244
8.5 Predicted effects of porous sleepers and slab-track on railway noise
250
9 Predicting the performance of outdoor noise barriers
258
9.1 Introduction
258
9.2 Analytical solutions for the diffraction of sound by a barrier
258
9.3 Empirical formulations for studying the shielding effect of barriers
274
9.4 The sound attenuation by a thin barrier on an impedance ground
279
9.5 Noise reduction by a finite length barrier
285
9.6 Adverse effect of gaps in barriers
287
9.7 The acoustic performance of an absorptive screen
293
9.8 Other factors in barrier performance
296
9.9 Predicted effects of spectral variations in train noise during pass-by
303
10 Predicting effects of vegetation, trees and turbulence
311
10.1 Effects of vegetation and crops on excess attenuation spectra
311
10.2 Propagation through trees and tall vegetation
315
10.3 Meteorological effects on sound transmission through trees
321
10.4 Combined effects of vegetation, barriers and meteorology
323
10.5 Turbulence and its effects
325
11 Analytical approximations including ground effect, refraction and turbulence 11.1 Ray tracing
342 342
11.2 Linear sound speed gradients and weak refraction
352
11.3 Approximations for A-weighted levels and ground effect optimization in the presence of weak refraction and turbulence
355
11.4 A semi-empirical model for A-weighted sound levels at long range
375
12 Prediction schemes
380
12.1 Introduction
380
12.2 ISO 9613–2
380
12.3 CONCAWE
389
12.4 Calculation of road traffic noise (CRTN)
392
12.5 Calculation of railway noise (CRN)
402
12.6 NORD2000
404
12.7 HARMONOISE
404
12.8 Performance of railway noise prediction schemes in high-rise cities
406
13 Predicting sound in an urban environment
414
13.1 Introduction
414
13.2 Improved corrections for the reflection of road traffic noise from a building façade
415
13.3 Improved correction for the multiple reflections between parallel building façades
417
13.4 Traffic noise attenuation along a city street
420
13.5 Noise in tunnels
422
13.6 Prediction of the acoustic effect of a single building façade with balconies
426
13.7 Sound propagation between two parallel high-rise building façades
430
13.8 Modelling of 3-D sound propagation between two high-rise building façades
443
13.9 Sound propagation in city streets
453
Index
466
Preface The subject of outdoor sound propagation is of wide-ranging interest not only for noise prediction but also in studies of animal bio-acoustics and in military contexts. The purpose of this book is to provide a comprehensive reference about aspects of outdoor sound and its prediction that should be useful to practitioners, and yet is respectable from the academic point of view. It is based on a joint experience of more than 50 years of research and consultancy. Many current prediction schemes for outdoor sound are empirical. To some extent this is understandable in view of the complicated source characteristics and complex propagation paths that are often of interest. Yet there has been significant progress in theories and computational methods for the various phenomena that are involved. These theories have been validated extensively by comparisons with data and help with our understanding of the important effects. No current text is devoted to bringing the leading theories and data together. Neither is the practitioner provided with the basis for deciding which model or scheme to use in a given situation. This text is a step towards a remedy for both of these deficiencies. The book covers recent advances in theory, new and old empirical schemes, available data and comparisons between theory and data. Where possible, examples of results of the application of prediction schemes have been included. Enough of the background theoretical detail is available to make the reader/user aware of the inherent approximations, restrictions and/or difficulties of any of the prediction methods being discussed. The book has had a long gestation since it was started in 1999. In 2001, Computational Atmospheric Acoustics by Erik Salomons was published. There have been three consequences of this publication for our endeavours in Predicting Outdoor Sound. The first is that we have not attempted to duplicate the fine, thorough and approachable treatments of the computational methods to be found in Salomons’ book. Second, given that Salomons’ book does not include any data, we have emphasized data where it is available. Finally, we have concentrated on those aspects of our research that complement Salomons’ work. Probably, students, researchers and consultants interested in outdoor sound prediction would do best if they are in possession of both texts. Keith Attenborough Kai Ming Li Kirill Horoshenkov November 2005
Symbols Ag c(z) c0 C(ω) C d D(z) f F(w) g0 gβ G0 Gβ k k h H I L ∆L M n1 N Nc NPR P q2 Q r R1 R2 R′ Rp Rs Reff
A-weighted ground attenuation (ISO9613–2) Sound speed as a function of height Ambient (adiabatic) sound speed Complex compressibility Elastic constant for Biot model Layer thickness, distance from carriageway edge Doppler factor Frequency; hourly traffic flow Boundary loss factor Viscosity correction function 3-D Green’s function for sound propagation above rigid boundary 3-D Green’s function for sound propagation above impedance boundary 2-D Green’s function for sound propagation above rigid boundary 2-D Green’s function for sound propagation above impedance boundary Von Karman constant Propagation constant (=ω/c) Mean propagation path height Percentage molar concentration of water vapour; Elastic constant for Biot model Hankel function of the first kind and order 0 Root mean square roughness height Acoustic intensity; integral term Bessel function of the first kind and order 0 Obukhov length; number of layers; outer (inertial) scale of turbulence; sound pressure level Change in sound pressure level Elastic constant for Biot model; Mach number Refractive index Fresnel number Fractional cloud cover Prandtl number Pasquill class Tortuosity Spherical wave reflection coefficient Horizontal range Source-receiver distance Length of specularly-reflected path Shortest source-edge-receiver path Plane wave reflection coefficient Flow resistivity Effective flow resisitivity
rh s0 S0 sA, sB te T T* T0 Tav T(z) u* u10 u(z) Vj w W Z zM zH z0 α αe β βR γ γg Γ λ Λ, Λ′ φ µ ν θ0 θ θs ρ, ρ(ω) σ σe σs
τe, τv ψ
Relative humidity Steady flow shape factor Source strength Dynamic pore shape parameters Emission time Tortuosity Scaling temperature °K Temperature °C at zero height Average temperature °C Temperature as a function of height Friction velocity (m/s) Wind speed at reference height of 10 m Wind speed as a function of height Plane wave reflection coefficient of layer j Numerical distance Ratio of minimum to mean roughness element spacing Specific normalized impedance Momentum roughness length Heat roughness length Roughness length Air absorption coefficient; air absorption parameter Rate of porosity change Specific normalized admittance Energy reflection coefficient Specific heat ratio Ground parameter (Makarewicz) Adiabatic correction factor Velocity potential, log2 base pore dimension Dimensionless parameter for complex density; wavelength Viscous and thermal characteristic lengths Velocity potential Dynamic viscosity; polar angle Kinematic viscosity Mean square refractive index Angle of incidence Polar angle Scattering angle; angle of view Density, complex density; transverse correlation Standard deviation of log-normal pore size distribution Effective flow resistivity Scattering cross section Variance of wind velocity fluctuations Variance of temperature fluctuations Thermal and viscous relaxation times Azimuthal angle
ψM ψH χM χH ω Ω
Diabatic momentum profile correction (mixing) function Diabatic heat profile correction (mixing) function Inverse diabatic influence or function for momentum Inverse diabatic influence function for momentum Angular frequency Porosity
Chapter 1 Introduction 1.1 Early observations The way in which sound travels outdoors has been of interest for several centuries. Initial experiments were concerned with the speed of sound [1]. The Francisan (Minimite) friar, Marin Mersenne (1588–1648), suggested timing the interval between seeing the flash and hearing the report of guns fired at a known distance. William Derham (1657–1735), the rector of a small church near London, was first to observe the influence of wind and temperature on sound speed and the difference in the sound of church bells at the same distance over newly fallen snow and over a hard frozen surface. Many records of the strange effects of the atmosphere on the propagation of sound waves have been associated with war [2, 3]. In June 1666, Samuel Pepys wrote that the sounds of a naval engagement between the British and Dutch fleets were heard clearly at some spots but not at others a similar distance away or closer. Pepys spoke to the captain of a yacht that had been positioned between the battle and the English coast. The captain said that he had seen the fleets and run from them, ‘…but from that hour to this hath not heard one gun…’. The effects of the atmosphere on battle sounds were not studied in a scientific way until after the First World War. During that war, acoustic shadow zones, similar to those observed by Pepys, were observed during the battle of Antwerp. Observers also noted that battle sounds from France only reached England during the summer months and were best heard in Germany during the winter. After the war there was great interest in these observations among the scientific community. Large amounts of ammunition were detonated throughout England and the public was asked to listen for sounds of explosions. Although there was considerable interest in atmospheric acoustics after the First World War, the advent of the submarine encouraged the greatest efforts in underwater acoustics research during and after the Second World War. The theoretical and numerical methods widely deployed in predicting sound propagation in the oceans have been adapted subsequently for use in atmospheric acoustics. A meeting organized by the University of Mississippi and held on the Mississippi Gulf Coast in 1981 was the first in which researchers in underwater acoustics met with scientists interested in atmospheric acoustics and stimulated the adoption and adaptation of the numerical methods, used for underwater acoustics, in the atmosphere [4].
1.2 A brief survey of outdoor sound attenuation mechanisms Outdoor sound is attenuated by distance, by topography (including natural or artificial barriers), by interaction with the ground and with ground cover and by atmospheric effects including upward refraction and absorption. When the source is downwind of the
Predicting outdoor sound
2
receiver, the sound has to propagate upwind. As height increases, the wind speed increases and the amount being subtracted from the speed of sound increases, leading to a negative sound speed gradient. In terms of rays, a negative sound gradient means that rays bend upwards. This is called upward refraction. Consequently, there is a ray that leaves the source, grazes the ground at some point and does not reach a receiver positioned beyond this point. Ray tracing ceases to be valid beyond this ground-grazing ray. The ray tracing model for outdoor sound is considered in more detail in Chapter 11. Upward refraction leads to the creation of a sound shadow at a distance from the source that depends on the gradient. The shadow zone is penetrated by sound scattered by turbulence and this sets a limit to the noise reduction within the sound shadow. Turbulence effects are considered further in Chapter 10. A negative sound speed gradient also results when the temperature decreases with height. This is called a temperature lapse condition and is the normal condition on a dry sunny day with little wind. A combination of slightly negative temperature gradient, strong upwind propagation and air absorption has been observed, in carefully monitored experiments, to reduce sound levels, 640 m from a 6 m high source over relatively hard ground, by up to 20 dB more than expected from spherical spreading [5]. Atmospheric absorption acts as a low pass filter at long range. It results from heat conduction losses, shear viscosity losses and molecular relaxation losses. The total attenuation of a sound outdoors can be expressed as the sum of the reduction due to geometric spreading, atmospheric absorption and extra attenuation including, for example, ground effects, vegetation effects, refraction in the atmosphere and diffraction by barriers. Ground effects (for elevated source and receiver) are the result of interference between sound travelling directly from source to receiver and sound reflected from the ground. Since it involves interference, there can be enhancement as well as attenuation. Enhancement tends to occur at low frequencies. The presence of vegetation tends to make the surface layer of ground including the root zone more porous. The layer of partially decayed matter on the floor of a forest is highly porous. In addition, propagation through trees involves reverberant scattering by tree trunks and viscous scattering by foliage. These ground and scattering effects are explored in detail in Chapters 3 and 10 respectively.
1.3 Data including combined effects of ground and meteorology Pioneering studies of the combined influences of the ground surface and meteorological conditions were carried out by Parkin and Scholes [6–10] using a fixed Rolls Royce Avon jet engine as a source at two airfields (Hatfield and Radlett). In his 1970 Rayleigh Medal Lecture, one of the investigators, the late Peter Parkin, remarked [6] These horizontal propagation trials showed up the ground effect, which at first we did not believe, thinking there was something wrong with the measurements. But by listening to the jet noise at a distance, one could clearly hear the gap in the spectrum.
Introduction
3
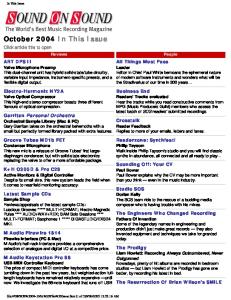
Parkin was among the first people to note and quantify the change in ground effect with the type of surface. Parkin and Scholes data showed a noticeable difference between the ground effects due to two grass covers. The ground attenuation at Hatfield, although still a major propagation factor, was less than at Radlett and its maximum value occurred at a higher frequency. The weather at the time of their measurements also enabled them to observe the different effect of snow. measurements [were] made at Site 2 [Radlett] with 6 to 9 in. of snow on the ground. The snow had fallen within the previous 24 hours and had not been disturbed. The attenuations with snow on the ground were very different from those measured under comparable wind and temperature conditions without snow…. The maximum of the ground attenuation appears to have moved down the frequency scale by approximately 2 octaves…. Examples of the Parkin and Scholes data are shown in Figure 1.1. They quoted their data as the difference in sound pressure levels at 19 m (reference location) and more distant locations corrected for the decrease expected from spherical spreading and air absorption. Clearly ground effect is sensitive to the acoustical properties of the surface. These depend on the substance of which the surface is composed. Different ground surfaces have different porosities. Soils have volume porosities of between 10 and 40%. Snow which has a porosity of around 60%, and many fibrous materials which have porosities of about 97%, have fairly low flow resistivities whereas a wet compacted soil surface will have a rather high flow resistivity. The thickness of the surface porous layer also is important and whether or not it has an acoustically hard substrate. The Parkin and Scholes data revealed the large effect at low frequencies (63 and 125 Hz octave bands) in the presence of thick snow. It should be noted moreover that even without snow there are significant differences between summer and winter excess attenuation in the Parkin and Scholes’ Radlett data. The classical experiments by Parkin and Scholes involved relatively little meteorological monitoring. In particular, the fine-scale fluctuations in wind speed and hence the turbulence were not monitored; perhaps since the important role of turbulence was not appreciated at the time. Recently there has been a similar experiment to that carried out by Parkin and Scholes. Simultaneous acoustic and meteorological measurements have been made using a jet engine source at a disused airfield operated as test facility by Rolls Royce at Hucknall [11]. In addition to wind and temperature gradient measurements, the fluctuation in wind velocity measurements was recorded and used as a measure of turbulence. Some of the data obtained under low wind and low turbulence conditions over continuous grassland are shown in Figure 1.2. Also shown is the third octave power spectrum of the Avon engine source between 100 and 4000 Hz deduced from the measured spectrum at 152.4 m corrected for spherical spreading and ground effect. The data obtained at the longest range is noise-limited above 3 kHz. The significant dips in the received spectra between 100 and 500 Hz are clear evidence of ground effect. The ground effect at Hucknall is different from that at either at Radlett or Hatfield.
Predicting outdoor sound
4
Figure 1.1 Parkin and Scholes’ data for the level difference between 1.5 m high microphones at 19 and 347 m from a fixed jet engine source (nozzle-centre height 1.82 m) corrected for wavefront spreading and air absorption. The symbols □ and ◊ represent data over airfields (grass-covered) at Radlett and Hatfield respectively with a positive vector wind between source and receiver of 1.27 m s−1 (5 ft s−1). Crosses (×) represent data over approximately 0.15 m thick (6–9 in.) snow at Hatfield with a positive vector wind of 1.52 m s−1 (6 ft s−1).
The influence of small changes in the wind speed and turbulence strength on the measured spectra at the longest range is demonstrated in Figure 1.3. The associated meteorological conditions are detailed in Table 1.1. The ground effect between 100 and 400 Hz is fairly stable and is significantly greater for the low microphones and shifted in frequency compared with that for the high microphones. The data for both microphone heights show considerable variability between 400 and 2 kHz as a result of changes in wind velocity and turbulence.
Introduction
5
Figure 1.2 Data recorded at 1.2 m high receivers at horizontal ranges of 152.4 m (solid line), 457 m (dotted line), 762 m (dashed line) and 1 158 m (dash-dot line) from a fixed Rolls Royce jet engine source with the nozzle centre 2.16 m above an airfield at Hucknall, Notts. These data represent simultaneous recordings averaged over 26 s during zero wind and low turbulence conditions (block 20 of run 454, see Figure 1.3). Also shown (connected circles) is the deduced third octave power spectrum of the Avon jet engine source after subtracting 50 dB. Figures 1.4 and 1.5 show A-weighted levels deduced from consecutive 26 s average spectra measured at 1.2 m height and ranges of 152.4 m, 457.6 m, 762.2 m and 1158.4 m over grasslands at Hucknall. Figure 1.4 shows data for low wind speed (less than 2 m s−1 from source to receiver) and low turbulence conditions. Figure 1.5 shows data for moderate downwind conditions (approximately 6 m s−1 from source to receiver) and for higher turbulence intensities. The details of the meteorological conditions are listed in Tables 1.2 and 1.3.
Predicting outdoor sound
6
Figure 1.3 Simultaneously measured narrow band (25 Hz interval) spectra at low (1.2 m) and high (6.4 m) microphones between 50 and 10 kHz at 1158.2 m from a fixed Avon jet engine source averaged over 26 s intervals during low wind, low turbulence conditions at Hucknall (Notts, UK). The conditions are specified in Table 1.1 and the key.
Introduction
7
Table 1.1 Meteorological conditions corresponding to data in Figure 1.3 Direction Temperature Temperature Turbulence Run Wind speed Wind 454 at ground speed at relative to at ground (°C) at 6.4 m (°C) variable Block (0.025 m) 6.4 m line of mics. (°) No. (m s−1) height (m s−1) 2 3 4 5 6 7 19 20
1.57 1.34 1.27 0.00 0.00 0.00 0.00 0.00
1.86 1.61 1.96 1.57 1.46 1.81 0.00 0.00
23.3 26.9 349.0 343.2 346.0 342.8 301.6 236.9
10.4 10.4 10.5 10.5 10.5 10.7 10.2 10.2
9.9 9.9 9.8 9.8 9.8 9.9 9.8 9.8
Figure 1.4 Comparison of A-weighted sound levels (26 s averages) deduced from low wind, low turbulence octave band measurements at 1.2 m height over grassland at Hucknall (Run 454 blocks 11, 12, 13(×); 14, 15, 16(+); 17, 18, 19, 20(○)).
0.0486 0.0962 0.0672 0.0873 0.1251 0.2371 0.0000 0.0000
Predicting outdoor sound
8
Note that there is a considerable spread in the measured levels at the longer ranges in Figure 1.4 as a result of the variation in wind speed and direction (up to approximately 2 m s−1 downwind at 6.4 m height) and turbulence levels. The data for stronger downwind conditions (up to approximately 6.5 m s−1 at 6.4 m height) in Figure 1.5 exhibit consistently higher levels than the relatively low wind speed data and a smaller spread. Although only four averages are shown in Figure 1.5, their spread is smaller than for any four averages exhibited in Figure 1.4. This is consistent with the assertion in ISO 9613–2 [12] that the variation in sound levels is less under ‘moderate’ downwind conditions. The average downwind level measured at Hucknall is about 10 dB higher than the levels for the lowest wind speed and turbulence conditions at 1.1 km from the source.
Figure 1.5 Comparison of A-weighted sound levels deduced from consecutive 26 s average downwind octave band measurements at 1.2 m height above grassland at Hucknall (Run 453 blocks 3(×); 4(+); 5(□) and 6(◊)).
Introduction
9
Table 1.2 Meteorological data corresponding to sound level data shown in Figure 1.4 Run 454 Block No.
Direction Temperature Temperature Turbulence Wind speed Wind at ground speed at relative to at ground (°C) at 6.4 m (°C) variable 6.4 m line of mics. (0.025 m) (°) (m s−1) height (m s−1)
11 0.00 12 0.00 13 0.00 14 0.00 15 1.02 16 0.00 17 0.00 18 0.00 19a 0.00 20a 0.00 Note a Also listed in Table 1.1.
1.97 1.97 1.09 0.01 1.53 1.58 0.92 1.16 0.00 0.00
348.1 324.8 356.9 357.7 50.6 38.5 20.9 14.0 301.6 236.9
10.5 10.6 10.6 10.4 10.4 10.4 10.2 10.2 10.2 10.2
9.8 9.8 9.8 9.9 9.9 10.0 9.9 9.9 9.8 9.8
0.0805 0.0607 0.0678 10.1489 0.0764 0.0928 0.1792 0.0424 0.0000 0.0000
Table 1.3 Meteorological data corresponding to sound level data in Figure 1.5 Run 453 Block No. 3 4 5 6
Direction Temperature at Temperature Turbulence Wind Wind ground (°C) at 6.4 m (°C) variable speed at speed at relative to ground (m 6.4 m line of mics. s−1) (°) height (m s−1) 4.09 4.09 4.33 3.89
6.44 6.11 5.93 6.07
10.0 20.5 17.8 10.8
15.0 14.9 14.9 14.9
15.0 15.0 15.0 15.0
0.1202 0.1606 0.1729 0.1028
1.4 Classification of meteorological conditions for outdoor sound prediction The atmosphere is constantly in motion as a consequence of wind shear and uneven heating of the earth’s surface (see Figure 1.6). Any turbulent flow of a fluid across a rough solid surface generates a boundary layer. Most interest from the point of view of outdoor noise prediction focuses on the lower part of the meteorological boundary layer called the surface layer. In the surface layer, turbulent fluxes vary by less than 10% of their magnitude but the wind speed and temperature gradients are largest. In typical daytime conditions the surface layer extends over 50–100 m. Usually it is thinner at night.
Predicting outdoor sound
10
In most common daytime conditions, the net radiative energy at the surface is converted into sensible heat. This warms up the atmosphere thereby producing negative temperature gradients as indicated in Figure 1.6. If the radiation is strong (high sun, little cloud cover), the ground is dry, and the surface wind speed is low, the temperature gradient is large. The atmosphere exhibits strong thermal stratification. If the ground is wet, most of the radiative energy is converted into latent heat of evaporation and the temperature gradients are correspondingly lower. In unstable daytime conditions, the wind speed is affected by the temperature gradient and exhibits slightly less variation with height than for the isothermal case. On the other hand, ‘stable’ conditions prevail at night. The radiative losses from the surface cause positive temperature gradients. There is a considerable body of knowledge about meteorological influences on air quality in general and the dispersion of plumes from stacks in particular. Plume behaviour depends on vertical temperature gradients and hence on the degree of mixing in the atmosphere. Vertical temperature gradients decrease with increasing wind. The stability of the atmosphere in respect of plume dispersion is described in terms of Pasquill classes. This classification is based on incoming solar radiation, time of day and wind speed. There are six Pasquill classes (A−F) defined in Table 1.4. Data are recorded in this form by meteorological stations and so, at first sight, it is a convenient classification system for noise prediction.
Figure 1.6 Schematic of the daytime atmospheric boundary layer and eddy structures. The sketch graph on the left shows the mean wind speed (U) and the potential where temperature profiles (θ=T+γdz, γd=0.098°C km−1 is the dry adiabatic lapse rate, T is the temperature and z is the height).
Introduction
11
Class A represents a very unstable atmosphere with strong vertical air transport, that is, mixing. Class F represents a very stable atmosphere with weak vertical transport. Class D represents a meteorologically neutral atmosphere. Such an atmosphere has a logarithmic wind speed profile and a temperature gradient corresponding to the normal decrease with height (adiabatic lapse rate). A meteorologically neutral atmosphere occurs for high wind speeds and large values of cloud cover. This means that a meteorologically neutral atmosphere may be far from acoustically neutral. Typically, the atmosphere is unstable by day and stable by night. This means that classes A−D might be appropriate classes by day and D−F by night. With practice, it is possible to estimate Pasquill Stability Categories in the field, for a particular time and season, from a visual estimate of the degree of cloud cover. The Pasquill classification of meteorological conditions has been adopted widely as the basis of a meteorological classification system for noise prediction schemes [e.g. 13]. However, it is clear from Table 1.2, that the ‘meteorologically neutral’ category (C), while being fairly common in a temperate climate, includes a wide range of wind speeds and is therefore not very suitable as a category for noise prediction. In the CONCAWE scheme [13], this problem is addressed by defining six noise prediction categories based on Pasquill categories (representing the temperature gradient) and wind speed. There are 18 sub-categories depending on wind speed. These are defined in Table 1.5. CONCAWE category 4 is specified as one in which there is zero meteorological influence. So CONCAWE category 4 is equivalent to acoustically neutral conditions. Table 1.4 Pasquill (meteorological) stability categories Wind speeda Daytime incoming solar radiation mW cm−2 (m s−1) >60 30–60 <30 Overcast
One hour before sunset Night-time cloud or after sunrise cover (octas) 0–3 4–7 8
≤1.5 A A–B B C D F or Gb F D 2.0–2.5 A–B B C C D F E D 3.0–4.5 B B–C C C D E D D 5.0–6.0 C C–D D D D D D D >6.0 D D D D D D D D Notes a Measured to the nearest 0.5 m s−1 at 11 m height. b Category G is an additional category restricted to the night-time with less than 1 octa of cloud and a wind speed of less than 0.5 m s−1.
Table 1.5 CONCAWE meteorological classes for noise prediction Meteorological category
Pasquill stability category and wind speed (m s−1) (positive is towards receiver) A, B C, D, E F, G
1 2 3 4a
v<−3.0 −3.0
— v<−3.0 −3.0
— — v<−3.0 −3.0
Predicting outdoor sound
12 −0.5
5 v>+3.0 +0.5+3.0 Note a Category with assumed zero meteorological influence.
The CONCAWE scheme requires octave band analysis. Meteorological corrections in this scheme are based primarily on analysis of the Parkin and Scholes’ data together with measurements made at several industrial sites. The excess attenuation in each octave band for each category tends to approach asymptotic limits with increasing distance. Values at 2 km for CONCAWE categories 1 (strong wind from receiver to source, hence upward refraction) and 6 (strong downward refraction) are listed in Table 1.6. Table 1.6 Values of the meteorological corrections for CONCAWE categories 1 and 6 Octave band centre frequency (Hz)
63
Category 1 Category 6
8.9 −2.3
125 6.7 −4.2
250
500 1000 2000 4000
4.9 10.0 −6.5 −7.2
12.2 −4.9
7.3 8.8 −4.3 −7.4
Table 1.7 Estimated probability of occurrence of various combinations of wind and temperature gradient Very large negative temperature gradient Large negative temperature gradient Zero temperature gradient Large positive temperature gradient Very large positive temperature gradient
Zero wind
Strong wind Very strong wind
Frequent Frequent Occasional Frequent Frequent
Occasional Occasional Frequent Occasional Occasional
Rare or never Occasional Frequent Occasional Rare or never
Table 1.8 Meteorological classes for noise prediction based on qualitative descriptions W1 W2 W3 W4 W5 TG1 TG2 TG3 TG5 TG6
Strong wind (>3−5 m s−1) from receiver to source Moderate wind (≈1−3 m s−1) from receiver to source, or strong wind at 45° No wind, or any cross wind Moderate wind (≈1−3 m s−1) from source to receiver, or strong wind at 45° Strong wind (>3−5 m s−1) from source to receiver Strong negative: daytime with strong radiation (high sun, little cloud cover), dry surface and little wind Moderate negative: as T1 but one condition missing Near isothermal: early morning or late afternoon (e.g. one hour after sunrise or before sunset) Moderate positive: night-time with overcast sky or substantial wind Strong positive: night-time with clear sky and little or no wind
Wind speed and temperature gradients are not independent. For example, very large temperature and wind speed gradients cannot coexist. Strong turbulence associated with high wind speeds does not allow the development of marked thermal stratification.
Introduction
13
Table 1.7 shows a rough estimate of the probability of occurrence of various combinations of wind and temperature gradients [5]. With regard to sound propagation, the component of the wind vector in the direction between source and receiver is most important. So the wind categories (W) must take this into account. Moreover, it is possible to give more detailed but qualitative descriptions of each of the meteorological categories (W and TG, where W refers to wind and TG refers to temperature gradient see Table 1.8). Table 1.9 Qualitative estimates of impact of meteorological condition on noise levels W1 TG1 — TG2 Large attenuation TG3 Small attenuation TG4 Small attenuation TG5 —
W2
W3
Large attenuation Small attenuation
Small attenuation Small attenuation
W4
Small attenuation Zero meteorological influence Small attenuation Zero meteorological Small enhancement influence Zero meteorological Small enhancement Small enhancement influence Small enhancement Small enhancement Large enhancement
W5 — Small enhancement Small enhancement Large enhancement —
In Table 1.9, the revised categories are identified with qualitative predictions of their effects on noise levels [5]. The classes are not symmetrical around zero meteorological influence. Typically there are more meteorological condition combinations that lead to attenuation than those that lead to enhancement. Moreover, the increases in noise level (say 1−5 dB) are smaller than the decreases (say 5–20 dB). It has been suggested [14] that noise calculation procedures should predict average levels, such as would occur under ‘neutral’ conditions, and that following or opposing winds or temperature inversions will cause variations of ±10 dB about the average values. Using the values at 500 Hz as a rough guide to the likely corrections on overall Aweighted broadband levels, it is noticeable that the CONCAWE meteorological corrections are not symmetrical around zero. The CONCAWE scheme suggests meteorological variations of between 10 dB less than the acoustically neutral level for strong upward refraction between source and receiver and 7 dB more than the acoustically neutral level for strong downward refraction between source and receiver. Zouboff et al. [5] have carried out a series of measurements using a loudspeaker source broadcasting broadband noise with maximum energy in the 500 and 1000 Hz octave bands over a flat homogeneous area, in the South of France, covered with pebbles and sparse vegetation. Acoustical data were collected at a series of microphones positioned between 20 and 640 m from the source. Meteorological parameters (mean air temperature and wind speed at three heights, together with wind direction, solar radiation and hygrometry) were monitored on a 22 m high tower located approximately at the centre of the measurement line. A hundred and ninety five 10-minute long samples were collected over a range of meteorological conditions and were expressed in terms of LAeq. Since the ground condition changed very little, most of the variation may be attributed
Predicting outdoor sound
14
Figure 1.7 Maximum, mean and minimum total attenuation deduced from Zouboff et al. [5] data for 10-minute LAeq. to meteorological effects. Figure 1.7 shows the maximum, minimum and mean total attenuation from 80 to 640 m, deduced from levels measured at 1.5 m high microphones normalized to a level of 100 dB at 20 m. These data offer further evidence for asymmetry of meteorological effects about the mean noise level. The difference between the minimum and mean levels is considerably less than the difference between the maximum and mean levels. Smaller differences were obtained with longer averaging times. For example, the 38 dB range in 10-minute LAeq at 640 m is reduced to a range of only 19 dB when comparing 8-hour LAeq during days differing in wind direction and cloud cover. Longer-term values of LAeq will be dominated by the highest levels, even though they are relatively infrequent. Moreover, levels observed under downward refraction conditions exhibit less variability than those measured under upward refraction conditions. For these reasons, the ISO Scheme [12], predicts for ‘moderate’ downwind conditions and distinguishes long-term (say seasonal or monthly) LAeq from short-term (say daily) LAeq.
1.5 Typical sound speed profiles Outdoor sound prediction requires information on wind speed, direction, temperature, relative humidity and barometric pressure as a function of height near to the propagation path. These are what determine the sound speed profile. Ideally, the heights at which the
Introduction
15
meteorological data are collected should reflect the application. If this information is not available, then there are alternative procedures. It is possible, for example, to generate an approximate sound speed profile from temperature and wind speed at a given height using the similarity theory [15] and to input this directly. According to this theory, the wind speed component (m s−1) in the source-receiver direction and temperature (°C) at height z are calculated from the values at ground level and other parameters as follows:
(1.1)
(1.2) where u* Friction velocity (m s−1) zM Momentum roughness length zH Heat roughness length T* Scaling temperature °K
(depends on surface roughness) (depends on surface roughness) (depends on surface roughness) The precise value of this is not important for sound propagation. A convenient value is 283°K (=0.41) Again it is convenient to use 283°K
k Von Karman constant T0 Temperature °C at zero height Γ Adiabatic correction factor =−0.01°C m−1 for dry air Moisture affects this value but the difference is small L Obukhov length (m) the thickness of the surface or >0→stable, <0→unstable boundary layer is given by 2L m Tav Average temperature °C It is convenient to use Tav=10 so that (Tav+273.15)=θ0 ψM Diabatic momentum profile correction (mixing) function
ψH Diabatic heat profile correction (mixing) function
χM Inverse diabatic influence =[1−16z/L]0.25 or function for momentum
Predicting outdoor sound χH Inverse diabatic influence function for momentum
16
=[1−16z/L]0.5
For a neutral atmosphere, 1/L=0 and ψM=ψ11=0. The associated sound speed profile, c(z), is calculated from
(1.3) Note that the resulting profiles are valid in the surface or boundary layer only but not at zero height. In fact, the profiles given by these equations, sometimes called BusingerDyer profiles [16], have been found to give good agreement with measured profiles up to 100 m. This height range is relevant to sound propagation over distances up to 10 km [17]. However, improved profiles are available that are valid to greater heights. For example [18],
(1.4) Often zM and zH are taken to be equal. The roughness length varies, for example, between 0.0002 (still water) and 0.1 (grass). More generally, the roughness length can be estimated from the Davenport classification [19]. Figure 1.8 shows examples of sound speed (difference) profiles, (c(z)−c(0)), generated from (1.2)–(1.4) using (a) zM=zH=0.02, u*=0.34, T*=0.0212, Tav=10, T0=6 (giving L=−390.64) (b) zM=zH=0.02, u*=0.15, T*=0.1371, Tav=10, T0=6 (giving L=−11.76) and Γ=−0.01. These parameters are intended to correspond to a cloudy windy night and a calm clear night respectively [20]. Salomons et al. [21] have suggested a method for obtaining the remaining unknown parameters, u*, T* and L from the relationship
(1.5) and the Pasquill Category (P).
Introduction
17
Figure 1.8 Downward refracting sound speed profiles relative to the sound speed at the ground obtained from similarity theory. The continuous curve is approximately logarithmic corresponding to a large Obukhov length and to a cloudy, windy night. The broken curve corresponds to a small Obukhov length as on a calm clear night and is predominantly linear away from the ground. From empirical meteorological tables, approximate relationships between the Pasquill class P the wind speed u10 at a reference height of 10 m and the fractional cloud cover Nc have been obtained. The latter determines the incoming solar radiation and therefore the heating of the ground. The former is a guide to the degree of mixing. The approximate relationship is P(u10, Nc)=1+3 [1+exp(3.5−0.5u10−0.5Nc)]−1 during the day =6−2 [1+exp (12−2u10−2Nc)]−1 during the night.
(1.6)
Predicting outdoor sound
18
A relationship between the Obukhov length L m as a function of P and roughness length z0<0.5 m, is
(1.7) where B1(P)=0.0436−0.0017P−0.0023P2 (1.8) and B2(P)=min(0, 0.045P−0.125) for 1≤P≤4 max (0, 0.025P−0.125) for 4≤P≤6.
(1.9)
Alternatively, values of B1 and B2 may be obtained from Table 1.10. Equations (1.6) and (1.7) give
L=L(u10, Nc, z0). (1.10) Also u10 is given by equation (1) with z=10 m, that is,
(1.11) Equations (1.5), (1.10) and (1.11) may be solved for u*, T* and L. Hence it is possible to calculate ψM, ψH, u(z) and T(z). Figure 1.9 shows the results of this procedure for a ground with a roughness length of 0.1 m and two upwind and downwind daytime classes defined by the parameters listed in the caption. As a consequence of atmospheric turbulence, instantaneous profiles of temperature and wind speed show considerable variations with both time and position. These variations are eliminated considerably by averaging over a period of the order of 10 minutes. Models based on similarity theory give good descriptions of the averaged profiles.
Introduction
19
Table 1.10 Values of the constants B1 and B2 in (1.7) for the six Pasquill classes
Pasquill class
A
B1 B2
0.04 0.03 0.02 −0.08 −0.035 0
B
C
D
E
F
0 −0.02 −0.05 0 0 0.025
Figure 1.9 Two daytime sound speed profiles (upwind—dashed and dotted; downwind— solid and dash-dot) determined from the parameters listed in Table 1.10. The Pasquill Category C profiles shown in Figure 1.9 are approximated closely by logarithmic curves of the form where the parameter b (>0 for downward
(1.12)
Predicting outdoor sound
20
refraction and <0 for upward refraction) is a measure of the strength of the atmospheric refraction. Such logarithmic sound speed profiles are realistic for open ground areas without obstacles particularly in the daytime. A better fit to night-time profiles is obtained with power laws of the form [22]
(1.13) where a=0.4(P−4)1/4. The temperature term in effective sound speed profile given by equation (1.3) can be approximated by truncating a Taylor expansion after the first term to give
(1.14)
When combined with (1.1), this leads to a linear dependence on temperature and a logarithmic dependence on wind speed with height. By comparing with 12 months of meteorological data obtained at a 50 m high meteorological tower in Germany, Heimann and Salomons [22] have found that (1.14) is a reasonably accurate approximation to vertical profiles of effective sound speed even in unstable conditions and in situations where the similarity theory is not valid. By making a series of sound level predictions for different meteorological conditions, it was found that a minimum of 25 meteorological classes is necessary to ensure 2 dB or less deviation in the estimated annual average sound level from the reference case with 121 categories. There are simpler, linear-segment profiles deduced from a wide range of meteorological data that may be used to represent worst case noise conditions, that is, best conditions for propagation [23]. The first of these profiles may be calculated from a temperature gradient of +15°C km−1 from the surface to 300 m and 8°C km−1 above that assuming a surface temperature of 20°C. This type of profile can occur during the daytime or at night downwind due to wind shear in the atmosphere or a very high temperature inversion (where the temperature gradient reverses at a great height above the ground). If this is considered too extreme, or too rare a condition for routine predictions, then a second possibility is a shallow inversion. A shallow inversion occurs regularly at night. A typical depth is 200 m. The profile may be calculated from a temperature gradient of +20°C km−1 from the surface to 200 m and −8°C km−1 above that assuming a surface temperature of 20°C [23]. The prediction of outdoor sound propagation also requires information about turbulence. Specifically it requires values of the mean-square refractive index, the outer length scale of the turbulence and a parameter representing the transverse separation between adjacent rays. The mean-squared refractive index may be calculated from the
Introduction
21
measured instantaneous variation of wind speed and temperature with time at the receiver.
(1.15)
is the variance of the wind velocity, is the variance of the temperature where fluctuations, a is the wind vector direction, and C0 and T0 are the ambient sound speed and temperature respectively. In the absence of turbulence data, typical values of mean-squared refractive index are between 10−6 for calm conditions and 10−4 for strong turbulence. The outer length scale may be approximated by the height of the receiver, as long as source and receiver are close to the ground. The greatest effect of turbulence is predicted when the path separation is set to zero. A more detailed discussion of turbulence is in Chapter 10.
1.6 Air absorption During its passage through the air, sound is subject to two forms of dissipation of energy: classical and relaxation [24]. The classical absorption is associated with transfer of the energy of the coherent molecular motion to equivalent heat energy or random kinetic energy of translation of air molecules. The relaxation absorption mechanism is associated with redistribution of the translational or internal energy of the molecules. The relaxation mechanism may be divided into rotational and vibrational parts, the former being more significant at high values of frequency or pressure. All of these effects may be combined. For a plane wave, pressure P at distance x from a position where the pressure is P0 is given by P=P0e−αx/2 The frequency, humidity and temperature dependent attenuation coefficient a for air absorption may be calculated using equation (1.16) [24–28].
(1.16)
where fr,N and fr,O are given by:
Predicting outdoor sound
22
(1.17)
(1.18)
where f is the frequency, T is the absolute temperature of the atmosphere in degrees Kelvin, T0=293.15 K is the reference value of T(20°C), H is the percentage molar concentration of water vapour in the atmosphere=ρsatrhp0/ps, rh is the relative humidity (%), ps is local atmospheric pressure and p0 is the reference atmospheric pressure (1 where Csat= −6.8346(T0/T)1.261+4.6151. These formulae atm=1.01325×10⁵Pa). give estimates of the absorption of pure tones to an accuracy of ±10% for 0.05
Figure 1.10 Variation of attenuation coefficient for air absorption with relative humidity.
Introduction
23
Table 1.11 Total sound absorption in dB km−1 ‘versus relative humidity as a function of frequency at 20°C (68°F) Frequency (kHz) 0 2 4 6.3 10 12.5 16 20
10
20
Relative humidity (%) 30 40 50 60 70
80
90 100
4.14 38.2 17.4 10.9 8.34 7.14 6.55 6.28 6.19 6.21 6.29 8.84 102 62.3 38.9 28.0 22.2 18.7 16.6 15.2 14.2 13.6 14.9 154 135 90.6 65.6 51.3 42.5 36.7 32.7 29.8 27.7 26.3 202 261 205 155 123 102 87.3 77.0 69.3 63.5 35.8 224 338 294 232 187 156 134 118 106 96.6 52.2 250 428 423 355 294 248 214 189 170 155 75.4 281 511 564 508 435 374 326 289 261 238
Figure 1.10 shows values of a versus relative humidity for air at 20° C and normal atmospheric pressure for frequencies between 2 and 12.5 kHz [28]. Table 1.11 shows numerical values for dB km−1 at specific frequencies.
References 1 F.V.Hunt, Origins in Acoustics, publ. Acoustical Society of America, AIP (1992). 2 C.D.Ross, Outdoor sound propagation in the US Civil War, Appl. Acoust., 59:137–147 (2000). 3 M.V.Naramoto, A concise history of acoustics in warfare, Appl. Acoust., 59:128–136 (2000). 4 Proc. 1st International Symposium on Long Range Sound Propagation, Gulfport, MS, University of Mississippi, 1981. 5 V.Zouboff, Y.Brunet, M.Berengier and E.Sechet, A qualitative approach of atmospherical effects on long range sound propagation, Proc. 6th International Symposium on Long Range Sound Propagation, ed. D.I.Havelock and M.Stinson, NRCC, Ottawa, publ. National Research Council of Canada, 251–269 (1994). 6 P.Parkin, Acoustical reminiscences: the Rayleigh lecture, Proc. Inst. Acoust., 1:7–31 (1978). 7 P.H.Parkin and W.E.Scholes, The horizontal propagation of sound from a jet engine close to the ground at Radlett, J. Sound Vib., 1:1−13 (1965). 8 P.H.Parkin and W.E.Scholes, The horizontal propagation of sound from a jet engine close to the ground at Hatfield, J. Sound Vib., 2:353–374 (1965). 9 The results of measurements of the horizontal propagation of sound at Radlett, DSIR, Building Research Station, Internal Notes B215 and B249 (unpubl.). 10 The results of measurements of the horizontal propagation of sound at Hatfield, DSIR, Building Research Station, Internal Notes IN99 (1964) (unpubl.). 11 K.Attenborough, K.M.Li and S.Taherzadeh, Propagation from a broadband source over grassland: comparison of models and data, Proc. Inter-Noise 95, 1, 319 (1995). 12 ISO 9613–2 (1996), Acoustics—Attenuation of Sound during Propagation Outdoors—Part 2: General Method of Calculation. International Standard ISO 9613–2:1996 (E). 13 K.J.Marsh, The CONCAWE model for calculating the propagation of noise from open-air industrial plants, Appl. Acoust., 15:411–428 (1982). 14 I.H.Flindell, Evidence to Heathrow T5 Enquiry (unpubl.). 15 A.S.Monin and A.M.Yaglom, Statistical Fluid Mechanics: Mechanics of Turbulence, Vol. 1, MIT press, Cambridge, MA (1979). 16 R.B.Stull, An Introduction to Boundary Layer Meteorology, Kluwer, Dordrecht, 347–386 (1991).
Predicting outdoor sound
24
17 A.A.M.Holtslag, Estimates of diabatic wind speed profiles from near surface weather observations, Boundary-Layer Meteorology, 29:225–250 (1984). 18 E.M.Salomons, Downwind propagation of sound in an atmosphere with a realistic sound speed profile: a semi-analytical ray model, J. Acoust. Soc. Am., 95:2425–2436 (1994). 19 A.G.Davenport, Rationale for determining design wind velocities, J. Am. Soc. Civ. Eng., ST-86:39–68 (1960). 20 W.H.T.Huisman, Sound Propagation over Vegetation-covered Ground, PhD Thesis, University of Nijmegen, The Netherlands (1990). 21 E.M.Salomons, F.H.van den Berg and H.E.A.Brackenhoff, Long-term average sound transfer through the atmosphere based on meteorological statistics and numerical computations of sound propagation, Proc. 6th International Symposium on Long range Sound propagation, ed. D.I.Havelock and M.Stinson, NRCC, Ottawa, 209–228 (1994). 22 D.Heimann and E.Salomons, Testing meteorological classifications for the prediction of longterm average sound levels, Appl. Acoust., 65:925–950 (2004). 23 J.M.Noble, U.S.Army research Laboratory, private communication (1993). 24 L.C.Sutherland and H.E.Bass, Atmospheric absorption in the atmosphere at high altitudes, Proc. 7th International Symposium on Long Range Sound Propagation, Lyon (1996). 25 ANSI SI.26–1995, American National Standard Method for Calculation of the Absorption of Sound by the Atmosphere, Acoustical Society of America, New York (1995). 26 ISO 9613–1 (1993), Acoustics—Attenuation of Sound during Propagation Outdoors—Part 1: Calculation of the Absorption of Sound by the Atmosphere, International Organization for Standardization, Geneva, Switzerland (1993). 27 D.T.Blackstock, Fundamentals of Physical Acoustics, University of Texas, Austin, TX, John Wiley & Sons, Inc (2000). 28 C.M.Harris, Absorption of sound in air versus humidity and temperature, J. Acoust. Soc. Am., 40:148–159 (1966). 29 C.Larsson, Atmospheric absorption conditions for horizontal sound propagation, Appl Acoust., 50:231–245 (1997). 30 C.Larsson, Weather effects on outdoor sound propagation, Int. J. Acoust. Vib., 5:33–36 (2000).
Chapter 2 The propagation of sound near ground surfaces in a homogeneous medium 2.1 Introduction Despite the fact that there are many important phenomena that affect the propagation of outdoor sound, the study of sound propagation in the homogeneous atmosphere above a flat ground, offers, perhaps, the simplest case that is amenable to theoretical analyses. In particular such a study has the distinct advantage that a closed-form analytic expression can be derived to represent the sound field. The analytical method, used for the general problem of point-to-point propagation above a boundary between two media, has been adapted from the study of the propagation of electromagnetic waves initiated by Sommerfeld [1] in 1909 and continued in Banos et al. [2]. With the benefit of these early studies in electromagnetic wave propagation, the propagation of sound above a porous ground surface was studied by Rudnick [3] in the 1940s, by Ingard [4] and Paul [5] in 1950s, by Wenzel [6], Donato [7], Chien and Soroka [8, 9] in the 1970s and by Attenborough et al. [10] and Kawai et al. [11] in the 1980s. In 1998, Li et al. [12] generalized the problem to allow for arbitrary layers in the lower medium. For situations in which multiple ground layers are important, they introduced the concept of effective impedance that greatly simplifies the computational requirements. The analytical treatment in this chapter is based on these studies [8, 12]. However, in anticipation of the subsequent discussions of more computationally intensive numerical schemes, the use of Fourier transformation method will be explored in considerable detail.
2.2 Mathematical formulation for a point source near to the ground A useful idealization of sound propagating over flat acoustically soft ground is that of the two-media problem shown in Figure 2.1 with the plane interface lying at z=0 in a rectangular coordinate system with x and y as the horizontal axes and z as the vertical
Predicting outdoor sound
26
Figure 2.1 Ray-paths from a point source above an interface between two media. axis. The lower medium represents the porous ground which is treated as an effective fluid with complex density ρ1 and complex propagation constant k1. The upper medium represents the atmosphere. The air density and the speed of sound are denoted by ρ and c, respectively, and they are constant if the atmosphere is homogeneous. The problem to be considered is the radiation from a point source in the homogeneous atmosphere. We are primarily interested in the sound field in the upper medium in which the inhomogeneous Helmholtz equation for the acoustic pressure, p is
(2.1) where k(≡ω/c) is the wave number, ω is the angular frequency of the source, time dependence factor e−iωt is understood but suppressed throughout and S(xs) is the source term at the point xs. For convenience, but without loss of generality, the source position is assumed to be located at (0, 0, zs). In the lower medium, the governing equation for the acoustic pressure is
(2.2) Here and subsequently, the properties of the lower medium are designated by the subscript 1. At the plane interface, the acoustic pressure and normal particle velocity should be continuous. This implies that
(2.3) on z=0.
The propagation of sound near ground
27
We wish to derive the Green’s function, Gm(x|xs) for the sound field at the location x≡(x, y, z) due to a point monopole source situated at xs where
S(xs)=−δ(x)δ(y)δ(z−zs). Thus Gm(x|xs) satisfies the inhomogeneous equation
(2.4) where the second argument in the Green’s function is suppressed for brevity, that is, Gm(x)≡Gm(x|xs). To find the solution for the inhomogeneous equation, it is convenient to introduce a Fourier transform pair for the Green’s function as follows:
(2.5a) and
(2.5b) Then (2.4) becomes
(2.6a) where
(2.6b) and
(2.6c)
Predicting outdoor sound
28
By means of the mathematical technique we have used, the physical space (x, y) has been transformed into an imaginary κ-space (kx, ky) to ease subsequent analyses. Using a similar Fourier transform pair for the lower medium, (2.2) can be simplified to
(2.7a) where
(2.7b) In (2.6b) and (2.7b), positive roots are chosen to ensure a finite and bounded solution for the inhomogeneous Helmoltz equation. Furthermore, the boundary conditions given in (2.3) do not change their form after the transformation. Hence, the boundary conditions in the transformed space, on z=0, are
(2.8) From (2.6a) and (2.7a), the acoustic field due to a point monopole source at (0, 0, zs) is
(2.9a)
(2.9b)
(2.9c) where and U1 are constants to be determined from the boundary for conditions. The solutions given in (2.9a–2.9c) contain both outgoing ( for zs>z≥0 and for z≤0) and incoming ( for z>zs, for zs>z≥0 and for z≤0) as waves reflected from the ‘top’ of upper medium, waves. We may interpret as that reflected from the air/ground interface and as that reflected from the ‘bottom’ of the lower medium. However, the Sommerfeld radiation condition requires and U1 must that the sound field contains no incoming waves when z→±∞, therefore
The propagation of sound near ground
vanish. By using (2.9c) with U1=0, we can eliminate to give
29
from the boundary condition (2.8)
(2.10) on z=0, where ς1 is the density ratio and n1 is the index of refraction in the ground. They are given respectively by ς1=ρ/ρ1 (2.11a) and
N1=k1/k=c/c1. (2.11b) In addition to the boundary condition (2.10) on z=0, we require the continuity of pressure and discontinuity of pressure gradient at the plane z=zs, that is,
(2.12)
The constants Au, Ad and B1 can be determined according to the conditions specified by (2.10) and (2.12), and hence the Green’s function in the transformed space can be expressed as
(2.13) where U0 (which may be regarded as the corresponding reflection coefficient of the air/ground interface in the transformed space) is given by
Predicting outdoor sound
30
(2.14)
Substitution of (2.13) and (2.14) into (2.5b) leads to an integral expression for the Green’s function for the sound field as follows:
(2.15)
The first two terms of the Green’s function can be identified immediately as Sommerfeld integrals (see for example, Ref. 2.2, Ch. 2). These can be evaluated exactly as
(2.16a) and
(2.16b)
The propagation of sound near ground
31
where
is the distance from the source located at (0, 0, zs) to the receiver located at (x, y, z) and R2 is the distance from the image source located at (0, 0, −zs) to the same receiving point, that is,
The evaluation of the integral in the third term of (2.15) requires considerable effort. An exact solution is generally not possible but the integral can be estimated asymptotically by the method of steepest descents. Taking advantage of the fact that the solution is axisymmetric about the z=0 axis, the problem may be simplified by employing a polar coordinate system instead of the rectangular Cartesian coordinates. Making use of the transformation
where κ and ε are, respectively, the magnitude and phase of the wavenumber in κ-space, we can write kx=κ cos ε (2.17a)
ky=κ sin ε (2.17b)
dkxdky=κdκdε (2.11c)
Similarly (x, y) transforms to (r, ψ) for the field points in the horizontal plane of constant z, namely,
Predicting outdoor sound
32
x=r cos ψ (2.18a) and Y=r sin ψ, (2.18b) where r is the horizontal range from source to receiver. To cover the whole integration range with kx and ky varying from −∞ to +∞, the azimuth angle ψ is required to vary from 0 to 2π and κ must vary from 0 to ∞. The unknown integral, which is denoted by I, can now be rewritten in the polar form as
(2.19)
The integral over ε can be evaluated by means of the integral expression for the Bessel function of zero order (Ref. 13; Eq. 9.1.21):
Hence,
(2.20)
Before we proceed to evaluate this integral I, we consider two limiting cases in order to shed light on the influence of the ground, that is the lower medium, on the total sound field. The first special case is when the ground is acoustically hard. For example, the source might be located above a large thick metallic sheet or over sealed concrete such that air is unable to penetrate the surface. In this particular case, the density of the ground and the contribution of is much higher than the density of air. In other word, the integral I to the total sound field is negligibly small. So the Green’s function is simply the sum of the two terms given in (2.16a) and (2.16b),
The propagation of sound near ground
33
(2.21) This solution is straightforward to interpret. The first term corresponds to the direct wave: the sound field caused by a source at (0, 0, z). The second term is the reflected wave, that is the sound field of a mirror image source located at (0, 0, z). However, if the ground is naturally porous (such as grassland or cultivated soil) or artificially porous (such as a pervious asphalt road surface), air is able to penetrate the ground. The assumption of is no longer valid as the density of air may not be negligible in comparison with the air within the ground. A more detailed consideration of the interaction of the sound wave with ground surfaces is required. In normal circumstances, c>c1 so the index of refraction of the ground, n1, is greater than 1. This is understandable since the propagation of sound in the lower medium will be somewhat impeded if it contains a combination of air gaps and solid particles. From Snell’s law and with n1>1, we can conclude that the sound ray is refracted towards the normal as it propagates from air and penetrates the ground. For most outdoor ground surfaces, the speed of sound in the ground may be considered to be much smaller than This means that further approximations may be made. In that in the air, that is particular we can approximate impedance, Z as
by n1. We define the specific normalized
(2.22a) Sometimes, it is convenient to use the specific normalized admittance, β, where Z=1/β. Consequently, according to (2.22a), we have β=ς1n1. (2.22b) With this level of approximation, the boundary condition (2.10) becomes
(2.23) The form given in (2.23) is called the impedance condition for the boundary surface. If sound waves at any angle of incidence will be strongly refracted downwards and travel normal to the surface. This type of ground surface is sometimes called a locally reacting ground because the air/ground interaction is independent of the angle of incidence of the incoming waves.
Predicting outdoor sound
34
2.3 The sound field above a locally reacting ground This section will give a derivation of the classical expression of the sound field due to a monopole source above a locally reacting ground. The fields above more complicated the ground surfaces will be discussed in section 2.5. Using the approximation integral I in (2.19) can be simplified to
(2.24) To facilitate the analysis, we introduce a further transformation such that κ=k sin µ. (2.25a) It is straightforward to show
dκ=k cos µdµ (2.25b) and
(2.25c)
The propagation of sound near ground
35
Figure 2.2 Integration paths for the integral I in spherical polar co-ordinates. The integration limit for µ cannot be restricted to real values of this angle because κ is required to vary from 0 to ∞. Consequently, kz varies from k to i∞ according to (2.25c). The path of integration, Γ1, for the new variable starts from µ=0, moves along the real axis to µ=π/2, then makes a right-angle turn and continues parallel to the imaginary axis from µ=π/2+i0 to µ=π/2−i∞, as shown in Figure 2.2. Taking the image source location as the centre, we write the separation between the source and receiver in a spherical polar coordinate (R2, θ, ψ):
(2.26a, b) It is also useful to note a property of the Hankel functions and their connection with the Bessel function:
(2.27a, b)
Predicting outdoor sound
36
Substitution of (2.25–2.27) into (2.24) leads to
After replacing µ with −µ the second integral, noting the different integration limits and combining these two integrals, we obtain
(2.28) with path of integration, Γ2 shown also in Figure 2.2. The integral (2.28) can be approximated by a uniform asymptotic expansion [14] that combines the steepest descent approach and the pole subtraction method [8]. Only the solution and its interpretation are outlined here. The integral (2.28) can be evaluated asymptotically to yield
(2.29a) where
(2.29b)
The propagation of sound near ground
37
(2.29c)
and erfc( ) is the complementary error function that can be computed readily [Ref. 13, Ch. 7]. represents a small correction term resulting from subtraction of the pole. The variable x0, which fixes the location of the pole, is determined by
(2.30) The significance of the pole location, and hence of x0, will be discussed at a later stage when we address the intriguing physical phenomenon of the associated surface wave. In deriving (2.29), we have assumed that the following relationships hold: and These approximations mean that the resulting expressions will be valid only for long range and high frequency and with both the source and receiver located close to the ground surface. The Green’s function for the sound field due to a monopole source radiating sound above a locally reacting ground can be determined by summing (2.16a), (2.16b) and (2.29a) to yield
(2.31) where Φp and are given in (2.29b) and (2.29c) respectively. However, the ‘exact’ Green’s function involves a considerable number of terms and may not be convenient for routine use. Additional assumptions are needed in order to simplify the expression given in (2.29b) and (2.29c). There are approximations the horizontal range corresponding to the relatively ‘soft’ boundary case where and other limiting cases. But it is found that the condition for a where relatively hard boundary leads to the most versatile approximation. In this case, we and r≈ R2. Then the factor in the curly bracket of (2.30) can be assume that simplified to
Predicting outdoor sound
38
(2.32a) The Hankel function can be replaced by the first term of the asymptotic expansion,
(2.32b) Substituting (2.32a) and (2.32b) into (2.29c), we obtain an approximation for Φp as
(2.33a)
where by
is sometimes called the numerical distance and is approximated
(2.33b) Furthermore, it is possible to show that the correction term, that is, small when compared with Фp. Hence it can be ignored in (2.31) and the total sound field above a locally reacting ground can be computed by substituting (2.33a) into (2.31) to yield an approximate Green’s function:
(2.34) The computation of the error function can be implemented easily by using the following formulae for a large range of |w|. Note that the numerical distance is complex,
w=wr+iwx. According to Abramowitz and Stegun [Ref. 13, p. 328], if wr>3.9 or wi>3,
The propagation of sound near ground
39
(2.35a) with an absolute error of less than 2×10⁻⁶. If wr>6 or wi>6,
(2.35b) with an absolute error less than 1×10⁻⁶. For smaller values of wr and wi, the Matta and Reichel formula [15] may be used,
(2.36a) in which
(2.36b)
(2.36c)
where
(2.36d)
Predicting outdoor sound
40
with
(2.36e)
The error bound E(h) in (2.36b) and (2.36c) can be estimated from
(2.36f)
taking h as 1 and |E(h)|≤10−4. Only three to four terms are needed for the infinite sum of H(wx, wr) and K(wx, wr) in order to meet the requirement [16]. If one reduces h to 0.8, then the magnitude of the error term becomes less than 10−6. In this case, it is found that summing the series up to the fifth term will be sufficient to guarantee the required accuracy [13]. Note also that a typographical error in Ref. [13] has been corrected in (2.36b). The above numerical solutions have proved to be accurate for predicting outdoor sound when compared with other accurate numerical schemes. Although (2.31) is a more accurate asymptotic solution, the approximation (2.34) is found to be sufficiently accurate for most practical purposes. Moreover, (2.34) is preferred because it can be rewritten in a form that leads to a useful interpretation of each term. The solution enhances the physical understanding of the problem. To interpret each term in (2.34), let’s consider a simpler but related problem: a plane wave impinges on an impedance boundary at an oblique angle, θ. From physical considerations and associated mathematical analysis [17], we would expect the total sound field, pt to consist of a direct wave, pd and a specularly reflected wave, pr multiplied by the plane wave reflection coefficient,
(2.37) Hence pt=pd+Rppr. In an analogous way, we expect that the sound field due to a point source consists of:
The propagation of sound near ground
41
(a) direct contribution from the source, and (b) a specularly reflected contribution from the image source in the boundary modified by the reflection coefficient, Q for spherical waves. With this in mind, we find it useful to rewrite the solution for the integral (2.28) in its approximate form as
(2.38) So the sound field due to a point monopole source above a locally reacting ground becomes
(2.39) Regrouping the second and third terms of (2.39), we can write the sound field in a physically interpretable form as
(2.40a) where F(w), sometimes called the boundary loss factor, is given by
(2.40b) and the term in the square bracket of (2.40a) may be interpreted as the spherical wave reflection coefficient
Q=Rp+(1−Rp) F(w). (2.40c) The sound field consists of two terms: a direct wave contribution and a specularly reflected wave from the image source. At grazing incidence θ=π/2, so that in (2.37) Rp=−1 which simplifies (2.40a) considerably leading to
Predicting outdoor sound
42
(2.41a) with the numerical distance, w given by
(2.41b) Note that the use of the plane wave reflection coefficient (2.37) instead of the spherical wave reflection coefficient (2.40c), for grazing incidence would have led to the prediction of zero sound field for both source and receiver on the ground. The contribution of the second term in Q to the total field acts as a correction for the fact that the wavefronts are spherical rather than plane. This contribution has been called the ground wave, in analogy with the corresponding term in the theory of AM radio reception [18]. The function F(w) describes the interaction of a curved wavefront with a ground of finite impedance; if the wave front is plane (R2→∞) then |w|→∞ and F→0 and if the surface is acoustically hard, then |β|→0 which implies |w|→0 and F→1. There are many other accurate asymptotic and numerical solutions available and many numerical comparisons have been carried out but no significant numerical differences between various predictions have been revealed for practical geometries and typical outdoor ground surfaces. The formula (2.40a), which is known as the Weyl-Van der Pol formula in electromagnetic propagation theory [19], is the most widely used analytical solution for predicting sound field above a locally reacting ground in a homogeneous atmosphere. One of the interesting features of outdoor sound propagation is the existence of surface wave under certain ground conditions and geometries. The details of the surface wave will be discussed in section 2.5.
2.4 The sound field above a layered extended-reaction ground The use of (2.34) in predicting outdoor sound is satisfactory in many outdoor situations with different types of ground. However, there are some cases where it is unable to predict the ground effect accurately by modelling the ground surface as an impedance plane. Outdoor examples are porous road surfaces and a layer of snow. It is the case also with some porous materials used for sound absorption in buildings, industry or transport systems. The deficiency can be readily traced back to the fact that the index of refraction In of the ground, n1 is not sufficiently high to warrant the assumed condition of this case, the refraction of sound wave depends on the angle of incidence as sound enters into the porous medium. This means that the apparent impedance depends not only on the physical properties of the ground surface but also, critically, on the angle of incidence. instead An improved formulation for the integral I in (2.20) is to use of β in the subsequent evaluation of the integral. Using the same transformation ((2.25)–(2.27)), we can rewrite (2.20) in its full form as:
The propagation of sound near ground
43
(2.42)
There are attempts to evaluate the above integral asymptotically with no further approximation [10]. Asymptotic expressions have been developed but the form is rather complicated and inconvenient to compute. A useful heuristic approximation is to replace with
If one introduces an ‘effective’ admittance, βe defined by
(2.43) then (2.42) can be recast as
(2.44) In view of our earlier analysis in section 2.3 and the analogous form of (2.28) and (2.44), we can see that both sound fields are identical [cf. (2.28) and (2.34)] except that the effective admittance (2.43) should be used instead of β for the sound field above a porous ground. We can even take a step backward and consider the boundary condition (2.10). It can be recast in a form of an effective admittance, cf. (2.43), as
(2.45) In this analysis, there is an underlying assumption that the porous ground is a homogeneous and semi-infinite medium. In real life, there are many situations where there is a highly porous surface layer above a relatively non-porous substrate. This is the case, for example, with forest floors, freshly fallen snow on a hard ground or porous asphalt. Obviously, the assumption of a semi-infinite porous ground may not be adequate. It is important for us to derive the corresponding expression for the effective admittance of the surface of ground consisting of a hardback layer ground. To allow its derivation, let us consider the reflection of plane waves on such a ground: see Figure 2.3 and denote the layer thickness by d1.
Predicting outdoor sound
44
Figure 2.3 Sound propagation from a point source over a hard-backed layer. We can use the technique described in section 2.2, although supplementary boundary conditions are required in order to satisfy the requirement for a hard-backed layer. The boundary conditions (2.8), and (2.9a) and (2.9b) remain unchanged but (2.9c) is replaced by
(2.46) Combining (2.8), (2.9b) and (2.46), simplifying the expressions and making U0 as the subject of the equation, we obtain
(2.47) The quantity U1 is determined by noting the condition for a hard backing, that is (∂p1/∂z)=0 at z=−d1 where d1(>0) is the thickness of the porous medium. Hence, according to (2.46),
(2.48) Then, use of the expression in (2.47) yields
(2.49)
The propagation of sound near ground
45
Now we can extend the concept of effective admittance from the semi-infinite porous ground to that of a layer of finite thickness lying on a hard and impervious ground. In this case, the effective admittance can be deduced straightforwardly from (2.49) to give
(2.50) At first sight, one might expect U1 to be the plane wave reflection coefficient similar to U0. If this were to be the case, then U1=1 for a rigid ground. However, this is not case as indicated in (2.48). A close examination reveals that the boundary planes are located at different levels. For U0, the reflecting plane is situated at z=0 and, for U1 it is located at is introduced in U1. z=−d1. As a result, a phase factor of To have a consistent interpretation of the interaction at each interface, we introduce a plane wave reflection coefficient at each interface such that
(2.51a) and
(2.51b) Then (2.47) becomes
(2.52) We can see from (2.52) that the plane wave coefficient of the air/ground interface, V0 is a function of V1 which, in turn, depends on the acoustical properties of subsequent layers. Typically, the reflection coefficient V1 is 1 for a hard backing, −1 for a ‘pressure-release’ backing and 0 for an anechoic backing (which absorbs all incoming sound energy). Between these limiting situations, there is a host of cases for different types of grounds. An interesting point worth noting is that the layer thickness d1 tends to infinity if the is negligibly small for a large value of ground is semi-infinite. The exponent factor, d1 because the imaginary part of K1 is positive and non-zero. Hence (2.52) can be approximated by which has the same form as found previously for semi-infinite porous ground; see (2.14).
Predicting outdoor sound
46
(2.53)
We can also estimate the minimum depth of the layer for which the ground can be treated as semi-infinite ground. A simple numerical calculation reveals that if Im(K1d1) is greater This suggests a simple condition for which the ground can than 6, say, then be treated as a semi-infinite externally reacting ground, that is
The minimum depth, dm to satisfy this condition depends on the acoustical property of the ground and the angle of incidence but we can consider two limiting cases. If we write k1=kr+ikx, then for normal incidence where κ=0 (or θ=0), the required condition is simply
(2.54a) and for grazing incidence where κ=1 (or θ=π/2), the required condition is
(2.54b)
Often, it is found inadequate to model the ground as a single hard-backed layer. This may be the case, for example, with predicting propagation through forests. This motivates extension of the earlier analysis to allow for a multi-layered ground. Assume that the ground is composed of many layers (a total of L layers, say) of materials with different acoustical properties (see Figure 2.4).
The propagation of sound near ground
47
Each layer has a different but constant depth, d1, d2, d3,…, and so on. To facilitate the analysis, the location of each layer is denoted by z0, −z1, −z2, −z3,…, etc. with z0 representing the height of the air/ground interface. In other words,
Figure 2.4 Sound propagation from a point source over a multi-layer (n-th layer) ground. Again, we require the continuity of pressure and particle velocity at each layer:
(2.55) In each layer, the pressure can be computed by summing the relevant incoming and outgoing waves in a form similar to (2.46) as follows:
(2.56a) where
Predicting outdoor sound
48
(2.56b) The following definitions for the density ratio and the index of refraction of each layer (see (2.11)) are also found useful:
(2.56c) and
(2.56d) Note that in (2.55) and (2.56), the variable j varies from 1, 2,… to L. Let’s consider the j-th layer interface. By using the continuity conditions at the interface, we obtain
(2.57a)
(2.57b) We introduce the plane wave reflection coefficients Vj (see (2.51b)) for all interfaces, which relate to the corresponding Uj, as
(2.57c) Eliminating Bj and Bj+1 by combining (2.57a) and (2.57b) and using Vj in favour of Uj through the use of (2.57c), we can write
(2.58)
The propagation of sound near ground
49
Now we are in a position to determine the sound field above a layered porous ground by using (2.52) and (2.58). Suppose that the ground is assumed to consist of L rigid-porous layers and that the L-th interface is with a rigid plane. So we have VL=1 and according (2.58), VL−1 can be found by substituting j=L−1 to give
(2.59) Next we substitute (2.58) into (2.52), put j=1, 2, 3,…, L−2 in turn, and use (2.59) for VL−1. Then, in principle, a closed-form analytic expression for the plane wave reflection coefficient V0 can be determined. Its derivation is fairly easy if L is small. When L=1, that is a single porous medium resting on a hard ground, we can obtain the same expression as shown in (2.49). For a double layer with L=2, V0 becomes
(2.60a)
where
(2.60b) It is interesting to consider some limiting cases of (2.60). If d2 becomes very small, then (2.60a) can be reduced to (2.49), which is the expression for a hardback layer. If d1 is very large, then (2.60a) can be simplified to the expression given in (2.53), which is the expression for a semi-infinite porous medium. As before, the effective admittance of the double layer can be inferred from (2.60a) to give
(2.61a)
where g1 can be expressed in terms of ςj, nj and θ
Predicting outdoor sound
50
(2.61b)
where ςj and nj are defined by (2.56c) and (2.56d). It is possible to derive an expression for the effective admittance for arbitrary number of layers. Even though the expression becomes increasingly complex for large L, obtaining its numerical values should be simple with the help of digital computers. Nevertheless, since sound waves can seldom penetrate more than a few centimetres in most naturally occurring outdoor ground surfaces, ground models consisting of more than two layers are unlikely to be required. The sound energy can hardly go beyond the first two layers and any further variations in the admittance of the lower layers contribute little to the total sound field above the ground. Finally, we wish to point out that the use of effective admittance greatly simplifies the analysis and the subsequent interpretation of the theoretical predictions. Although its introduction is somewhat heuristic, the formula gives satisfactory predictions for most practical situations. In the following sections and subsequent chapters, we assume that the specific normalized admittance of the ground should be treated as an effective parameter. We shall use β and βe interchangeably unless otherwise stated.
2.5 The propagation of surface waves above a porous ground Use of the Weyl-Van der Pol formula allows one to accurately predict the sound propagation outdoors in neutral atmospheric conditions. Although, as discussed in Section 2.3, there are standard routines for computing the contribution of ground wave, it is instructive to consider two approximations that provide useful physical insight into its behaviour as a function of the relative size of |w|. It is sufficient to consider the boundary loss factor, F(w) when we consider the ground wave term (second term of (2.40c)). For |w|<1, which implies small source/receiver separations and large impedances,
(2.62a) and, for |w|>1, which requires large source/receiver separations and small impedances,
(2.62b) where wx is the imaginary part of the numerical distance, w and H( ) is the Heaviside Step function defined by
The propagation of sound near ground
51
The Heaviside function arises as a result of the definition of the complimentary error function, erfc(x) for positive and negative arguments, that is, erfc(−x)= 2−erfc(x). To satisfy the condition of |w|>1 for different frequencies and ranges, we consider ranges greater than 50 m and frequencies less than 300 Hz. In this case, the Heaviside term in (2.62b) makes a significant contribution. By substituting (2.62b) into (2.40a), we see that it gives the usual form of a surface wave, decaying principally as the inverse root of horizontal range and exponentially with height above the ground. To allow a precise expression for the surface wave, the more accurate asymptotic expansion (2.29) for (2.28) is required. The surface wave contribution is given by [12]
(2.63a) in which, it will be ‘turned’ on when Im(x0)<0, that is
(2.63b) If we use the approximations (2.32a) and (2.32b) in (2.63a), we obtain an approximate expression for the surface wave as
This is identical to the expression implied in (2.62b), as indeed, it should be the case. By use of the condition (2.63b), we can demonstrate that the required condition can be simplified slightly to
By writing β=βr−iβx (or Z=Zr+iZx), we can represent a cut-off for the existence of the surface waves as
Predicting outdoor sound
52
(2.63c) At grazing incidence, the condition for the existence of the surface wave is
For typical outdoor surface with large impedance, where |β|→0, the condition is simply that the imaginary part of the ground impedance (the reactance) is greater than the real part (the resistance). The analysis is much simpler if we approximate −Im(x0) by (see (2.33b)), in which case, the cut-off for the surface wave is approximated by
The condition can be rearranged in a more recognizable form as
(2.64) which is an equation for a circle with centre at (−2/cos θ, 2/cos θ) and radius of The condition (2.62) for the existence of surface waves can be summarized in Figure 2.5. As discussed in the last section, the ground wave contribution (the term in square brackets in (2.40a)), represents a contribution from the vicinity of the image of the source in the ground plane—effectively a diffusing of the image for spherical wave incidence compared with the plane wave incidence. However, the surface wave is essentially a separate contribution propagating close to and parallel to the porous ground surface, and is associated with elliptical motion of air particles as the result of combining motion parallel to the surface with that normal to the surface in and out of the pores. The relative importance of each term will be shown when we discuss various ground impedance models in Chapter 4. We also note that the surface wave is predicted to have a speed less than the speed of sound in air. This forms a basis for detecting the surface wave as, at sufficient range, it should reach the receiver as a second arrival separating from the main body waves in experiments using a pulse sound source.
The propagation of sound near ground
53
Figure 2.5 The condition for the existence of surface waves for sound propagation over a ground surface.
Despite the clear theoretical importance of the surface wave in sound propagation close to ground [20], its existence was the subject of considerable controversy in the early 1980s both from the theoretical and experimental points of view. The theoretical controversy was resolved in the late 1980s by Raspet and Baird [21]. They have analysed the propagation of a spherical wave above a complex impedance plane. They show that the existence of the surface wave is independent of the body wave in air. By taking the limit where the upper half space (air) becomes incompressible, they prove that the surface waves can still exist. Strictly speaking, the existence of an acoustic surface wave above a porous boundary is not really in doubt. Attenborough and Richards [22] conducted a more sophisticated analysis of the problem where the elasticity and porosity of the soil were taken into consideration. They show that the acoustic surface wave is one of two possible surface waves, the other being an air-coupled Rayleigh wave that travels below and parallel to the surface. At low frequencies, and under certain circumstances of ground impedance and geometry, the acoustic surface wave above a porous boundary is predicted to produce total pressure levels in excess of those that would be found over an acoustically rigid boundary. Careful indoor measurements in the mid-seventies, using sources of continuous sound and artificial surfaces, have confirmed this phenomenon and have shown that the surface wave term accurately predicts the acoustic field near grazing
Predicting outdoor sound
54
incidence and its attenuation with height above the surface [23, 24]. In their experiments, the artificial surface was designed such that the reactive part of the impedance was contrived to be much greater than the resistive part, thus artificially increasing the contribution of surface waves at low frequencies. Indoor experiments [25], using a pulse sound source above lighting diffuser lattices mounted on flat rigid boards, have been successful in demonstrating the surface wave as a separate arrival from that of a body wave arriving earlier. More recent indoor experiments, on sound propagation over impedance discontinuities [26] and sound propagation over the convex impedance ground [27], show conclusive evidence of the existence of the surface waves. On the other hand, early outdoor pulse experiments [28] in neutral atmospheric conditions at long range failed to register separate arrivals of the surface wave and direct wave. This is largely due to the fact that the resistive impedance components of most outdoor ground surfaces give rise to appreciable exponential attenuation along the surface. This outweighs the advantage otherwise possessed by the surface pressure component in that it decays with the inverse square root of range rather than inversely with range, as is true for other components. The ground types that are most likely to produce measurable surface waves are those that may be modelled as thin hardbacked layer (see Chapter 4). One of the most favourable ground surfaces is a thin layer of snow over a frozen ground. By firing blank pistol shots as the sound pulse, Albert confirmed the surface wave propagation for his outdoor experiments over snow [29]. In fact, Piercy et al. [18] have demonstrated, as early as in 1977, the presence of surface waves in sound propagation outdoors. Nevertheless, the existence of the surface wave above an impedance plane in a homogeneous atmosphere is now beyond doubt [30].
2.6 Experimental data and numerical predictions To enable the prediction of sound propagation outdoors, the impedance of ground surface is required. There are a number of models for the acoustical properties of outdoor ground surfaces in which two semi-empirical models, namely a single-parameter model and a two-parameter model, are most frequently used. In Chapter 3, we shall discuss the basis for these and other ground impedance models. For the moment, it is sufficient just to quote the formulations so that we can illustrate ground effects on outdoor sound through numerical computations and comparisons with experimental data. The single-parameter model, due to Delany and Bazley [31], describes the propagation constant, k and normalized surface impedance, Z by a single adjustable parameter known as the effective flow resistivity, σe which has units of Pa s m−2. It is called ‘effective’ since in modelling outdoor ground surfaces, it rarely takes a value equal to the actual flow resistivity, that is a measure of the drop in pressure per unit length in the direction of a flow of air at unit speed. The Delany and Bazley model is suitable for a locally reacting ground as well as for an extendedreaction surface. The propagation constant and normalized surface impedance are determined according to
(2.65a)
The propagation of sound near ground
55
(2.65b) For locally reacting ground, we can simply use (2.65b) to calculate the impedance for the prediction of outdoor sound. There is a slight complication for the extended-reaction ground but we can combine (2.65) to determine the ratios of sound speed and density of the air and ground (cf. (2.11)) by
(2.66a)
and
(2.66b)
which allows the effective impedance to be computed. Nevertheless, use of the single-parameter model to calculate the sound field permits us to study the contribution of surface waves straightforwardly. For simplicity, it is adequate just to consider a locally reacting ground. The magnitude and phase of impedance are given, respectively, by
(2.67a)
(2.67b)
A close inspection of (2.66b) reveals that the phase angle of impedance varies from π/2 for (f/σe)→0 to 0 for (f/σe)→∞. Also, the effective flow resistivity varies from about 15 kPa s m−2 (for a very soft ground such as snow covered ground) to about 25,000 kPa s m−2 for a road surface made with hot-rolled asphalt.
Predicting outdoor sound
56
Let us now examine the numerical distance, w. We can expand (2.33b) by writing to give
(2.68a)
Given the ranges of effective flow resistivity, frequencies (10 Hz–10 kHz) and source/receiver geometries of interest, the magnitude of the numerical distance varies from 0.01 to over 100. The phase of the numerical distance is limited to ±π/2. As discussed in section 2.3, the boundary loss factor F(w) plays an important role in neargrazing propagation. Hence it is worth showing its variation with the magnitude of the numerical distance. For simplicity, we consider the case of grazing propagation when the source and receiver are located on the ground surface In this case the numerical distance (2.68a) simplifies to
(2.68b)
which is essentially the same as (2.41b) except that w is expressed in the polar form. Figure 2.6 shows a plot of 20 log |F(w)| versus |w| for different phase angles of impedance, It is of interest to point out that the boundary loss factor is greater than 1 This is (indicating enhancement of sound fields) for a certain range of |w| when due to the addition of the surface wave component in the propagation of the outdoor sound. In this case, as shown in (2.68b), the numerical distance has a negative imaginary part.
The propagation of sound near ground
57
Figure 2.6 Magnitude of F(w) versus the numerical distance w for various phase angles of surface impedance. Source and receiver are located on the ground. At this point, it is worth mentioning that there is a minor typographical error in Ref. [30] since in figure 6 of that reference, a similar result is shown but |w|2 is plotted instead of |w| as stated. To illustrate the relative importance of the various contributions of the total sound field, it is instructive to present some of the classical Parkin and Scholes data obtained in a series of measurements at two disused airfields in the 1960s using a fixed jet engine source [32, 33]. Figures 2.7(a) and (b) [34] show data for the corrected difference in levels at 1.5 m height between a reference microphone and a remote microphone at different ranges (1097.3 m for Figure 2.7(a) and 35 m for Figure 2.7 (b)) [34]. These Figures show also theoretical predictions using a single-parameter model for the surface impedance (see (3.2)). The predicted contributions to the total field is divided into the direct (D) wave, the reflected (R) wave, the ground wave (G) and the surface (S) wave. We can see from the theoretical fits to the experimental data that the ground waves and surface waves are major carriers of environmental noise at low frequencies over long distances.
Predicting outdoor sound
58
Figure 2.7 (a) Parkin and Scholes’ data (∆), reproduced from [34], for the corrected difference in levels from a fixed (1.82 m high) jet engine source between receivers at ranges of 19.5 m and 1097.3 m and at 1.5 m height over an airfield. Predictions use Delany and Bazley’s impedance model with σe=300 kPa s m−2 and show the individual contributions from the direct wave (D), the plane-wave reflected component (R), the ground wave (G) and the surface wave (S). (b) Data for sound level re free field obtained above snow (20 cm thick) at a range of 35 m (reproduced from [35]). Predictions use Delany and Bazley’s impedance model (3.1, 3.2) with σe=12 kPa s m−2. Again the predicted individual components are shown.
The single-parameter model has been used to predict the impedance of a layered ground surface, which is subsequently used in the prediction of sound propagation outdoors. Nicolas et al. [35] have reported an extensive series of measurements over layers of snow from 5 to 50 cm thick and at propagation distance up to 15 m. They have compared their experimental data with tolerable success, but they were unable to obtain reasonable fits of data at low frequencies by assuming either a semi-infinite ground or a hard-backed single
The propagation of sound near ground
59
layer ground structure. Li et al. [12] have improved the agreement between predictions and data by introducing a double layer model. Figure 2.8 shows the measured behaviour over snow layers, nominally 6, 8 and 10 cm thick, together with various predictions. Table 2.1 shows the values of the effective flow resistivities and layer thicknesses used for the predictions on Figure 2.8. The double layer predictions (broken lines) are in somewhat better agreement with data than those assuming a single hard-backed layer (dotted lines) or a semi-infinite layer (continuous lines).
Figure 2.8 Data and predictions for sound propagation over snow. The excess attenuation data (reported in [35]) were obtained with source height 0.6 m, receiver height 0.3 m and range 7.5 m. (a) 6-cm thick layer of snow over ice. (b) 8-cm thick layer of new snow over asphalt, (c) 10-cm thick layer of freshly fallen snow above 50 cm of old hardened snow covered previously by a crust of ice.
Predicting outdoor sound
60
Table 2.1 The layer thickness and flow resistivities used for the predictions shown in Figure 2.8 Ground type
(a)
Hard-backed layer (dotted line) σe=15 kPa m s−2 d=6 cm Semi-infinite ground (solid line) σe=15 kPa m s−2 Double layer (broken line) σ1=10 kPa m s−2 d1=8 cm σ2=15 kPa m s−2 d2=3 cm
(b)
(c)
σe=15 kPa m s−2 σe=10 kPa m s−2 d=8 cm d=10 cm σe=15 kPa m s−2 σe=10 kPa m s−2 σ1=10 kPa m σ1=8 kPa m s−2 s−2 d1=12 cm d1=10 cm σ2=15 kPa m s−2 σ2=55 kPa m d2=3 cm s−2 d2=1 cm
Another popular ground impedance model is the two-parameter model proposed by Attenborough [36] and revised by Raspet and Sabatier [37] see (3.13). Although this model is suitable only for a locally reacting ground, it allows better agreement with data obtained over many outdoor ground surfaces than that obtained with the single-parameter model. Two adjustable parameters, the effective flow resistivity (σe) and the effective rate of change of porosity with depth (αe), are used. The impedance of the ground surface is predicted by
(2.69) The effective rate of change of porosity with depth has units m−1. Of course, some improvement of the agreement between predictions and data is to be expected with two ‘adjustable’ parameters instead of one. Impedance models using even more parameters will be discussed in Chapter 3. Finally in this section, we illustrate in Figure 2.9, the effects on the excess attenuation of the changes in the values of σe and αe. It can be seen that the effect of increasing σe is to increase the frequency of the ground effect dip, whereas the effect increasing αe is to increase the magnitude of the dip.
2.7 The sound field due to a line source near the ground We end this chapter by considering a closely related problem: the sound field due to a line source above a ground surface. This is a 2-D problem which is often used to model the traffic noise in highways. The solution can be obtained readily by using a similar approach as discussed earlier for the 3-D case. Let us use a rectangular coordinate system, x≡(x, z) with a line source located at xs≡(0, zs). Without loss of generality, we assume x>0 as the field is symmetry for the regions of x>0 and x<0. The problem of finding the required Green’s function, gm(x) can be stated as
The propagation of sound near ground
61
(2.70a) subject to the impedance boundary condition of
(2.70b) at the ground surface z=0. Again, the admittance, β should be treated as an ‘effective’ parameter where it can be used to model either a locally reacting or
Figure 2.9 Predicted sensitivity of excess attenuation spectra to changes in effective flow resistivity σe and the rate of change of porosity with depth αe in the two-parameter model (2.68) for the effective impedance of the ground surface.
Predicting outdoor sound
62
an extended-reaction ground surface. Application of a one-fold Fourier transform on both sides of (2.70a) and (2.70b) leads to
(2.71a)
(2.71b)
where
(2.71c) and the 1-D Fourier transform pair is defined by
(2.71d) and
(2.71e) With the boundary condition (2.71b), we can solve (2.71a) readily to yield
(2.72) Substituting (2.72) into (2.7 1e), we can express the Green’s function in an integral expression that can further be spilt into three terms as follows:
The propagation of sound near ground
63
(2.73)
The evaluation of the integral can be simplified considerably if we use a polar coordinate centring on the source for the first integral and on the image source for the other two integrals. In the polar coordinate system, we have where R1 and R2 are the respective path lengths for the direct and reflected waves, respectively; and θ, are their corresponding polar angles. The required Green’s function can be transformed to
(2.74)
The first and second integral can be identified as the sound field due to the source and its image source. These two integrals can be expressed in terms of Hankel functions as
(2.75a)
(2.75b) The third integral of (2.74), Iβ say, can not be evaluated exactly, but an asymptotic method may be applied to evaluate the integral and yields
Predicting outdoor sound
64
(2.76)
Applying the same approximations as used in the 3-D case, that is, and we can express gm(x) by substituting (2.75a), (2.75b) and (2.76) into (2.74) to give
(2.77) The formula can be rearranged further to give the more recognizable form
(2.78) Hence the 2-D Green’s function can be expressed in the classical form corresponding to the Weyl-Van der Pol formula for a point source.
References 1 A.N.Sommerfeld, Propagation of waves in wireless telegraphy, Ann. Phys. (France) 333(4):665–736 (1909); 386 (25): 1135–1153 (1926). 2 A.Banos, Jr, Dipole Radiation in the Presence of Conducting Half-space (Pergamon, New York) Ch. 2–4 (1966). 3 I.Rudnick, Propagation of an acoustic waves along an impedance boundary, J. Acoust. Soc. Am., 19:348–356 (1947). 4 K.U.Ingard, On the reflection of a spherical wave from an infinite plane, J. Acoust. Soc. Am., 23:329–335 (1951). 5 D.I.Paul, Acoustical radiation from a point source in the presence of two media, J. Acoust. Soc. Am., 29:1102–1109 (1959). 6 A.R.Wenzel, Propagation of waves along an impedance boundary, J. Acoust. Soc. Am., 55:956–963 (1974). 7 R.J.Donate, Spherical-wave reflection from a boundary of reactive impedance using a modification of Cagniard’s method, J. Acoust. Soc. Am., 60:999–1002 (1976). 8 C.F.Chien and W.W.Soroka, Sound proagation along an impedance plane, J. Sound Vib., 43:9–20 (1976). 9 C.F.Chien and W.W.Soroka, A note on the calculation of sound propagation along an impedance plane, J. Sound Vib., 69:340–343 (1980). 10 K.Attenborough, S.I.Hayek and J.M.Lawther, Propagation of sound above a porous half-space, J. Acoust. Soc. Am., 68:1493–1501 (1980). 11 T.Kawai, T.Hidaka and T.Nakajima, Sound propagation above an impedance boundary, J. Sound Vib., 83:125–138 (1982).
The propagation of sound near ground
65
12 K.M.Li, T.Waters-Fuller and K.Attenborough, Sound propagation from a point source over extended-reaction ground, J. Acoust. Soc. Am., 104:679–685 (1998). 13 M.Abramowitz and I.A.Stegun, Handbook of Mathematical Functions with Formulas, Graphs, and Mathematical Tables, Dover Publications, Inc., New York (1972). 14 R.Wong, Asymptotic Approximations of Integrals, Academic Press, Inc., London 356–360 (1989). 15 F.Matta and A.Reichel, Uniform computation of the error function and other related functions, Math. Comput., 25:339–344 (1971). 16 R.K.Pirinchieva, Model study of sound propagation over ground of finite impedance, J. Acoust. Soc. Am., 90:2679–2682 (1991). 17 A.P.Dowling and J.E.Ffowcs Williams, Sound and Sources of Sound, Ellis Horwood Ltd., Chichester Ch. 4 (1983). 18 T.F.W.Embleton, J.E.Piercy and N.Olson, Outdoor sound propagation over ground of finite impedance, J. Acoust. Soc. Am., 59:267–277 (1976). 19 L.M.Brekhovskikh, Waves in Layered Media, Academic Press, New York (1980). 20 K.Attenborough, Predicted ground effect for highway noise, J. Sound Vib., 81:413–424 (1982). 21 R.Raspet and G.E.Baird, The acoustic surface wave above a complex impedance ground surface, J. Acoust. Soc. Am., 85:638–640 (1989). 22 K.Attenborough and T.L.Richards, Transmission of sound at a porous interface, Proc. eleventh ICA, Paris, p. 178 (1 July 1983). 23 S.I.Thomasson, Sound propagation above a layer with large refraction index, J. Acoust. Soc. Am., 61:659–674 (1977). 24 R.J.Donate, Model experiments on surface waves, J. Acoust. Soc. Am., 63:700–703 (1978). 25 C.H.Howorth and K.Attenborough, Model experiments on air-coupled surface waves, J. Acoust. Soc. Am., 92:2431 (A) (1992). 26 G.A.Daigle, M.R.Stinson and D.I.Havelock, Experiments on surface waves over a model impedanve using acoustical pulses, J. Acoust. Soc. Am., 99:1993–2005 (1996). 27 Q.Wang and K.M.Li, Surface waves over a convex impedance surface, J. Acoust. Soc. Am., 106:2345–2357 (1999). 28 C.G.Don and A.J.Cramond, Impulse propagation in a neutral atmosphere, J. Acoust. Soc. Am., 81:1341–1349 (1987). 29 D.G.Albert, Observation of acoustic surface waves propagating above a snow cover, Proc. fifth Symposium on Long range Sound Propagation, 10–16 (1992). 30 L.C.Sutherland and G.A.Daigle, Atmospheric sound propagation, in Handbook of Acoustics, edited by M.J.Crocker, JohnWiley & Sons, New York 305–329 (1998). 31 M.E.Delany and E.N.Bazley, Acoustical properties of fibrous absorbent materials, Appl Acoust., 3:105–116 (1970). 32 P.H.Parkin and W.E.Scholes, The horizontal propagation of sound from a jet close to the ground at Radlett, J. Sound Vib., 1:1–13 (1965). 33 P.H.Parkin and W.E.Scholes, The horizontal propagation of sound from a jet close to the ground at Hatfield, J. Sound Vib., 2:353–374 (1965). 34 K.Attenborough, Review of ground effects on outdoor sound propagation from continuous broadband sources, Appl. Acoust., 24:289–319 (1988). 35 J.Nicolas, J.L.Berry and G.A.Daigle, Propagation of sound above a finite layer of snow, J. Acoust. Soc. Am., 77:67–73 (1985). 36 K.Attenborough, Ground parameter information for propagation modeling, J. Acoust. Soc. Am., 92:418–427 (1992); see also R.Raspet and K.Attenborough, Erratum: ‘Ground parameter information for propagation modeling’, J. Acoust. Soc. Am., 92: 3007 (1992). 37 R.Raspet and J.M.Sabatier, The surface impedance of grounds with exponential porosity profiles, J. Acoust. Soc. Am., 99:147–152 (1996).
Chapter 3 Predicting the acoustical properties of outdoor ground surfaces 3.1 Introduction In many outdoor noise prediction schemes, ground surfaces are considered as either ‘acoustically hard’, which means that they are perfectly reflecting, or ‘acoustically soft’, which implies that they are perfectly absorbing. According to ISO 9613–2 [1], any ground surface of low porosity is to be considered acoustically hard and any grass-, tree-, or potentially vegetation-covered ground is to be considered acoustically soft. Although this might be an adequate representation in some circumstances, it oversimplifies a considerable range of properties and resulting effects. Even the category of ground known as ‘grassland’ involves a wide range of ground effects. Where the main objective is to predict outdoor sound at long range including effects of discontinuous ground, meteorological effects, diffraction by natural and artificial barriers and topography, it is sensible to use the simplest possible descriptions of the acoustical properties of ground surfaces. However, in relatively simple propagation conditions, for example over flat grassland around airports, better accuracy should result from attempts to characterize the ground more completely. The interaction of sound with the ground includes several phenomena known collectively as ground effect. A convenient indicator of this interaction is the spectrum of the ratio of the total sound level at a receiver to the direct sound that would be present in the absence of the ground surface. This has been called the excess attenuation due to the ground surface and has been described in Chapter 2. As long as the ground may be considered as locally reacting, that is the surface impedance is independent of the angle of incident sound, the excess attenuation at a given receiver may be calculated from knowledge of the surface impedance and the source-receiver geometry. Most naturally occurring outdoor surfaces are porous. As a result of being able to penetrate the porous surface, ground-reflected sound is subject to a change in phase as well as having some of its energy converted into heat. The acoustical properties of porous ground are affected by the ease with which air can move in and out of the ground. This is indicated by the flow resistivity which represents the ratio of the applied pressure gradient to the induced volume flow rate per unit thickness of material. If the ground surface has a high flow resistivity, it means that it is difficult for air to flow through the surface. Typically this would result from very low surface porosity. Hotrolled asphalt has a very high flow resistivity whereas freshly fallen snow has a low flow resistivity. Section 3.2 reviews the various models and parameters that have been used to calculate the impedance of ‘smooth’ ground surfaces. As well as being porous, most naturally occurring outdoor ground surfaces are rough at some scale. The effects of roughness scales much smaller than the incident sound wavelengths are considered
Predicting the acoustical properties
67
separately in section 3.3. At low frequencies such as those encountered in blast noise, the elasticity of the ground may have an influence on outdoor sound and this possibility is explored in section 3.4. Methods of measuring ground impedance are described in Chapter 4.
3.2 Models for ground impedance 3.2.1 Empirical and phenomenological models A widely used, semi-empirical single-parameter model, due to Delany and Bazley, for propagation constant and relative normal surface impedance ([2, 3], also introduced in Chapter 2) suggests that
(3.1)
Zc=1+0.0571X−0.754+i0.087X−0.732, (3.2) where X=ρ0f/Rs, ρ0 being the density of air, Rs the flow resistivity and f the frequency. These equations are based on best fits to a large number of (impedance tube) measurements made with many fibrous materials having porosities close to 1. Delany and Bazley suggest that the range of validity of their relationships is 0.01< X<1.0. Even for high porosity materials, many authors have found that (3.2) predicts the wrong frequency dependence for normal surface impedance at low frequencies and have suggested various modifications to these formulae [4, 5, 6]. Soils have porosities much less than 1 and rather higher flow resistivities than fibrous materials. Consider a soil of flow resisitivity 120 kPa s m−2. At 500 Hz, X=0.0005, which is well below the suggested range of validity for the semi-empirical relationships (3.1) and (3.2). Nevertheless, (3.1) and (3.2) have been used with tolerable success to characterize outdoor surface impedances as long as X=f/Reff; where Reff, the effective flow resistivity, is treated as an adjustable parameter. For the high flow resistivities typical of soils, (3.2) predicts a reactance that exceeds the resistance over an appreciable frequency range. This is the kind of impedance behaviour that can be predicted for a rigid-porous layer (see section 3.2.3) or a porous semi-infinite medium with a rough surface (see section 3.3). Grass-covered surfaces often have a layered structure in which the root zone near the surface has a lower flow resistivity than the substrate ([7], also see section 3.4). Even though the wave penetrating the pores is predicted to have an attenuation that increases with the square root of frequency, near-surf ace layers may influence ground surface impedance. Rasmussen [7] found it possible to improve agreement with short-range propagation data over a grass-covered surface by assuming a hard-backed layer structure and by using
Predicting outdoor sound
68
equations (3.1) and (3.2) with the formula for the impedance of a hard-backed layer of thickness d, Z(d)=Zc coth(−ikd). (3.3) Morse and Ingard [8] have suggested a phenomenological model for the acoustic behaviour of porous materials. This introduces three parameters: flow resistivity (Rs), porosity (Ω) and a structure factor (K). Their model may be expressed as
(3.4) where k0=ω/c0. Thomasson [9] has obtained good agreement with indoor and outdoor data by using a four-parameter version of the phenomenological theory, that is using (3.4) in (3.3), to predict the surface impedance of a hard-backed layer. Hamet [10] has used a modified form of this model, which allows for the frequency dependence of viscous and thermal effects (see section 3.2.2), to predict the acoustical properties of porous asphalt. His model may be written as follows:
(3.5) where Fµ=1+iωµ/ω, F0=1+iω0/ω, ωµ=(Rs/ρ0)(Ω/K), ω0=ωµ(K/NPR) and NPR is the Prandtl number for air. 3.2.2 Pore-based microstructural models The acoustical properties of the ground may be modelled as those of a rigid-porous material and characterized by a complex density, containing the influence of viscous effects, and a complex compressibility, containing the influence of thermal effects. Thermal effects are much greater in air-filled materials than in water-filled materials. Precise forms of these quantities may be obtained by considering a micro structure of narrow pores or tubes. This offers a more rigorous scientific basis for ground impedance prediction than phenomenological [8] or semi-empirical [2] approaches. According to Stinson [11], if the complex density in a (single) uniform pore of arbitrary shape is written as
(3.6)
Predicting the acoustical properties
69
where λ is a dimensionless parameter, then the complex compressibility is given by (3.7) is the adiabatic compressibility of air. where H(λ) has been calculated for many ideal pore shapes [11–14] including circular capillary, infinite parallel sided slit, equilateral triangle and rectangle. The results are listed in Table 3.1. The dimensionless parameter λ may be related to the (steady) flow resistivity (Rs) of the bulk material through use of the Kozeny-Carman formula [15],
(3.8) where the hydraulic radius, rh=‘wetted’ area/perimeter, s0 is a steady flow shape factor and q2 is tortuosity, defined as the square of the increase in path length per unit thickness of material due to deviations of the steady-flow path from a straight line. This means that it is possible to write λ2=2s0ωρ0q2/ΩRs where, for the pore shapes mentioned previously, rh and s0 are defined in Table 3.2. Values of porosity and tortuosity for some granular materials are listed in Table 3.3 [16–20]. Once the complex density (ρ(ω)) and complex compressibility (C(ω)) of the individual pores are known, then the bulk propagation constant (k(ω)) and Table 3.1 Complex density functions for various pore shapes (where ν=µ/ρ0) Pore shape
λ
Slit (width 2b) Cylinder (radius a)
b(ω/ν)0.5 α(ω/ν)0.5
H(λ)
Equilateral triangle (side d) Rectangle (sides 2a, 2b)
Table 3.2 Hydraulic radius and steady flow shape factors Pore shape
rh
s0
Slit (width 2b) Cylinder (radius a) Equilateral triangle (side d) Square (side 2a)
b a/2
1.5 1 5/6 0.89
a/2
Predicting outdoor sound
70
Table 3.3 Some measured and calculated values of porosity and tortuosity Material
Porosity Source/method of (Ω) determination
Tortuosity Source/method of determination (q2)
Lead shot, 3.8 mm 0.385 diameter particles
Measured by weighing
1.6 1.799
Gravel, 10.5 mm grain size Gravel, 5–10 mm grain size 0.68 mm diameter glass beads Coustone Clay granulate, later lite, 1–3 mm grain size Olivine sand
1.55
0.375
Measured by weighing Measured by weighing Unspecified [17]
0.4 0.52 0.725
Unspecified [17] [19] Measured [20]
0.444
Measured [20]
0.45 0.4
1.46 1.742 1.833 1.664 1.25
1.626
Estimate from 1/Ω0.5 (also fits acoustic data) Cell model predictions [16] Deduced by fitting surface admittance data Deduced by fitting surface admittance data Measured [18] Cell model predictions [16] Measured [18] Deduced by fitting surface admittance data (assuming porosity=0.52) Cell model predictions [16]
relative characteristic impedance (Zc(ω)) of the bulk porous material may be calculated from (3.9a)
(3.9b)
Equation (3.9b) implies that the bulk compressibility Cb(ω)=ΩC(ω). There are various published methods that allow for arbitrarily shaped pores. Attenborough [21] scales the complex density function directly between pore shapes and introduces an adjustable dynamic pore shape parameter (sA). For example, the bulk complex density function for parallel-sided slit pores is given by [14]
(3.10) where
Predicting the acoustical properties
71
The pore shape parameter sA=1 for slit-like pores and 0.745<sA<1 for pore shapes varying between equilateral triangles and slits. If circular cylindrical pore shapes are used as the basis, then the dimensionless parameter may be written as
This formulation retains explicit dependence on sA even in the low-frequency limit. Champoux and Stinson [12] have pointed out that to satisfy the correct limiting behaviour for the complex density, in particular that −iωρb→Rs as ω tends to zero, this method requires sA to be frequency-dependent. Their method of allowing for arbitrary pore shape is closer to that originally suggested by Biot [22] and the resulting pore shape parameter (sB) has the advantage of being frequency-independent. Using this approach, with reference to the functions for slit-like pores, we write the complex density for the bulk material as
(3.11) where
(3.12)
and
1<sB<1.342 for pore shapes varying from slits to equilateral triangles. This approach scales the viscosity correction or dynamic viscosity function F(λ) instead of the complex density function. Since F(λ) tends to unity in the low-frequency limit, this method of defining ρb(λ) does not have any explicit dependence on a dynamic pore shape factor. In the low-frequency limit, the dependence on pore shape is only that implicit in the flow resistivity through (3.8).
Predicting outdoor sound
72
For a given bulk flow resistivity, porosity and tortuosity, although the complex density and complex compressibility, calculated from (3.6), (3.7) and Tables 3.1 and 3.2 are found to depend on pore shape, the complex bulk propagation constant, the complex characteristic impedance (given by (3.9)) and corresponding surface impedance of a hardbacked layer (given by (3.3)), are predicted to be relatively insensitive to pore shape [21]. This is true particularly for low flow resistivities and at frequencies less than a few thousand Hz. Other micro structural factors of significance in pore-based modelling are the variation of pore cross-sections along their lengths and the associated distributions of pore sizes and shapes. To allow simultaneously for arbitrary pore shapes and for pore cross-sections that change along their lengths, Johnson et al. [23] interpret 1/H(λ) as a dynamic tortuosity and introduce two characteristic lengths (Λ and Λ′), which represent two modifications of the dimensionless parameter λ used in (3.11) and (3.12). The simplest formulations for bulk material complex density and complex compressibility resulting from this approach, are based upon limiting forms for small and large characteristic lengths and may be written as [13],
(3.13) where
and
(3.14)
where
In effect, the characteristic lengths introduce two ‘dynamic’ pore shape factors sρ (equivalent to sB) and sC into complex density and complex compressibility respectively. Note that the formulations in equations (3.13) and (3.14) omit factors of 1/Ω and Ω
Predicting the acoustical properties
73
respectively from the definitions of bulk complex density and compressibility. While this gives rise to similar expressions for propagation constant to that given by (3.9a), the resulting definition of characteristic impedance differs from that given by (3.9b), which assumes that the wave impedance is identical to the impedance of a semi-infinite homogeneous rigid-porous material. Allard et al. [13] introduce a factor of (1/Ω) into their calculation of surface impedance. The need for two shape factors may be argued from the fact that the wider parts of each pore tend to be more important for the complex compressibility while the narrower pore cross-sections dominate the complex density. Theoretically it is expected that sC>sρ, that is Λ′>Λ, and typically this has been found to be the case. However, for arbitrary media, the viscous and thermal shape factors must be treated as independently adjustable parameters. In fitting acoustic data for glass beads, porous asphalt and a granular rubber compound values of sC<sρ have been found to be necessary [14, 24]. A version of this model, based on the viscosity correction function for slit-like pores, which is likely to be more accurate at intermediate values of the dimensionless parameter, may be written as follows:
(3.15) and
(3.16)
where
It has been proved possible to calculate the shape factors (or characteristic lengths) for certain well-defined geometries (e.g. stacked cylinders [13] and stacked spheres [16]). Methods of measuring Λ′ by non-acoustic means and Λ by ultrasonic means have been published [25, 26]. By fitting data for fibrous materials [13] it has been found that sC≈2sρ(Λ′≈2Λ), whereas sC≈5sρ has been found appropriate for an ideal or model material having cylindrical pores with two diameters. Some values for the characteristic lengths in some granular materials are listed in Table 3.4 [27–30]. These show that the thermal characteristic length may exceed the viscous characteristic length by large factors. A theory for the acoustical characteristics of a medium consisting of identical stacked rigid spheres [16, 31] in terms of the radius of the spheres and packing
Predicting outdoor sound
74
Table 3.4 Values of characteristic dimensions and other parameters for some granular materials Material
Bulk density Viscous Λ(µ m) (kg m−3)
Thermal Porosity Tortuosity Flow resistivity Ref. Λ′(µ m) Rs (kPa s m−2)
Glass beads 133 0.385 1.8a 0.68 ±0.12 1525 93a a 16.8 1.87a 236 0.365 mm 1575 18.8a 263 0.362 1.88a 1.11±0.15 1582 mm 1.64±0.15 mm 28 80 0.37 1.7 Sand 1 1638b Sand 2 1560b 22 60 0.4 1.65 Snow N/A 50 100 0.81 1.5 Notes a Calculated from cell model [16, 31] using measured Ω, q2 and Λ′. b Calculated assuming a density of 2600 kgm−3 for the grains.
45.4a [27] 21.25a 9.86a
130 [28] 170 [29] 7 [30]
fraction has been developed. This model allows prediction of acoustical properties from knowledge only of (identical) grain size and porosity. For stacked identical spheres of radius R forming a granular medium with porosity h, the thermal characteristic length may be expressed as [31]
(3.17) and the relationship between thermal and viscous characteristic lengths is
(3.18) where
(3.19) The grain shape in soils is usually far from spherical. Nevertheless the model for stacked spheres offers a method for estimating the likely values of the characteristic lengths in a granular medium from knowledge of the mean grain size and this makes it more feasible
Predicting the acoustical properties
75
to use multi-parameter models for predicting acoustical properties of arbitrary granular media. Hence (3.16) is replaced by
(3.20) A method of allowing for a log-normal pore-size distribution, while assuming pores of identical (slit-like) shape has been developed [14] based on the work of Yamamoto and Turgut [32]. The viscosity correction function for a log-normal slit-pore distribution is given by
(3.21)
where and σ is the standard deviation of the distribution in units. The bulk complex density is calculated from
(3.22) so that, using Stinson’s relationship (3.7),
(3.23) An advantage of this way of modelling the acoustical properties of air-filled granular materials is that as long as the influence of pore shape is ignored (by assuming identical pores of a certain geometrical shape) and the flow resistivity, porosity, tortuosity and pore-size distribution are available from non-acoustical measurements, it does not require any adjustable parameters. The numerical integration introduced in (3.21) can be avoided by means of Padé approximations [33, 34]. For a medium consisting of identical pores of arbitrary shape (3.4c) may be written as follows:
(3.24a)
Predicting outdoor sound
76
where and F(ε) is the viscosity correction function. Low- and high-frequency asymptotes for the viscosity correction function may be expressed as F(ε)=1+θ1ε2+O(ε4),+O(ε4), ε→0 (3.24b) and F(ε)=θ2ε+O(1), ε→∞. Hence, a Padé approximation for the viscosity correction function in a medium with a log-normal pore-size distribution has been proposed in the form
(3.25) where a1=θ1/θ2, a2=θ1 and b1=a1. Values of these coefficients can be determined analytically for certain pore shapes (see Table 3.5). However, as will be discussed in section 3.2.5, the influence of pore shape per se is relatively small. 3.2.3 Approximate models for high flow resistivities Equations (3.8)-(3.11) lead to simple approximations for characteristic impedance and propagation constant in the limit of small λ (corresponding to low frequencies and high flow resistivities). These approximations (based on approximation of Table 3.5 Expressions for coefficients in (3.23) where ξ=(σ In 2)2 and σ is the standard deviation of the log-normal distribution in (such that pore dimension in ) Coefficients in (3.20)
Slit-like pores Equilateral triangles
Circular pores
θ1 θ2
(6/5)e4ξ−1
(4/3)e4ξ−1
(7/10)e4ξ−1
cylindrical pore functions) may be written as follows:
(3.26)
Predicting the acoustical properties
77
(3.27)
represents an effective flow where T replaces q2 used previously and resistivity. Here sp is equivalent to sA used earlier but determined using circular cylinder solutions as a basis rather than those used for slits. The equivalent expressions using slitpore functions as the basis are
(3.28)
(3.29)
Further approximation for high flow resistivity and low frequency produces
(3.30)
(3.31)
that is Re=Reff/Ω2. where It is useful to note the equivalent results to (3.28) and (3.29), obtained by approximating the Biot/Stinson/Champoux model (equations (3.8)–(3.10) and (3.12)), which are
(3.32)
Predicting outdoor sound
78
(3.33)
These are independent of pore shape (except through Rs) and give identical results to (3.26) and (3.27) if sp=0.5. Moreover (3.30) and (3.31) are equivalent to the phenomenological model (3.4) with structure factor equivalent to tortuosity but with the isothermal value of sound speed in the pores. After further approximation for high flow resistivity, (3.31) becomes
(3.34)
Equations (3.29) and (3.31), which are identical if sp is set equal to 0.5, may be regarded as single-parameter models for the surface impedance of a homogeneous semi-infinite rigid-porous medium with high flow resistivity, or at low frequency, where the single parameter is effective flow resistivity. They predict surface impedances in which real and imaginary parts are equal and decrease as the square root of frequency. Equations (3.28), (3.29) and (3.3) may be used together with the first two terms of the power series expansion of the hyperbolic cotangent to produce a simple approximation for the surface impedance of a hard-backed thin high-flow-resistivity layer [35]:
(3.35) where de=Ωd is an effective depth. In forest floors, the flow resistivity of the surface porous (litter) layer is low, and it lies above a porous substrate with finite impedance, so it is necessary to implement a suitable multi-layer model. This may be deduced, from transmission line analysis, by means of the following equation:
(3.36) where Z1 and Z2 are the relative characteristic impedances of the upper porous layer and porous substrate, respectively, k is the propagation constant in the upper porous layer and d is the layer thickness.
Predicting the acoustical properties
79
An approximation for a thin layer with an impedance backing such that the backing impedance is much higher than that of the layer is given by [35]
(3.37)
where de=Ωd and d is the layer thickness. Several authors have considered the surface impedance of a high flow resistivity, rigid-porous medium in which the porosity decreases exponentially with depth [35–38]. The most rigorous approximation for the surface of such a medium is [37]
(3.38)
where αe=(n′+2)α/Ω, where n′ is a grain shape factor such that the tortuosity is given by Both (3.33) and (3.34) imply X>R (as long as αe is positive), and may be written genetically in the form
(3.39)
and b=c0/8πγ. For a non-hard backed thin layer, αe=4/de. where An approximation for the surface impedance of a high flow resistivity porous medium with the porosity increasing exponentially with depth is given by (3.32) with negative αe. If αe is negative then (3.34) predicts a resistance that exceeds the reactance at all frequencies. An improved approximation at high frequencies uses either (3.22) and (3.23) or (3.29) instead of (3.27) or (3.30) and may be written [39] as either
(3.40a)
or
Predicting outdoor sound
80
(3.40b)
where Note that Re and are identical if sp=0.5. These introduce a third parameter Te=T/Ω2 which depends on the tortuosity and porosity and influences the high frequency values of the impedance. Taraldsen [40] has suggested that a model connecting permeability and porosity, of a similar form to that used in geophysics, transforms the (three parameter) phenomenological model (3.4) into a one-parameter form that gives rather similar results to the Delany-Bazley model (3.2). Taraldesen’s model for relative admittance, β(=1/Z), may be expressed as follows:
(3.41a)
(3.41b) where
(3.41c)
(3.41d)
Y=10 log(Reff) (3.41e)
Predicting the acoustical properties
81
Figure 3.1 Comparison between predictions of Taraldsen’s one-parameter model (3.41) and the Delany-Bazley model (3.2) for Reff=12,500 Pa s m−2. Figure 3.1 shows an example comparison between Taraldsen’s one-parameter model and the Delany-Bazley model for a relatively low effective flow resistivity Reff=12,500 Pa s m−2.
Predicting outdoor sound
82
3.2.4 Relaxation models By viewing the viscous and thermal diffusion in porous materials as relaxation processes, Wilson [41–43] has obtained models for the acoustical properties of porous materials in simple forms that, nevertheless, enable accurate predictions over wide frequency ranges. His results may be expressed as
(3.42a)
(3.42b)
where, for identical uniform pores, τe and τv, the thermodynamic and aerodynamic characteristic times respectively, are given by
(3.43a) and τe=NPRsB2τv. (3.43b) Essentially this represents a single-parameter model (the parameter being either τe or τv) for a given pore shape, flow resistivity and porosity. The relaxation model is very similar in form to Hamet’s modification of the phenomenological model [10]. By matching to the Delany and Bazley relationships for their range of validity, Wilson [42] has obtained particularly simple approximate relationships:
(3.43c) and
Predicting the acoustical properties
83
(3.43d) When substituted into (3.42), these relationships provide a single-parameter model that mimics (3.1) and (3.2) for 0.01<X<1.0 but is valid outside this range. For materials in which the pore cross-sections vary, Wilson has suggested a slightly more complicated and are replaced by form, again based on (3.42) but where τ1 and τh are appropriate low- and high-frequency versions of τe and τv. Wilson has shown that results equivalent to (3.15) and (3.16) may be obtained with τle=τhe=NPRsK2τv and In its most general form, this represents a four-or five-parameter model. Relaxation models have been found to be a particularly useful basis for numerical time domain calculations [43]. 3.2.5 Relative importance of microstructural parameters It is interesting to consider the relative importance of various microstructural features for the acoustical properties of ground surfaces. Figure 3.2 shows predictions of the surface impedance of hard-backed layers corresponding to a ‘snow-like’ that is low
Figure 3.2 Predicted surface impedance of a 0.05 m thick layer of ‘snow-like’ material, with flow resistivity 10 kPa s m−2, porosity 0.6 and tortuosity 4/3, composed of stacked identical grains or identical pores with specific shapes. flow resistivity medium with identical pores but assuming various different pore shapes. The key shows the dimensions of the corresponding spheres and pores. Clearly the predictions are not very dependent on the pore shape for a given flow resistivity and
Predicting outdoor sound
84
porosity. The only significant difference is between the prediction of the cell model for stacked spheres and the ‘uniform pore’ models for the real part of the surface impedance at low frequencies. This is consistent with the finding of Pride et al. [44] who considered pores with varying cross sections. Figure 3.3 shows the predicted effects of varying the standard deviation of the size distribution between 0 and 1 on the acoustical characteristics of a hard-backed layer rigid-framed porous media having values of flow resistivity and porosity intended to represent a grass-like medium. Broadening the pore-size distribution tends to increase the real part of the impedance while leaving the imaginary part relatively unaffected. The corresponding short-range excess attenuation spectra are shown in Figure 3.4. The effects are marginal and therefore unlikely to be distinguishable in practice. It will be shown in the next section that the predicted effects of small-scale surface roughness are much more significant.
3.3 Effects of surface roughness 3.3.1 Introduction As well as being porous, many outdoor surfaces are rough. Surface roughness scatters the sound both coherently and incoherently. The relative strengths of the coherent and incoherent parts of the scattered energy depend on the mean
Figure 3.3 Predicted effect on surface impedance of varying the width of the poresize distribution in a 0.05 m thick layer of a ‘grass-like’ slit-pore rigid-framed porous medium with flow resistivity 200 kPa s m−2, porosity 0.4 and tortuosity 5/2.
Predicting the acoustical properties
85
Figure 3.4 Predicted influence of the impedance variation shown in Figure 3.2 on the excess attenuation spectrum for source height 0.3 m, receiver height 0.3 m and range 1 m. size of the roughness compared with the incident wavelength. On disked or vegetationcovered soil, the roughness is small compared to the wavelengths of sound in the frequency range of interest (100–2000 Hz). Such roughness may be described as smallscale and, mainly, it gives rise to forward (coherent) scattering in the direction of specular reflection. However once the roughness size approaches the wavelengths of interest, nonspecular (incoherent) scattering dominates and ground interference effects are destroyed. The propagation of underwater sound over (or under) rough boundaries has been a topic of continuing interest for at least 30 years. Less attention has been paid to the equivalent situations in atmospheric acoustics. An important conclusion of previous work [45, 46], with regard to the coherent part of the scattering from the surface is that the impedance or admittance of the boundary is modified by the presence of small-scale roughness. Clearly this can be considered to have an influence on the (spherical wave) reflection coefficient and hence the ground effect, even above a ground medium that would have been considered acoustically hard if smooth. Tolstoy [47] has distinguished between two theoretical approaches, for predicting the coherent field resulting from boundary roughness where the typical roughness height is small compared to a wavelength. These are the stochastic and the boss models. Both of these reduce the rough surface scattering problem to the use of a suitable boundary condition at a smoothed boundary. According to Tolstoy [47], the boss method, originally derived by Biot [47] and Twersky [48], has
Predicting outdoor sound
86
the advantages that (i) it is more accurate to first order, (ii) it may be used even in conditions where the roughness shapes introduce steep slopes and (iii) it is reasonably accurate even when the roughness size approaches a wavelength. An advantage of the ‘boss’ approach to modelling roughness effects in outdoor sound calculations is that it may be used to predict propagation over artificially embossed surfaces both for experimental validation of theory and for designing useful ground effect over hard surfaces [50, 54]. Analytical approximations for the effective impedance of rough surfaces deduced from ‘boss’ theory are described in the next subsection and experimental data for roughness effects are presented in Chapter 4. 3.3.2 Impedance models including rough surface effects 3.3.2.1 Hard rough surfaces Twersky has developed a boss model [53–55] to describe coherent reflection from a hard surface containing semi-cylindrical roughnesses in which the contributions of the scatterers are summed to obtained the total scattered field. Sparse and closely packed distributions of bosses have been considered and interaction between neighbour scatterers has been included. His results lead to a real part of the effective admittance of the rough hard surface which may be attributed to incoherent scattering. Consider a plane wave incident on an array of semi-cylinders of radius a and mean centre-to-centre spacing b on an otherwise plane hard boundary (Figure 3.5).
Figure 3.5 3-D representation of a plane wave incident in the direction of vector k on a surface containing a regularly spaced grating of semi-cylinders of radius a. If the angle of incidence with respect to the normal is denoted by a and the azimuthal angle between the wave vector and the roughness axes is denoted by φ, Twersky’s results for the effective relative admittance β of a rough hard surface containing non-periodically spaced 2-D circular semi-cylinders are
Predicting the acoustical properties
87
β=η−iξ (3.44a) with
(3.44b)
(3.44c)
V=nπa2/2 is the raised cross sectional area per unit length, n is the number of semicylinders per unit length (=1/b), δ=2/1+I is a measure of the dipole coupling between the semi-cylinders, I=(a2/b2)I2 where
(1−W)2 is a packing factor introduced for random distributions, W=nb*=b*/b, b* is the minimum (centre to centre) separation between two cylinders and k is the wave number. W=1 for periodic spacing and W=0 for random spacing. The real part η of the admittance (which represents the incoherent or non-specular scattering loss term) is zero for periodic distributions of bosses. For grazing incidence normal to the cylinder axes, a=π/2 and azimuthal angle we obtain
(3.45a) With randomly distributed semi-cylindrical roughness, this simplifies further to
Predicting outdoor sound
88
(3.45b) According to Lucas and Twersky [50], for semielliptical cylinders with eccentricity K, so that V=nπa2K/2,
(3.45c) Twersky’s cylindrical boss theory may be generalized to scatterers of arbitrary shape by comparison with equivalent results from Tolstoy’s work. Equations (3.44)–(3.46) may be contrasted with the equivalent results from Tolstoy’s boss theory [49] for the effective admittance of a surface containing 2-D roughnesses of arbitrary shape, after correcting his expression for a missing coefficient σ. According to Tolstoy, β=−ikε(cos2 φ−σ cos2 α), (3.46) where
(3.47) s2=(1/2)(1+K) is a shape factor, K is a hydrodynamic factor depending on steady flow around a scatterer, ν2=1+(2πVs2/3b) is a scatterer interaction factor and V is the cross-sectional scatterer area above the plane per unit length. Values of K are known for various shapes [49]. For semielliptical cylinders K=a′/b′, where a′ is the height and b′ is the semibase. For a scatterer having an isosceles triangular section with side u and height h, K=1.05(h/u)+0.14(h/u)2. For semicylinders the expressions for ε and σ can be simplified to obtain
(3.48)
and
Predicting the acoustical properties
89
(3.49)
Equation (3.45b) can be rewritten as
(3.50) Comparison of equations (3.47) and (3.51) suggests that Twersky’s and Tolstoy’s expressions for the imaginary part of the effective admittance are equivalent for circular semicylinders if δ is replaced by (ε/V)+1=2s2/ν2. Moreover Twersky’s result (3.46) for elliptical semicylinders shows the same dependence on K, the eccentricity, as can be obtained from Tolstoy [49], that is δ=(1+K)/[1+IK(1+K)/2]. This more general expression for δ gives a dependence on the hydrodynamic factor K (through ε) and thus on the shape of the scatterer. This suggests that generalized forms for the real and imaginary parts of effective admittance may be obtained from (3.45), and the following form
(3.51)
where V represents the scatterer volume per unit area (raised area per unit length in 2-D). These results allow predictions of propagation over bosses of the various shapes for which K is known. In addition to the known values for semicylinders, semi-ellipsoids and triangular wedges, K for thin slats may be deduced by assuming that each slat affects the fluid flow as if it were a lamina [49]. The expression for the virtual mass of a lamina of width 2a is identical to the one for a cylinder of radius a, that is K=1. Table 3.6 summarizes the known values of the hydrodynamic factor for the various roughness shapes. 3.3.2.2 Rough finite impedance surfaces Tolstoy has considered sound propagation at the rough interface between two fluids [49] and his results have been used to predict the effective impedance of a rough porous boundary [51]. Consider the general case involving a planar distribution
Predicting outdoor sound
90
Table 3.6 Hydrodynamic factors for use in effective admittance models Shape of 2-D roughness
K
Semi-cylindrical Semi-elliptical, height a′, semi-base b′ Isosceles triangle, side u, height h Thin rectangle (slat)
1 a′/b′ 1.05(h/u)+0.14(h/u)2 1
of small fluid scatterers, N per unit area, embedded in a fluid half space with density and sound speed ρ3 and c3 beneath a fluid half space characterized by ρ1 and c1. The scatterers have density ρ2 and c2, height h, centre-to-centre spacing l and occupy a total volume σV above the plane. The effective admittance β* of surfaces with 3-D scatterers, is given by β*=−ik0ε′+βs (3.52) where βs represents the impedance of the imbedding plane, and
if
and c1
(3.53)
Predicting the acoustical properties
91
For 2-D scatterers, the corresponding effective admittance is given by
(3.54) where
(3.55)
and θ(=π/2−φ) is the angle between the source-receiver axis and the normal to the scatterer axis. If the embedding material and scatterers are rigid and porous, then they can be treated acoustically as if they are fluids but with complex densities and sound speeds. These complex quantities may be calculated from any of the models described in the previous section. (3.54) and (3.55) may be approximated by If
(3.56) and by
(3.57) respectively, where ks is the complex wave number within the lower half space (i.e. the imbedding material). Moreover for high-flow-resistivity surfaces and low frequencies, βsks≈γΩ. Consequently (3.58) implies that only the imaginary part of the smooth surface admittance is changed by the presence of roughness. This might be a basis for the acoustic determination of roughness in some circumstances.
Predicting outdoor sound
92
However, as remarked earlier, Tolstoy’s results for hard rough surfaces ignore incoherent or non-specular scatter. It is a straightforward heuristic extension to write the effective surface admittance of a porous surface containing 2-D roughnesses as
(3.58) where η is given by (3.49), δ is calculated from (2s2/ν2), s2 and ν2 being calculated from (3.56). For φ=0, a≠π/2 (normal to scatterer axes, but non-grazing incidence)
(3.59) For a=π/2, φ≠0 (grazing incidence but not normal to scatterer axes)
(3.60) If the roughness is periodic, then W=1 and only the imaginary part of admittance is changed. If the packing is random, then W=0 and the real part of the admittance changes by a factor that increases with f3. For non-grazing incidence, (3.60), with W=0, predicts the maximum roughness effect for a given value of Ω, V and βs. Roughness is predicted to be particularly significant for high flow resistivity or hard ground surfaces near grazing incidence. For ‘hard’ rough surfaces,
(3.61) The model for the effective admittance of the rough interface between two fluids was developed for semi-infinite media. However, for a high-flow-resistivity medium, the difference between the values of δI and δIh calculated from 2s2D/ν2D and 2s2/ν2 respectively is small. This is illustrated in Figure 3.6. Consequently, (3.60) and (3.61) may be evaluated by using any of the existing models for (smooth) surface admittance βs (see for example [14, 23, 26]) and by adding the effective admittance for hard rough ground (see section 3.3.2.1). Figure 3.7 shows predictions of the impedance of various randomly rough finite impedance surfaces at a grazing angle of 5°. At low frequencies, and for the listed parameters, it is predicted that there is a reduction in the real part of impedance compared with the imaginary part. Such behaviour at low frequencies is predicted also in the impedance of smooth ground surfaces if there is layering [14]. For larger roughness and layered ground, more complicated relationships between real and imaginary parts of
Predicting the acoustical properties
93
impedance may result. Note that the assumptions, kh
Figure 3.6 Comparison of |δ1|=2s2D/ν2D and δ1h=2s2/ν2 for parameter values: flow resistivity 500 kPa s m−2, porosity 0.4, tortuosity 2.5 and semi-cylindrical roughness radius 0.0075 m, mean spacing 0.03 m.
Predicting outdoor sound
94
Figure 3.7 Predicted impedance of smooth and rough finite impedance surfaces. The porous medium is assumed semi-infinite with uniform triangular pores, flow resistivity 500 kPa s m−2, porosity 0.4 and tortuosity=2.5. The solid lines represent the predicted relative impedance of the smooth porous surface. The broken lines correspond to random semi-cylindrical roughness 0.0075 m high with mean spacing 0.03 m. The dotted lines correspond to random semi-elliptical roughness, height 0.025 m, eccentricity (K) 1.5 and mean spacing 0.06 m. The rough surface impedance is predicted for a grazing angle of 5°. than 1. A common feature of predictions for the real part of impedance of rough finite impedance surfaces, is that, at high frequencies, they are less than would be expected for smooth surfaces with the same porosity and flow resistivity. The incoherent component of scatter ensures that the effective impedance of a randomly rough finite impedance surface tends to zero at high frequencies. It is clear from Figure 3.7, that the presence of even relatively sparse slight 2-D roughness, less than 0.001 m in height and with mean spacing of 0.05 m, is predicted to cause a significant change in the smooth surface impedance.
Predicting the acoustical properties
95
Figure 3.8 shows that the predicted normalized surface impedance of a rough porous surface may be approximated by formula (3.2) with an effective flow resistivity given by 0.8×the actual flow resistivity. Clearly this simple single-parameter prediction is similar to that due to the more sophisticated rough finite impedance model after parameter adjustment. Predictions such as those shown in Figure 3.8 may explain why (3.2) has been so successful in modelling the impedance of outdoor ground surfaces.
Figure 3.8 Predicted surface impedance of rough ground. Solid lines represent the predicted normalised surface impedance of a porous surface with 20/m semi-cylindrical roughness as specified in the caption for Figure 3.7. The dotted lines represent the result predicted by (3.2) with Rse=0.8×the actual flow resistivity. The dashed lines are predictions of equation (3.63). Also shown in Figure 3.8 are predictions of the formula
(3.62) where and is the rms roughness height. There are noticeable differences between the predictions above 2 kHz. However such frequencies are seldom of importance in predicting outdoor sound. Figure 3.7 shows that the predicted effect of roughness (small compared with wavelength) is to reduce the real part of the effective surface impedance while leaving the imaginary part relatively unaffected. Equation (3.63) and Figure 3.8 indicate that a tolerably successful prediction of the effective normalized impedance of a rough surface
Predicting outdoor sound
96
is that of the smooth surface but with a reduced real part. There is an important limitation on the domain of (3.63) which avoids unphysical predictions, that is a negative real part of impedance, when the flow resistivity and roughness height are large. Comparisons between data and impedance models are presented in Chapter 4. Figure 3.9 shows the predicted effect of various roughness specifications on the impedance of a grass-like layer. Figure 3.10 shows the corresponding excess attenuation predictions. The predictions in Figure 3.10 show that the effective impedance changes resulting from increase in mean roughness height from 1 to 4 cm causes the main ground effect to be shifted to lower frequencies. The predicted shifts are significant for excess attenuation and may be important in short-range ground characterization.
Figure 3.9 Predicted effect of increasing roughness parameter values on the normalized surface impedance of a ‘grass-like’ 5 cm thick layer: flow resistivity 200 kPa s m−2, porosity 0.4, tortuosity=1/porosity, triangular pores. Continuous lines correspond to a smooth boundary. Dashed lines correspond to 2D roughness consisting of 0.01 m radius randomly spaced semi-cylinders, mean centreto-centre spacing 0.04 m with axes normal to source-receiver axis. Dotted lines correspond to 2D roughness with 0.04 m radius, mean centre-to-centre spacing 0.16 m.
Predicting the acoustical properties
97
Figure 3.10 Predicted excess attenuation spectra corresponding to the impedance spectra shown in Figure 3.9.
3.4 Effects of ground elasticity Noise sources such as blasts and heavy weapons shooting create low-frequency impulsive sound waves which propagate over long distances, and can create a major environmental problem for military training fields. Such impulsive sound sources tend to disturb neighbours more through the vibration and rattling induced in buildings, than by the audible airborne sound itself [57, 58]. Human perception of whole body vibration includes frequencies down to 1 Hz [59] and the fundamental natural frequencies of buildings are in the range 1–10 Hz. Planning tools to predict and control such activities must therefore be able to handle sound propagation down to these low frequencies. Despite their valuable role in many sound propagation predictions, impedance models that assume rigid-porous ground have an intrinsic theoretical shortcoming that they fail to account for air-to-ground coupling through interaction between the atmospheric sound wave and surface waves in the ground. Air-ground coupling has been of considerable interest in geophysics, both because of the measured ground-roll caused by intense acoustic sources and the possible use of air sources in ground layering studies. Theoretical analyses have been carried out for spherical wave incidence on a ground consisting either of a fluid or solid layer above a fluid or solid half space [60]. However, to describe the phenomenon of acoustic-toseismic coupling accurately it has been found that the ground must be modelled as an elastic porous material [61–63]. The resulting theory is relevant not only to predicting the ground vibration induced by low-frequency acoustic sources but also, as we shall see, in predicting the propagation of low-frequency sound above the ground.
Predicting outdoor sound
98
The classical theory for a porous and elastic medium predicts the existence of three wave types in the porous medium: two dilatational waves and one rotational wave. In a material consisting of a dense solid frame with a low density fluid saturating the pores, the first kind of dilatational wave has a velocity very similar to the dilatational wave (or geophysical ‘P’ wave) travelling in the drained frame. The attenuation of the first dilatational wave type is however, higher than that of the P wave in the drained frame. The extra attenuation comes from the viscous forces in the pore fluid acting on the pore walls. This wave has negligible dispersion and the attenuation is proportional to the square of the frequency, as is the case for the rotational wave. The viscous coupling leads to some of the energy in this propagating wave being carried in the pore fluid as the second type of dilatational wave. In air-saturated soils, the second dilatational wave has a much lower velocity than the first and is often called the ‘slow’ wave, the dilatational wave of the first kind being called the ‘fast’ wave. The attenuation of the ‘slow’ wave stems from viscous forces acting on the pore walls and from thermal exchange with the pore walls. Its rigid-frame limit is very similar to the wave which travels through the fluid in the pores of a rigidporous solid [64]. It should be remarked that the slow wave is the only wave type considered in the previous discussions of ground effect. When the ‘slow’ wave is excited, most of the energy in this wave type is carried in the pore fluid. However, the viscous coupling at the pore walls leads to some propagation within the solid frame. At low frequencies, it has the nature of a diffusion process rather than a wave, being analogous to heat conduction. The attenuation for the ‘slow’ wave is higher than that of the first in most materials and, at low frequencies, the real and imaginary parts of the propagation constant are nearly equal. The rotational wave has a very similar velocity to the rotational wave carried in the drained frame (or the ‘S’ wave of geophysics). Again there is some extra attenuation due to the viscous forces associated with differential movement between solid and pore fluid. The fluid is unable to support rotational waves, but is driven by the solid. The propagation of each wave type is determined by many parameters relating to the elastic properties of the solid and fluid components. Considerable efforts have been made to identify these parameters and determine appropriate forms for specific materials. In the formulation described here, only equations describing the two dilatational waves are introduced. The coupled equations governing the propagation of dilatational waves can be written as [65]
(3.63)
(3.64)
Predicting the acoustical properties
99
where
is the dilatation or volumetric strain vector of the skeletal frame: is the relative dilatation vector between the frame and the fluid; u is the displacement of the frame, U is the displacement of the fluid, F(λ) is the viscosity correction function, ρ is the total density of the medium, ρf is the fluid density, µ=dynamic fluid viscosity and k is the permeability. The second term on the RHS of (3.65), (µ/k)(∂ξ/∂t)F(λ), allows for the damping through viscous drag as the fluid and matrix move relative to one another. m is a dimensionless parameter that accounts for the fact that not all the fluid moves in the direction of macroscopic pressure gradient as not all the pores run normal to the surface and is given by m=τρ0/Ω where τ is the tortuosity and Ω is the porosity. H, C and M are elastic constants that can be expressed in terms of the bulk moduli Ks, Kf and Kb of the grains, fluid and frame respectively and the shear modulus, µ, of the frame. Assuming that e and ξ vary as e−iωt, ∂/∂t can be replaced by −iω and equation (4.40) can be written as
(3.65) where ρ(ω)=(τρ0/Ω)+(iµ/ωk) F(λ) is the dynamic fluid density. The original formulation of F(λ) (and hence of ρ(ω)) was a generalization from the specific forms corresponding to slit-like and cylindrical forms but assuming pores with identical shape. Expressions are available also for triangular and rectangular pore shapes and for more arbitrary microstructures (see section 3.2). If plane waves of the form e=A exp(i(lx−ωt)) and ξ=B exp(i(lx−ωt)) are assumed, then the dispersion equations for the propagation constants may be derived. These are: A(l2H−ω2ρ)+B(ω2ρ0−l2C)=0 (3.66) and A(l2C−ω2ρ0)+B(mω2−l2M+iωF(λ) η/k)=0. (3.67) A non-trivial solution of (3.67) and (3.68) exists only if the determinant of the coefficient vanishes, giving
(3.68) There are two complex roots of this equation from which both the attenuation and phase velocities of the two dilatational waves are calculated.
Predicting outdoor sound
100
At the interface between different porous elastic media, there are six boundary conditions that may be applied. These are as follows: 1 continuity of total normal stress, 2 continuity of normal displacement, 3 continuity of fluid pressure, 4 continuity of tangential stress, 5 continuity of normal fluid displacement, 6 continuity of tangential frame displacement. At an interface between a fluid and the poroelastic layer (such as the surface of the ground) the first four boundary conditions apply. The resulting equations and those for a greater number of porous and elastic layers are solved numerically [13]. The spectrum of the ratio between the normal component of the soil particle velocity at the surface of the ground and the incident sound pressure, the acoustic-to-seismic coupling ratio or transfer function, is influenced strongly by discontinuities in the elastic wave properties within the ground. At frequencies corresponding to peaks in the transfer function, there are local maxima in the transfer of sound energy into the soil [61]. These are associated with constructive interference between down- and up-going waves within each soil layer. Consequently there is a relationship between near-surface layering in soil and the peaks or ‘layer resonances’ that appear in the measured acoustic-to-seismic transfer function spectrum: the lower the frequency of the peak in the spectrum, the deeper the associated layer.
Figure 3.11 Measured and predicted acousticto-seismic coupling ratio for a layered soil (range 3.0 m, source height 0.45 m).
Predicting the acoustical properties
101
Figure 3.11 shows example measurements and predictions of the acoustic-to-seismic transfer function spectrum at the soil surface [63]. The measurements were made using a loudspeaker sound source and a microphone positioned close to the surface, vertically above a geophone buried just below the surface of a soil which had a loose surface layer. Seismic refraction survey measurements at the same site were used to determine the wave speeds. The predictions have been made by using a computer code FFLAGS (Fast Field Program for Air-Ground Systems) that models sound propagation in a system of fluid layers and porous elastic layers [62]. The numerical theory (FFLAGS) may be used also to predict the ground impedance at low frequencies [66]. In Figure 3.12, the predictions for the surface impedance at a grazing angle of 0.018° are shown as a function of frequency for the layered porous and elastic system described by Table 3.7 and compared with those for a rigid porous ground with the same surface flow resistivity and porosity. The influence of ground elasticity is to reduce the magnitude of the impedance considerably below 50 Hz. Potentially, this is very significant for predictions of lowfrequency noise, for example blast noise, at long range. Figure 3.13 shows that the surface impedance of this four-layer poroelastic system varies between grazing angles of 5.7° and 0.57° but remains more or less constant for smaller grazing angles. The predictions show two resonances.
Figure 3.12 Predicted surface impedance at a grazing angle of 0.018° for poro-elastic and rigid porous ground (4-layer system, Table 3.7).
Predicting outdoor sound
102
Table 3.7 Ground profile and parameters used in the calculations for Figures 3.11 and 3.12 Layer Flow resistivity (kPa Porosity Thickness P-wave speed S-wave speed Damping (m) (m s−1) (m s−1) s m−2) 1 2 3 4 5
1740 1740 1,740,000 1,740,000 1,740,000
0.3 0.3 0.01 0.01 0.01
0.5 1.0 150 150 Halfspace
560 220 1500 1500 1500
230 98 850 354 450
0.04 0.02 0.001 0.001 0.001
The lowest frequency resonance is the most angle-dependent. The peak in the real part changes from 2 Hz at 5.7° to 8 Hz at 0.057°. On the other hand the higher frequency resonance peak near 25 Hz remains relatively unchanged with range. The peak at the lower frequency may be associated with the predicted coincidence between the Rayleigh wave speed in the ground and the sound speed in air (Figure 3.14). Compared with the near pressure doubling predicted by classical
Figure 3.13 Normalized surface impedance predicted for the 4-layer structure, sound speed in air=329 ms−1 (corresponding to an air temperature of −4°C) for grazing angles between 0.018 and 5.7°.
Predicting the acoustical properties
103
ground impedance models, the predicted reduction of ground impedance at low frequencies above layered elastic ground can be interpreted as the result of coupling of a significant fraction of the incident sound energy into ground-borne Rayleigh waves. Numerical theory has been used also to explore the consequences of this coupling for the excess attenuation of low frequency sound above ground [66]. Figure 3.15 shows the excess attenuation predictions for 6.3, 7.2 and 12.6 km ranges. There are significant ‘dips’ in the predicted excess attenuation spectrum. According to the convention used here, these represent maxima in the excess attenuation. The depths of the dips increase with range. The depth of the dip predicted at 3.5 Hz is 9 dB and shows a small frequency dependence with changing range. The enhanced (above +6 dB) excess attenuation spectrum immediately before the 3.5 Hz dip in the prediction for 12.6 km range is symptomatic of a surface wave. However as with the A/S impedance predictions, the Excess attenuation spectra predicted by FFLAGS for the four-layer poroelastic structure are rather dependent on the
Figure 3.14 Rayleigh wave dispersion curve predicted for the system described by Table 3.7 [66]. Reprinted with permission from Elsevier.
Predicting outdoor sound
104
Figure 3.15 Excess attenuation spectra predicted for source and receiver heights of 2 m and 0.1 m and three ranges assuming a sound speed in air of 329 m s−1. Reprinted with permission from Elsevier.
Figure 3.16 Excess attenuation spectra below 50 Hz predicted at ranges of 6300 m, 7200 m and 12,600 m, source height 2.0 m, receiver height 1 m, with an assumed sound speed in air of 332 m s−1.
Predicting the acoustical properties
105
assumed sound speed in air. Figure 3.16 shows corresponding predictions with an assumed sound speed of 332 m s−1. The lowest frequency dip is predicted to move to 2 Hz from 3.5 Hz and to become shallower. The dip between 20 and 30 Hz remains at the same frequency but becomes more pronounced. It is important to consider whether it is possible to propose a model for the surface impedance of the ground that will be more accurate than classical impedance model predictions at low frequencies. Figure 3.17 shows the excess attenuation spectra predicted for source height 2 m, receiver height 0.1 m and horizontal range of 6.3 km over a layered ground profile corresponding to Table 3.5 (assumed sound speed in air of 329 ms−1) and by classical theory for a point source above an impedance (locally reacting) plane (2.40) using the impedance calculated for 0.018 degrees grazing angle (Zeff, broken lines in Figure 3.14). The predictions show a significant extra attenuation between 2 and 10 Hz. The predictions indicate also that, for an assumed sound speed in air of 329 ms−1, and, apart from an enhancement near 2 Hz, the excess attenuation spectrum might be predicted tolerably well by using modified classical theory instead of a full poroelastic layer calculation. However Figure 3.18 shows the same information as Figure 3.17 but for an assumed sound speed of 332 m s−1. In this case the low frequency dip in the excess attenuation spectrum is not predicted as well by assuming an effective impedance.
Figure 3.17 Excess attenuation spectra predicted for source height 2 m, receiver height 0.1 m and horizontal range of 6.3 km by FFLAGS (assumed sound speed in air of 329 ms−1) and by classical theory using impedance calculated for 0.018° grazing angle. Reprinted with permission from Elsevier.
Predicting outdoor sound
106
Figure 3.18 As for Figure 3.17 but with an assumed sound speed in air of 332 m s−1. It is difficult to measure the surface impedance of the ground at low frequencies [67, 68]. Consequently, as yet, the predictions of significant ground elasticity effects have been validated only by data for acoustic-to-seismic coupling, that is by measurements of the ratio of ground surface particle velocity relative to the incident sound pressure [66]. The comparisons between predictions and data for acoustic-to-seismic coupling are discussed in Chapter 4.
References 1 ISO 9613–2:1996 Acoustics—attenuation of sound propagation outdoors—part 2: general method of calculation (International Standards Organisation 1996). 2 M.E.Delany and E.N.Bazley, Acoustical properties of fibrous absorbent materials, Appl. Acoust., 3:105–116 (1970). 3 M.E.Delany and E.N.Bazley, Acoustical properties of fibrous absorbent materials, National Physical Laboratory Aero Report AC71 (1971). 4 F.P.Mechel, Ausweitung der Absorberformel von Delany and Bazley zu teifel Frequenzen, Acustica, 35:210–213 (1976). 5 I.P.Dunn and W.A.Davern, Calculation of acoustic impedance of multilayer absorbers, Appl. Acoust., 19:321–334 (1986). 6 Y.Miki, Acoustical properties of porous materials—modifications of Delany and Bazley models J. Acoust. Soc. Jpn., 11:19–24 (1990). 7 K.B.Rasmussen, Sound propagation over grass covered ground, J. Sound Vib., 78(2): 247–255 (1981). 8 P.M.Morse and K.U.Ingard, Theoretical Acoustics, Princeton University Press, Princeton, NJ (1986). 9 S.I.Thomasson, Sound propagation above a layer with a large refractive index, J. Acoust. Soc. Am., 61:659–674 (1977).
Predicting the acoustical properties
107
10 J.F.Hamet and M.Bérengier, Acoustical Characteristics of Porous Pavements: A New Phenomenological Model, Internoise’93, Leuven, Belgium (1993); see also M.Bérengier, M.Stinson, G.Daigle and J.F.Hamet, Porous road pavements: acoustical characterization and propagation effects, J. Acoust. Soc. Am., 101:155–162 (1997). 11 M.R.Stinson, The propagation of plane sound waves in narrow and wide circular tubes and generalisation to uniform tubes of arbitrary cross-sectional shape, J. Acoust. Soc. Am., 89(1):550–558 (1991). 12 Y.Champoux and M.R.Stinson, On acoustical models for sound propagation in rigid frame porous materials and the influence of shape factors, J. Acoust. Soc. Am., 92(2): 1120–1131 (1992). 13 J.F.Allard, Propagation of Sound in Porous Media, Elsevier Applied Science, London (1993). 14 K.Attenborough, Models for the acoustical properties of air-saturated granular media, Acta Acust., 1:213–226 (1993). 15 P.C.Carman, Flow of Gases through Porous Media, Butterworths, London (1953). 16 O.Umnova, K.Attenborough and K.M.Li, Cell model calculations of dynamic drag parameters in packings of spheres. J. Acoust. Soc. Am., 107(6):3113–3119 (2000). 17 K.V.Horoshenkov and M.J.Swift, The acoustic properties of granular materials with pore size distribution close to log-normal, J. Acoust. Soc. Am., 110:2371–2378 (2001). 18 J.F.Allard, B.Castagnede, M.Henry and W.Lauriks, Evaluation of tortuosity in acoustic porous materials saturated by air, Rev. Sci. Instrum., 65:754–755 (1994). 19 M.J.Swift, The Physical Properties of Porous Recycled Materials, PhD Thesis, University of Bradford, UK, (2000). 20 P.Leclaire, O.Umnova, K.V.Horoshenkov and L.Maillet, Porosity measurement by comparison of air volumes, Rev. Sci. Instrum., 74:1366–1370 (2003). 21 K.Attenborough, On the acoustic slow wave in rigid framed porous media, J. Acoust. Soc. Am., 81:93–102 (1987). 22 M.A.Biot, Theory of elastic waves in a fluid-saturated porous solid. II High-frequency range, J. Acoust. Soc. Am., 28:168–178 (1956). 23 D.L.Johnson, J.Koplik and R.Dashen, Theory of dynamic permeability and tortuosity in fluidsaturated porous materials, J. Fluid Mech., 176:379–402 (1987). 24 P.Allemon and R.Hazelbrouck, Influence of pore size distribution on sound absorption of rubber granulates, Proc. Inter Noise 96, Publ. IOA, Book 2, 927–930 (1996). 25 P.Leclaire, M.J.Swift and K.V.Horoshenkov, Determining the specific area of porous acoustic materials from water extraction data, J. Appl. Phys., 84:6886–6890 (1998). 26 P.Leclaire, L.Kelders, W.Lauriks, C.Glorieux and J.Thoen, Determination of the viscous characteristic length in air-filled porous materials by ultrasonic attenuation measurements, J. Acoust. Soc. Am., 99(4):1944–1948 (1996). 27 Z.Fellah, C.Depollier and M.Fellah, Application of fractional calculus to the sound waves propagation in rigid porous materials: validation via ultrasonic measurements, Acust. Acta Acust., 88:34–39 (2002). 28 J-F.Allard, M.Henry and J.Tizianel, Pole contribution to the field reflected by sand layers J. Acoust. Soc. Am., 111(2):685–689 (2002). 29 M.Henry, P.Lemarinier, J.F.Allard, J.L.Bonardet and A.Gedeon, Evaluation of the characteristic dimensions for porous sound-absorbing materials J. Appl. Phys., 77:17 (1995). 30 M.Boeckx, G.Jansens, W.Lauriks and D.Albert, Modelling acoustic surface waves above a snow layer, Acust. Acta Acust., 90(2):246–250 (2004). 31 O.Umnova, K.Attenborough and K.M.Li, A cell model for the acoustical properties of packings of spheres, Acust. Acta Acust., 87:226–235 (2001). 32 T.Yamamoto and A.Turgut, Acoustic wave propagation through porous media with arbitrary pore size distributions, J. Acoust. Soc. Am., 83(5):1744–1751 (1988).
Predicting outdoor sound
108
33 K.V.Horoshenkov, K.Attenborough and S.N.Chandler-Wilde, Pade approximants for the acoustical properties of rigid frame porous media with pore size distribution, J. Acoust. Soc. Am., 104:1198–1209 (1998). 34 K.V.Horoshenkov and M.J.Swift, The acoustic properties of granular materials with pore size distribution close to log-normal, J. Acoust. Soc. Am., 110(5):2371–2378 (2001). 35 K.Attenborough, Ground parameter information for propagation modeling, J. Acoust. Soc. Am., 92:418–427 (1992); see also R.Raspet and K.Attenborough, Erratum: ‘Ground parameter information for propagation modeling’, J. Acoust. Soc. Am., 92: 3007 (1992). 36 R.Raspet and J.M.Sabatier, The surface impedance of grounds with exponential porosity profiles, J. Acoust. Soc. Am., 99(1):147–152 (1996). 37 R.J.Donate, Impedance models for grass covered ground, J. Acoust. Soc. Am., 61: 1449–1452 (1977). 38 K.Attenborough, Acoustical impedance models for outdoor ground surfaces, J. Sound Vib., 99:521–544 (1985). 39 S.Taherzadeh, Private Communication (1997). 40 G.Taraldsen, The Delany-Bazley impedance model and Darcy’s law, Acust. Acta Acust., 91:41–50 (2005). 41 D.K.Wilson, Relaxation-matched modeling of propagation through porous media including fractal pore structure, J. Acoust. Soc. Am., 94:1136–1145 (1993). 42 D.K.Wilson, Simple relaxation models for the acoustical properties of porous media, Appl. Acoust., 50:171–188 (1997). 43 D.K.Wilson, V.E.Ostashev, S.L.Collier, N.P.Symons, D.F.Aldridge and D.H.Marlin, Time-domain calculations of sound interactions with outdoor ground surfaces, Appl. Acoust. (in press). 44 S.R.Pride, F.D.Morgan and A.F.Gangi, Drag forces of porous medium acoustics, Phys. Rev. B., 47(9):4964–4978 (1993). 45 M.S.Howe, On the long range propagation of sound over irregular terrain, J. Sound Vib., 98(1):83–94 (1985). 46 I.Tolstoy, Smoothed boundary conditions, coherent low frequency scatter, and boundary modes, J. Acoust. Soc. Am., 75(1):1–22 (1984). 47 M.A.Biot, Reflection on a rough surface from an acoustic point source, J. Acoust. Soc. Am., 29:1193–1200 (1957). 48 V.F.Twersky, On scattering and reflection of sound by rough surfaces, J. Acoust. Soc. Am., 29:209–225 (1957). 49 I.Tolstoy, Coherent sound scatter from a rough interface between arbitrary fluids with particular reference to roughness element shapes and corrugated surfaces, J. Acoust. Soc. Am., 72(3):960–972 (1982). 50 R.J.Lucas and V.Twersky, Coherent response to a point source irradiating a rough plane J. Acoust. Soc. Am., 76:1847–1863 (1984). 51 K.Attenborough and S.Taherzadeh, Propagation from a point source over a rough finite impedance boundary, J. Acoust. Soc. Am., 98(3):1717–1722 (1995). 52 P.M.Boulanger, K.Attenborough, T.Waters-Fuller and K.M.Li, Rough hard boundary ground effects, J. Acoust. Soc. Am., 104(1):1474–1482 (1998). 53 V.Twersky, Scattering and reflection by elliptically striated surfaces, J. Acoust. Soc. Am., 40:883–895 (1966). 54 V.Twersky, Multiple scattering of sound by correlated monolayers, J. Acoust. Soc. Am., 73:68–84 (1983). 55 V.Twersky, Reflection and scattering of sound by correlated rough surfaces, J. Acoust. Soc. Am., 73:85–94 (1983). 56 H.Lamb, Hydrodynamics, Dover, New York (1945) p. 85. 57 C.Madshus and N.I.Nilsen, Low frequency vibration and noise from military blast activity— prediction and evaluation of annoyance, Proc. Inter Noise 2000, Nice, France (2000).
Predicting the acoustical properties
109
58 E.Øhrstrøm, Community reaction to noise and vibrations from railway traffic. Proc. Internoise 1996, Liverpool, UK. 59 ISO 2631–2:1998, Mechanical vibration and shock—evaluation of human exposure to whole body vibration—part 2: vibration in buildings. International Organization for Standardization. 60 W.M.Ewing, W S.Jardetzky and F.Press, Elastic Waves in Layered Media, McGraw-Hill Book Company, New York (1957). 61 J.M.Sabatier, H.E.Bass, L.M.Bolen and K.Attenborough, Acoustically induced seismic waves, J. Acoust. Soc. Am., 80:646–649 (1986). 62 S.Tooms, S.Taherzadeh and K.Attenborough, Sound propagation in a refracting fluid above a layered porous and elastic medium, J. Acoust. Soc. Am., 93(1):173–181 (1993). 63 N.D.Harrop, The Exploitation of Acoustic-to-Seismic Coupling for the Determination of Soil Properties, PhD Thesis, The Open University (2000). 64 K.Attenborough, On the acoustic slow wave in air filled granular media, J. Acoust. Soc. Am., 81:93–102 (1987). 65 R.D.Stoll, Theoretical aspects of sound transmission in sediments, J. Acoust. Soc. Am., 68(5):1341–1350 (1980). 66 C.Madshus, F.Lovholt, A.Kaynia, L.R.Hole, K.Attenborough and S.Taherzadeh, Air-ground interaction in long range propagation of low frequency sound and vibration—field tests and model verification, Appl. Acoust., 66(5):553–578 (2005). 67 G.A.Daigle and M.R.Stinson, Impedance of grass covered ground at low frequencies using a phase difference technique, J. Acoust. Soc. Am., 81:62–68 (1987). 68 M.W.Sprague, R.Raspet, H.E.Bass and J.M.Sabatier, Low frequency acoustic ground impedance measurement techniques, Appl. Acoust., 39:307–325 (1993).
Chapter 4 Measurements of the acoustical properties of ground surfaces and comparisons with models 4.1 Impedance measurement methods 4.1.1 Impedance tube Early measurements of reflection coefficients of outdoor ground surfaces at normal incidence used adaptations of the standing wave or impedance tube technique, employed primarily to obtain the absorbing properties of building materials [1]. The method assumes plane wave incidence and requires the measurement of the ratio of the maximum sound pressure to the level of the first (or subsequent) pressure minimum (as counted from the surface of interest) as well as the distance from the surface to the first minimum at each frequency. The rather different acoustical, physical and biological properties of outdoor grounds result in several problems not encountered often with architectural absorbents. These include the following: (i) the crucial importance of low background noise, probe end and tube absorption corrections [2] in measuring the relatively high impedances associated with many ground surfaces, (ii) the difficulties of establishing the surface plane location (particularly important in determining the phase (imaginary part) of the impedance), (iii) the changing micro-meteorological conditions and the formation of worm casts during lengthy measurements [3], (iv) the unrepresentative nature of the (necessarily) small tube sample in view of the lateral inhomogeneity typical of many grounds and (v) the possibility of destruction of the local ground structure during insertion of the lower end into the ground. If a probe microphone is used in the tube, there is the additional problem of devising a stable system for vertical probe traversal. Nevertheless several useful data sets for impedance as a function of frequency have been obtained with a vertical impedance tube and probe microphone [4, 5]. The impedance tube method has proved particularly successful as a laboratory technique for measuring the acoustical properties of snow [6]. However, this involved use of a horizontal tube with automatic tracking of the probe microphone and measurements both of hard-backed and quarter wavelength (air)-backed finite length samples. By this means it was possible to evaluate the normal surface impedance and the propagation constant; both quantities are important when describing propagation over such a low flow resistivity, potentially externally reacting surface as snow. A modification of the impedance tube method that has been adopted for use in building acoustics [7–8] measures the complex transfer function between two microphones positioned fairly near to the sample surface. The method has the advantage
Measurements of the acoustical properties
111
that it is possible, by use of a broadband signal, to obtain impedance data over a wide frequency range simultaneously rather than at one frequency at a time as required by the probe microphone technique. The technique however is not as accurate as the probe method [9–10] and gives rise to particular problems when the microphone spacing corresponds to integer numbers of quarter or half wavelengths. The microphone spacing (s) determines the frequency range of the measurement’s validity according to
and n is an integer. This technique has been used to determine the normal surface impedance of forest floors [11]. 4.1.2 Impedance meter The normal surface impedance of the ground has been obtained from direct measurements of pressure and volume velocity at the ground surface by means of a mechanically driven cylindrical Helmholtz resonator chamber, which was pounded into the ground [12]. The sound pressure was measured by a microphone, mounted flush in the wall of the chamber, and an optical monitor of the piston driver displacement permitted measurement of the phase angle between the volume velocity and the pressure. This enabled deduction of the real and imaginary parts of impedance over the frequency range 300 to 1000 Hz. While this method overcomes several of the problems associated with outdoor use of the impedance tube, it shares the difficulties associated with small sample size and the destructiveness of its insertion. 4.1.3 Non-invasive measurements 4.1.3.1 Direct measurement of reflection coefficient Dickinson and Doak [3] used a free field version of the impedance tube technique at normal incidence. Standing waves were set up along an axis between a loudspeaker source and the ground. The loudspeaker was mounted on an A-frame about 4 m high. The sound field was explored by a microphone traversing the axis and the normal surface impedance deduced in a similar manner to that used on impedance tube data. However, allowance must be made for spherical divergence of the various wavefronts. As long as the measurements are made at normal incidence and the sum of the source and receiver heights is a sufficient number of wavelengths above the ground, then the total field is given with adequate accuracy by the assumption of plane rather than spherical reflection coefficients in the analysis. Embleton et al. [4] adapted this free field technique to oblique incidence by measuring the interference field with a probe microphone along the track of the specularly reflected ray. Van der Heijden [13] avoided the need for a probe microphone in the free field
Predicting outdoor sound
112
techniques both at normal and oblique incidence by use of up to 16 microphone positions. A free field adaptation of the two-microphone impedance tube technique, developed initially for use in building acoustics [14], has been used successfully to measure the impedance of outdoor ground surfaces at normal and oblique incidence [15]. The typical geometry used included a source height of 2.1 m, an upper microphone height of 135 mm, microphone spacing of 75 mm and an angle of incidence of 45°. With this, geometry data for the complex transfer function between the two microphones and hence for impedance were obtained over the frequency range 200 to 2000 Hz. The method was found to be very sensitive to meteorological conditions and to the assumed ground surface location. Background noise problems were alleviated by use of narrow-band signals. At low frequencies it is difficult to achieve the source height required for the plane wave reflection coefficient assumption and to achieve the low background noise important to the free field standing wave technique. Daigle and Stinson [16] and Sprague et al. [17] have measured the phase gradient between a closely spaced, phase-matched pair of microphones in the normal incidence interference pattern instead. This technique requires accurate measurements only in regions of the peaks and valleys in the phase gradient. However it is extremely difficult to carry out, being extremely sensitive to unwanted reflections and to meteorological conditions. Using a loudspeaker source at a height of about 7 m and four different microphone spacings (between 10 and 80 cm), data have been obtained between 25 and 300 Hz. Tone bursts or more general impulses may be used as an alternative to continuous sound sources for impedance measurements. If the incident pulse is short enough, then unwanted reflections may be isolated and their effects may be eliminated. Van der Heijden et al. used tone bursts on ground surfaces brought into the laboratory [18]. Cramond and Don [19–20] have developed an outdoor technique in which a blank-firing rifle is used as a source and two microphones are deployed so that the ground-reflected signal at one arrives at the same time as the direct signal at the other. With appropriate choice of source and receiver heights (approximately 2 m) this enables direct deduction of reflection coefficient as a function of frequency within the limitations of the source spectrum (400 to 5 kHz). The method has been shown capable of distinguishing the impedance of a tyre track from that of the surrounding uncompacted soil. Also it has been used to show the existence of high-frequency (>1 kHz) peaks in the surface impedance of a soil wetted so that a thin (1 to 2 cm thick) saturated layer was formed at the surface. On the other hand the frequency range of the method is limited by lack of source energy at low frequencies and by turbulent scattering at high frequencies. 4.1.3.2 Impedance deduction from short-range measurements If a point source is located on a locally reacting surface and emits broadband sound, then for a reception point also on the surface Rp=−1 and (2.40) is simplified considerably [4]. Specifically,
(4.1)
Measurements of the acoustical properties
113
where for
(4.2) and
(4.3) This means that the excess attenuation (sound pressure level with respect to free field) is given by
(4.4) Equation (4.4) enables deduction of the magnitude of the normal surface impedance as a function of frequency from measurements of the excess attenuation spectrum (or of excess attenuation as a function of range at each frequency of interest). This method has been used by Embleton et al. [4] on grassland. Results were found to be in reasonable agreement with both impedance tube and free field data obtained over the same surface. An elaboration of this technique has been used by Habault and Corsain [21]. The excess attenuation at grazing incidence was obtained as a function of range at several frequencies and the impedance was deduced from a minimization algorithm using a grazing-incidence approximation [22]. The measurement technique was found to be restricted practically to frequencies above 500 Hz since the required range of measurement increases as the frequency of interest is decreased. Nevertheless the resulting data shows remarkably little scatter. More generally, measurements of the magnitude of the excess attenuation from a point source at non-grazing incidence may be deduced, by means of least-squares or template fitting to the theories described in Chapter 2, and yield impedance as a function of frequency [23]. Such a procedure may be regarded as a simple example of the matched field algorithms employed in underwater acoustics. It should be noted that excess attenuation is independent of the source spectrum, and consequently, in principle, any source may be used as long as it is broadband and the measurements are taken at sufficient distance that the source may be regarded as a point source. On the other hand the measurement range should be sufficiently small (<5 m) that meteorological influences are kept to a minimum [24]. Bolen and Bass [25] obtained impedances of grassland, soils and sands as a function of frequency from 40 to 300 Hz using a large loudspeaker as a source. However their data (even for the homogeneous sand) shows considerable scatter between successive frequencies. Probably, this is the result of the relatively large ranges
Predicting outdoor sound
114
(>15 m) used for their measurements and the fact that no constraint was imposed on the behaviour of the real and imaginary parts of impedance as separate functions of frequency. Such constraints may be imposed by the adoption of an appropriate model for the acoustical properties of the ground [23]. This may involve either short-range measurements of excess attenuation or the level difference between vertically separated microphones [23, 26–29]. The fitting of excess attenuation or level difference spectra, obtained near grazing incidence, is achieved by means of the classical theory for propagation from a point source over an impedance plane. As well as not requiring the assumption of plane waves, which is valid only at sufficient source height, higher frequencies and near normal incidence, the short-range propagation method also includes effects of small-scale surface roughness which may be considered to alter the surface impedance compared with a smooth surface with the same pore structure near grazing incidence (as discussed in section 3.3). Wempen [26] has measured and recorded a broadband signal in an anechoic chamber and then used this as a reference signal, transmitting it across several ground surfaces. In addition, the direct and ground-reflected waves were synchronized by feeding them into an FFT analyser and adjusting the time delay between them. This enabled high signal-to-noise ratios to be obtained with relatively short average times. An alternative to an anechoic chamber measurement to establish the free field spectrum level at the relevant range is to obtain a reference measurement after raising the source and receiver sufficiently far above the surface that ground effects may be ignored. This is possible in situ particularly when using a Maximum Length Sequence Signal Analysis (MLSSA) system. In this system the source is controlled to give a pseudo-random sequence of impulses. The received signal is analysed for this particular sequence. The resulting analysis is robust to background noise and gives the time domain or impulse response, which may be used to eliminate unwanted portions of the time series. Examples of excess attenuation spectra obtained in this way outdoors and at short range are shown in Figure 4.1. It should be noted, however, that MLSSA is not reliable in a time-varying environment. Deduction of excess attenuation requires knowledge of the free field spectrum of the source. However it may be more convenient to use the difference in spectra between two separately located reception points than to use the excess attenuation spectrum at a single point for the deduction of ground impedance. The points may be separated either horizontally or vertically. In particular the level difference between two vertically separated microphones at horizontal ranges of less than 3 m from a point source has been used extensively [23, 26–29]. The level difference spectrum may be calculated as the difference between the excess attenuation spectra at the two receivers. Ideally with the lower microphone on the surface the level difference spectrum corresponds closely in form to the excess attenuation spectrum at the upper microphone. In practice the lower microphone may be at a non-zero height but must be sufficiently low so that the first interference minimum in the corresponding excess attenuation spectrum lies above the frequency range of interest. This serves to avoid the effect of the very large sound velocity gradients that may occur close to the ground. On the other hand at very short range (<2 m) refraction effects are likely to be small.
Measurements of the acoustical properties
115
Figure 4.1 Excess attenuation spectra obtained with source and receiver at 0.1 m height and separated by 1 m over (a) grass 1, (b) soil, (c) grass 2, (d) bean plants and (e) wheat. The wheat was 0.55 m high. The different lines in each graph represent results of successive measurements.
Predicting outdoor sound
116
4.1.3.3 Model parameter deduction A large number of measurements of level difference spectra and excess attenuation spectra have been obtained at horizontal source-receiver ranges of 2 m or less, both in the laboratory and outdoors. These data have been fitted using some of the impedance models discussed in Chapter 3 [26–29]. Example laboratory measurements of excess attenuation spectrum over a sand surface, theoretical predictions and fits are shown in Figure 4.2. Wempen [26] has fitted his measured excess attenuation spectra data comparatively with several impedance models. A comprehensive set of outdoor excess attenuation measurements, at short range (between 7 and 15 m), have been made by Embleton et al. [30]. These data have been fitted by the single-parameter Delany-Bazley model (3.2) giving a wide range of effective flow resistivities for several surfaces (see section 4.6).
Figure 4.2 Measured excess attenuation spectrum with point source height=receiver height=0.1 m, horizontal separation 1 m, above 0.3 m thick sand (dashed line), compared with predictions of a two parameter model (3.38) (solid line) and a prediction for a distribution of triangular pore sizes (dotted line) using measured flow resistivity (473 kPa s m−2), assumed porosity (0.4), assumed tortuosity (2.5) and best-fit standard deviation of logBestnormal pore size distribution fit values for two parameter model are σe=499 kPa s m−2 and αe=−185 m−1. By making excess attenuation measurements at short range (4 m) and by making use of a phenomenological model ((3.3) and (3.4)) for the acoustical properties of a hard-backed
Measurements of the acoustical properties
117
porous layer, Thomasson [31] was able to deduce best-fit parameter values for grassland, hay and newly planted soil. If the impedance model requires fitting of more than two parameters then problems of non-uniqueness will arise [23, 32, 33]. These can be overcome if one of the parameters can be fixed beforehand. For example, the porosity of the surface may be known to within ±20%. Reference 68 in Chapter 3 discusses automation of the parameter fitting procedure. The deduction of parameters through the impedance-model-based approach could be of particular interest for acoustical monitoring of soils. If the ground surface is sloping, the source and receiver heights in any ground characterization should be measured perpendicular to the surface. As discussed in section 3.3, the qualitative effect of irregular or random roughness on porous surfaces is to change the effective admittance. The effects may be predicted quantitatively as long as the irregularity or roughness is small compared with the wavelengths of interest and either has identifiable simple shapes or known mean height and spacing. This means that, if an independent measurement of flow resistivity is available, it may be possible to deduce ground roughness from acoustical measurements. 4.1.3.4 The template method for model parameter deduction There is an ANSI standard method based on fitting measurements to templates of theoretical excess attenuation or level difference spectra [34]. These templates are based on the likely range of ground surface parameters and the resulting variation in excess attenuation or level difference spectra predicted according to various impedance models. The best-fit parameters for the impedance model are deduced by eye from the closest ‘template’ excess attenuation prediction to the data. An example of the use of the template method based on predictions of the two-parameter model (3.38) is shown in Figure 4.3. It is noted in the standard that, in the context of predicting outdoor sound, it would be preferable to deduce impedance directly since the result would be independent of the adequacy of any particular impedance model. 4.1.3.5 Direct impedance deduction A method of direct impedance deduction has been proposed based on 2-D minimization of the difference between data and theory at each frequency [35]. This requires considerable computation and is relatively inefficient. An alternative numerical method is based on root-finding [36]. This technique takes advantage of the fact that the classical approximation to the spherical wave reflection coefficient is an analytic function of the impedance. The resulting saving in computation time can be up to a hundred-fold without any loss in accuracy. Examples of results obtained with this method are given in sections 4.2 and 4.4.
Predicting outdoor sound
118
Figure 4.3 Excess attenuation spectrum measured (continuous line) at a microphone 0.1 m high and at a horizontal distance of 1 m from a point source loudspeaker 0.1 m above a sports field and predictions (dot-dash, broken, dotted lines) using various values of the parameters (see Legend) in a two-parameter impedance model. Clearly the prediction corresponding to an effective flow resistivity of 100 kPa s m−2 and effective alpha 10/m gives the best fit.
4.2 Comparisons of impedance data with model predictions Figures 4.4 and 4.5 compare data obtained by Cramond and Don using a pulse method [19, 20] with predictions of the semi-emprical Delany and Bazley model (3.2), and porebased models ((3.11), (3.12) and (3.30)). The data are for compacted earth and the same soil with the top 0.02 m loosened. There are significant differences between the measured impedance of compacted and loose soil. Although it is possible to obtain reasonable fits with the semi-empirical model in both cases, improved agreement is possible with models based on an assumed slit-pore microstructure. Figure 4.6 shows impedance data for a hard-backed sample of snow obtained in an impedance tube by Buser [6]. The measured flow resistivity and bulk density of this
Measurements of the acoustical properties
119
Figure 4.4 Impedance of compacted soil measured by Cramond and Don [20] and predictions using (3.2) with effective flow resistivity 450 kPa s m−2 (dotted lines), (3.11) and (3.12) and (3.28) (solid lines) with flow resistivity 275 kPa s m−2, porosity 0.4 and tortuosity 2. sample were 9.6 kPa s m−2 and 208 kg m−3 respectively. Assuming an ice density of 913 kg m−3, the latter value corresponds to a porosity of 0.774. The continuous lines in Figure 4.6 correspond to predictions of an identical slit-pore model assuming tortuosity is equal to inverse porosity. The dotted lines represent predictions of the relaxation model with sB=1. The dashed lines represent predictions of the Hamet phenomenological model (3.5) and the dash-dot lines represent predictions of the Delany-Bazley model (3.1)–(3.3) with effective flow resistivity given by the product of measured flow resistivity and porosity. The predictions of the relaxation model can be improved by adjusting the value of sB (1.4 gives better agreement with data). However it should be noted that this removes one of its advantages as a simple model. The slit-pore predictions are obtained using the measured flow resistivity and porosity, without any adjustment, and assuming that tortuosity is given by the inverse of porosity. It is noticeable that use of an effective flow resistivity given by the product of flow resistivity and porosity, in the Delany-Bazley model, gives relatively poor predictions for these data. Figure 4.7 shows example impedance values obtained by the direct deduction method (see section 4.1.3.4) over a smoothed sand surface [37] together with fits based on (3.11)–(3.13).
Predicting outdoor sound
120
Figure 4.5 Impedance of loosened soil (0.02m thick) above compacted soil measured by Cramond and Don [20] and predictions using (3.2) with effective flow resistivity 450 kPa s m−2 (dotted lines); (3.1), (3.2) and (3.3) (dashdot lines) with layer thickness 0.02m; (3.11), (3.12) and (3.30) (solid lines), with upper layer flow resistivity 100 kPa s m−2, porosity 0.4, tortuosity 1.5 and thickness 0.02 m; substrate flow resistivity 800 kPa s m−2, porosity 0.2 and tortuosity 3 and (3.31) (broken lines) in which Re=50 kPa s m−2 and αe=133 m−1.
4.3 Measured and predicted roughness effects Near-grazing propagation measurements at short-range have been made over a corrugated polymer foam surface in the laboratory and have demonstrated the roughness effects predicted by (3.54) [38]. However the assumed location of the effective admittance plane had to be adjusted to improve agreement with data at higher frequencies. Laboratory measurements of excess attenuation from an elevated continuous point source of white noise have been made in the frequency range 500 to 5 kHz over various hard and finite impedance boundaries containing 2-D ‘strip’ roughnesses [39, 40]. The resulting data has been used to confirm the predicted effects of roughness size, shape,
Measurements of the acoustical properties
121
concentration and the acoustical properties of their constituent material, on ground effect. As noted previously, relative SPL spectra measured over acoustically hard rough surfaces show a shift in ground effect to lower frequency than would be expected for a smooth acoustically hard surface.
Figure 4.6 Measured and predicted impedance of a 0.05 m thick layer of snow with measured flow resistivity 9.6 kPa s m−2 and porosity 0.774. Predictions use identical slit pore model ((3.11) and (3.12)) with measured flow resistivity and porosity and tortuosity=1/porosity (solid lines), HametBerengier (dashed), Wilson-relaxation (dotted) and Delany-Bazley (dash-dot) with Re=Ω Rs. Measurements [40] have shown that there are considerable differences between the ground effects caused by periodically and randomly spaced roughnesses with the same packing density. Periodically spaced roughnesses yield additional diffraction grating effects and give greater relative SPL minima. Predictions of ground effect due to regularly spaced roughnesses based on an extended effective admittance model are sensitive to small deviations from exactly periodic spacing. Incoherent scattering has been shown to play an important role for the source-receiver geometries and roughness
Predicting outdoor sound
122
sizes studied. The effective admittance model has been generalized for arbitrary scatterer shape. Diffraction grating effects have been predicted both by the boundary element model and by a heuristic modification of the classical analytical approximation for propagation from a point source near to an impedance boundary. The resulting approximation gives some good predictions of propagation over wooden slats and triangular wooden rods on a flat hard surface. However, for all of the larger scatterers considered, the boundary element code gives better predictions. Figure 4.8 shows results obtained over an artificially rough hard surface made from inverted ceramic tiles.
Figure 4.7 Impedance deduced from three complex excess attenuation measurements with a point source over smoothed sand (source height=receiver height=0.1 m (dotted and dot-dash lines), source height=receiver height=0.05 m (broken and dotted lines), range=1 m). The predictions (solid lines) use a semi-infinite slit-pore model [37], measured flow resistivity 420 kPa s m−2, assumed porosity=0.4 and tortuosity=1/porosity. Figure 4.9 shows impedance data obtained by direct deduction from complex excess attenuation measurements (see section 4.1.3.4) over a rough sand surface [37]. Figure 4.10 indicates that the boss model, including randomness and incoherent scatter, may be used to explain certain grassland impedance spectra [41]. The data were obtained over an established area of grass at Silsoe, UK, using the direct deduction technique described in section 4.3.1.4. Note that in Figure 4.10 the measured and predicted impedance tends to zero above 3 kHz.
Measurements of the acoustical properties
123
There is relatively little published in situ data specifically demonstrating the effects of roughness rather than the combined effects of changing roughness and flow resistivity outdoors. Data obtained by Aylor [42] demonstrates a considerable change in excess attenuation over approximately 50 m range after disking a soil and without any significant change in meteorological conditions. Figure 4.11 shows excess attenuation measured at short range over ground with various surface treatments [43]. Figures 4.12 and 4.13 show spectra of the difference in sound pressure levels received by vertically separated microphones over ploughed and subsoiled heavy (boulder) clay. The microphones were at 1 m and 0.1 m heights and located 30 m from the Electro-Voice loudspeaker source (centre at 1.65 m height) on a sunny
Figure 4.8 Measured excess attenuation spectrum (solid line) with source and receiver at heights of 0.25 m and 0.3 m respectively and 2.5 m apart over a surface consisting of 12 equally spaced glazed ceramic tile halfcylinders of radius 0.135 m. Also shown are predictions without and with scatterer interaction (dash-dot and dashed lines respectively) and of a boundary element model (dotted line).
Predicting outdoor sound
124
Figure 4.9 Comparison of measured (solid lines) and predicted (dotted and broken lines) impedance of a sand surface containing (approximately) semicylindrical roughness, height 0.008 m and centre-to-centre spacing 0.04 m. Predictions use (3.45) and assume semicylindrical roughness with given dimension and spacing and either the predicted (dotted line) or the measured (broken line) smooth surface impedance (see Figure 4.6).
Measurements of the acoustical properties
125
Figure 4.10 Normalized impedance data (open circles) obtained from complex excess attenuation measurements over established grassland at Silsoe, Beds, UK [41]. The theoretical predictions (solid lines) are for the impedance of a semi-infinite slit pore medium, with flow resistivity 400 kPa s m−2, porosity 0.4, tortuosity=1/porosity. A partially random (randomness parameter W=0.5) close packed semicylindrical roughness with 0.02 m radius is assumed. Predictions using these parameters but excluding roughness are represented by dotted lines.
Predicting outdoor sound
126
Figure 4.11 Measured excess attenuation (15) at short range (source height 0.35 m, receiver height 0.38 m and horizontal separation 1.5 m) above soil subject to the indicated surface treatments [43].
Measurements of the acoustical properties
127
Figure 4.12 Average level difference spectrum obtained with a loudspeaker source at 1.65 m height and vertically separated microphones at 1 and 0.1 m height at a range of 30 m over sub-soiled ground (solid line). Predictions assume either the smooth surface of a hardbacked slit pore medium with flow resistivity 80 kPa s m−2, porosity 0.4, tortuosity 2.5 and thickness 0.08m (broken line) or a surface with
Predicting outdoor sound
128
these parameters plus 0.05 m high closepacked but partially random (randomness factor 0.75) semicylindrical roughness (dotted line). Predictions are (a) without and (b) with L0=1 turbulence characterized by m (see Chapter 9).
Figure 4.13 Average level difference spectrum obtained at a range of 30 m over ploughed ground (solid line). Predictions assume either the smooth surface of a hard-backed slit pore medium with flow resistivity 10 kPa s m−2, porosity 0.4, tortuosity 2.5 and thickness 0.175
Measurements of the acoustical properties
129
m (broken line) or a rough surface with these parameters plus 0.08 m high, close-packed, semi-elliptical cylinder (eccentricity 1.6) roughness (dotted line) (a) without and (b) with turbulence. The turbulence parameters assumed are the same as for Figure 4.12. day with light wind. Vertical level differences are surrogates for excess attenuation since they are independent of the source spectrum. There are clear differences in the ground effects. Figures 4.12 and 4.13 also show theoretical predictions for the level difference spectra at 30 m. Predictions are shown both for rough and smooth surfaces in each case. Although some of the change in ground effect between the two conditions will result from differences in flow resistivity, improved agreement with data is obtained in both cases by including roughness effects and by attributing different surface roughness to each ground. Predictions are shown with and without allowance for turbulence. This suggests that, for the conditions and source-receiver geometry obtaining during these measurements, turbulence affects only the higher frequencies and is not responsible for the behaviour of the data around 1 kHz which seem consistent with the predicted effects of surface roughness. The roughness size assumed to fit the data over ploughed ground is greater than that assumed for the sub-soiled ground. This is consistent with the fact that sub-soiling produces less surface roughness than ploughing. The fitted thickness (0.175 m) for the surface layer of the ploughed ground is consistent with the expected depth of the plough pan. Figure 4.14 shows the predicted impedance corresponding to the parameters used to fit the level difference data in Figures 4.12 and 4.13. The impedance predicted for the ploughed field is affected by layer resonance, whereas that predicted for the sub-soiled ground has the ‘rough finite impedance’ form in which the impedance tends to zero (see section 3.6).
Predicting outdoor sound
130
Figure 4.14 Surface impedance of subsoiled (continuous lines) and ploughed clay soil (broken lines) predicted using the parameters identified by fitting the data shown in Figures 4.7 and 4.8.
4.4 Measured and predicted effects of ground elasticity As discussed in section 3.4, ground may be described as a layered poroelastic solid [44–49]. Surficial soils have sufficiently low stiffness and rigidity to have seismic wave speeds that may be rather less than the speed of sound in air. Ground elasticity is predicted to have its greatest influence on the surface impedance at low frequencies [49]. However, as remarked already, the measurement of surface impedance in situ at low frequencies is rather difficult [16, 17]. Moreover the influence of ground elasticity depends strongly on the attenuation of the elastic waves in the surface layer for which there is a paucity of data. Consequently the available measurements of impedance are rather inconclusive about the effects of elasticity. Figure 4.15 shows predictions of rigid- and elastic-framed models for the surface impedance of a soil at Bondville, IL, USA characterized as a porous layer over a nonporous elastic intermediate layer and a non-porous elastic substrate and by the parameters listed in Table 4.1 [17]. The impedance is predicted to be slightly less at low frequencies if the soil elasticity is taken into account. Data for the ratio of air pressure 0.1 m above the ground to the vertical soil particle velocity measured at a collocated geophone buried just beneath the ground surface measured in response to C4 explosions have been reported [49]. These data were
Measurements of the acoustical properties
131
Figure 4.15 Predicted surface impedance at low frequencies for a soil at Bondville, IL, USA [17]. The continuous lines represent predictions including effects of elasticity whereas the broken lines represent predictions that ignore these effects. A double layer structure was found by a shallow seismic survey and parameters (listed in Table 4.1) were found by direct measurement and by fitting data for the acoustic-to-seismic coupled spectrum [17]. Reprinted with permission from Elsevier. Table 4.1 Seismic parameters measured and deduced for Bondville site Layer Thickness (m) P-wave speed (ms−1) S-wave speed (m s−1) Density (kg m−3) Porosity 1 2 3
0.15 1.98 ∞
114 260 1800
30 120 340
900 2650 2650
0.6 0 0
Predicting outdoor sound
132
Table 4.2 Seismic layering deduced by Spectral Analysis of Surface Waves (SASW) at Finnskogen in Norway Layer Thickness (m) P-wave speed (m s−1) S-wave speed (m s−1) Damping 1 2 3 4 5 6 7
0.5 1.0 3.0 3.0 4.0 5.0 Halfspace
560 220 415 1500 1500 1500 1500
230 90 170 170 200 400 450
0.04 0.02 0.002 0.001 0.001 0.001 0.001
obtained at ranges between 2 and 17 km at Finnskogen in Norway. One objective was to derive an improved ground impedance model for low frequencies that takes ground elasticity into account. Calculations of the impedance of a multi-layered poroelastic system at an angle of incidence of 90° (grazing incidence) were obtained by means of a plane wave model (Multipor) [33]. This model was used also to compute the acousticseismic coupling ratio (A/S), that is the ratio of incident pressure to the component of solid particle velocity normal to the surface. This ratio has the same units as impedance (Pa s m−1) and may be termed an ‘acousto-seismic (A/S) impedance’. It was shown that the computed quantities are sensitive to ground elasticity. Moreover it was found possible, using the plane wave model, to match the computed acoustic-seismic coupling ratio to data measured at ranges of 2 km and above during blast propagation trials in Norway. The seismic profile deduced on site (see Table 4.2) using the Spectral Analysis of Surface Waves (SASW) method is altered to enable such data fitting (see Table 4.3). The plane wave model predicts results that are independent of range. On the other hand it is noticeable that the A/S impedance data have a significant spread below 7 Hz. Data have been obtained at horizontal ranges between 2 and 17 km. It is noticeable also, that with one possible exception, the data [43] do not show as sharp a minimum as predicted by Multipor. Minima in the A/S impedance data appear between 1.5 and 3 Hz. Table 4.3 Parameters used for fitting acoustic-to-seismic data at Finnskogen, Norway Layer Thickness Flow resistivity (kPa Porosity P-wave speed S-wave speed Damping (m s−1) (m s−1) (m) s m−2) 1 2 3 4
0.8 1.2 150 Halfspace
1740 1740 17,400 1,74,000
0.3 0.3 0.1 0.01
560 220 150 1500
230 98 850 354
0.04 0.02 0.001 0.001
Plane wave predictions show a significant minimum in the acoustic-to-seismic coupling ratio at 2.5 Hz which is the frequency at which the (non-porous elastic) Rayleigh wave speed predicted from the dispersion curve for the profile given in Table 4.3, coincides with the sound speed in air. Calculations for propagation from a point source that take ground elasticity, porosity and layering into account may be made using FFLAGS (Fast Field program for Layered
Measurements of the acoustical properties
133
Air-Ground Systems). FFLAGS enables atmospheric refraction to be included also but for the calculations presented here the atmosphere is assumed to be homogeneous. Details of FFLAGS are given elsewhere [45]. The flow resistivities and porosities that have been used in the calculations reported here are shown in Table 4.3. It should be noted that the assumed porosities are not consistent with the assumed densities but this inconsistency has little effect on the predictions. Example comparisons between predicted and measured acoustic-seismic impedance (i.e. the ratio of sound pressures at microphones divided by vertical soil particle velocities measured at collocated geophones), are shown in Figure 4.16(a). Points (circles, boxes and crosses) in Figure 4.16(a) represent data. Predictions by FFLAGS at ranges of 6.3 km, 7.2 km and 12.6 km for source height 2 m, receiver heights 0.1 m (microphone) and −0.05 m (geophone) and the four-layer ground profile (Table 4.3) are shown in Figure 4.16(b) and (c). Clearly FFLAGS predictions are in tolerable agreement with data, similar to the plane wave predictions [49] but, unlike these, show range dependence. The predictions are consistent with the differences between data at different ranges. The main minimum in the acoustic-seismic coupling spectrum below 5 Hz is predicted to be relatively shallow and to depend on range. Comparison of predictions in Figure 4.16(b) and (c) indicates that predictions have a significant dependence on the assumed sound speed in air. Figure 4.17 shows predictions obtained at 6300 m range with four different air sound speeds. Sound speeds in air of 329 ms−1, 332 ms−1, 335 ms−1 and 343 ms−1 correspond to temperatures of −4°C, 1°C, 6°C and 20°C respectively at sea level. In particular the predicted A/S impedance below 5 Hz is much altered by different air sound speed values. This is consistent with the interpretation that an air-coupled Rayleigh wave is propagating below 5 Hz since the slope of the predicted Rayleigh wave dispersion curve is small near 329 m s−1 [33, 49].
Predicting outdoor sound
134
Figure 4.16 (a) Acoustic-seismic coupling ratios deduced from measurements [33] at ranges of 6.3 km (circles), 7.2 km (boxes) and 12.6 km (crosses); (b) predictions of FFLAGS for sound speed in air of 329 ms−1; (c) predictions of FFLAGS for sound speed in air
Measurements of the acoustical properties
135
of 332 ms−1. The predictions for 6.3 km are represented by solid lines; for 7.2 km by broken lines and for 12.6 km by dotted lines.
Figure 4.17 Predicted acoustic-seismic coupling ratio at 6300 m assuming the layered ground system given by Table 4.3 and sound speeds in air of 329 ms−1 (thick solid line), 332 ms−1 (broken line), 335 ms−1 (dash-dot line) and 343 ms−1 (thin solid line) respectively. The data at a given range [49] display some variability. However, there will have been some sources of variability, for example meteorology, topography and changing conditions with range, which are not taken into account by FFLAGS. Predictions of the surface impedance of layered poroelastic ground were shown and discussed in Chapter 3 (Figures 3.12–3.17). As well as A/S coupling and surface impedance, FFLAGS may be used to predict excess attenuation spectra (i.e. the sound pressure spectra relative to free field). Such predictions were discussed in Chapter 3 also.
4.5 Comparisons between ‘template’ fits and direct impedance fits for ground impedance As part of a US Army field trial [50], surface impedance measurements have been made at various positions in a field of grass-covered sandy soil, on two gravel pits, over adjacent ploughed ground. Measurements of complex sound pressure level were made using a source consisting of mid-range Hi-Fi driver in a cylindrical cabinet and Maximum Length Sequence Signal Analysis (MLSSA-Half Blackman Harris window) for signal generation, acquisition and analysis (Paper 1, figures 8 and 9). Relatively shortrange measurements (maximum 3 m horizontal separation) with low source and receiver
Predicting outdoor sound
136
heights (no greater than 0.6 m) were made. Similar measurements were made over the ploughed ground and the gravel pits. An MLSSA generated signal consists of a pseudorandom sequence of pulses which sounds continuous and has a broad spectrum. Use of an MLSSA system for generation and acquisition gives good signal-to-noise ratio since it can be expected that background noise does not contain the same sequence as the source signal. However there may be problems with the use of MLS methods in time-varying environments. To enable calculation of the sound levels relative to free field (excess attenuation), free field data were obtained at the relevant ranges by raising the source and receiver heights to over 1 m. The analysis uses both a method similar to the Template Method for Measuring Ground Impedance [34], and the method of Direct Impedance Fitting [36]. The template method uses only the magnitude of the measured excess attenuation spectra whereas the direct impedance fitting requires the complex excess attenuation data, that is magnitude and phase, to calculate the real and imaginary parts of surface impedance. Figures 4.18– 4.21 show example results. In each case the left-hand graph shows the data and results of impedance model fitting using the template method. For the template method, three impedance models have been used: a single-parameter semi-empirical model (Delany and Bazley (3.2)), a two-parameter (variable porosity) model (3.12), in which the parameters are effective flow resistivity and rate of change of porosity with depth and a sixparameter rough porous layer model ((3.3) and (3.60)), assuming identical triangular pores and with two of the parameters, namely porosity and tortuosity, fixed at 0.4 and 2.5 respectively. The continuous lines represent the loudspeaker-gathered data, broken lines represent predictions using the two-parameter model, and dotted lines represent predictions using the six-parameter model. The dash-dot lines represent predictions using the single-parameter Delany and Bazley model (3.2). The right-hand graph in each of Figures 4.18 through 4.21 shows the directly deduced impedance spectra as black continuous lines. The other lines represent the various impedance model predictions using the best fit parameter values deduced from the excess attenuation spectra. Although it is not the only model that gives tolerable agreement with the measured excess attenuation spectra, the six-parameter model consistently gives best agreement with the directly deduced impedance spectra, particularly for the plowed ground and gravel pits. Gravel Pit 1 contained three layers of gravel within a total depth of 1.5 m. For the purposes of the template fitting for ground impedance, Pit 1 has been treated as a single layer and the ‘effective’ depth adjusted for best fit. With this simplification, the apparent flow resistivity is smaller than the measured flow resistivity for Pit 2 which is consistent with the larger stone size in the layer nearest the surface of Pit 1. In the case of gravel Pit 2, template fitting (after fixing the flow resistivity at the measured value for compacted 8 mm gravel) has been applied assuming either hard-backing or sandy soil backing. The latter slightly reduces the oscillations in the predictions observed at low frequencies. The directly deduced (linear) impedance spectra for both gravel pits suggest more or less pure resistance. Table 4.4 summarizes the best-fit values of the four adjustable parameter values for all of the surfaces according to the six-parameter model.
Measurements of the acoustical properties
137
Figure 4.18 Parts (a) and (c) show data for the sound level with respect to free field and deduced complex impedance of a sandy soil ground surface. The sound level differences were obtained from free field measurements with raised source and receiver and from measurements nearer the ground. For (a), the microphone and sound source were 0.54 m above the ground and the horizontal separation was 2 m. For (c), microphone and sound source were 0.23 m above the ground and the horizontal separation was 2 m. Parts (b) and (d) show real and imaginary parts of the impedance calculated from the measured and predicted complex sound pressure level differences as solid lines. Three impedance models have been used to obtain best fits with the magnitude of the sound level differences and predictions of the surface impedance. The dash-dot lines represent predictions of the single-parameter model (3.2); broken lines represent predictions of the two-parameter model (3.12); dotted lines represent predictions of the six-parameter model (3.3 and 3.60). For the single parameter model, the effective flow resistivity was 200 kPa s m−2. For the two-
Predicting outdoor sound
138
parameter model, effective flow resistivity was 80 kPa s m−2 and the porosity change rate was 0/m. For the six-parameter model, flow resistivity was 150 kPa s m−2, porosity was 0.4, tortuosity was 1/porosity or 2.5, roughness height was 0.015 m and the roughness spacing was 0.05 m. In this case the rough layer is assumed to be semi-infinite.
Figure 4.19 Parts (a) and (c) show data for the sound level with respect to free field and deduced complex impedance of the sandy soil surface obtained after ploughing. The sound level differences were obtained from free field measurements with raised source and receiver and from measurements near the ground across the furrows. For (a) microphone and sound source were 0.54 m above the ground and the horizontal separation was 3 m. For (c), microphone and sound source were 0.54 m above the ground and the horizontal separation was 2 m. Parts (b) and (d) show real and imaginary parts of the impedance calculated
Measurements of the acoustical properties
139
from the measured and predicted complex sound pressure level differences. The various lines represent predictions of impedance models as in Figure 4.18. For the single parameter model, the effective flow resistivity was 50 kPa s m−2. For the two-parameter model, effective flow resistivity was 30 kPa s m−2 and the porosity change rate was −100/m. For the six-parameter model, flow resistivity was 10 kPa s m−2, porosity was 0.4, tortuosity was 1/porosity or 2.5, roughness height was 0.04 m, roughness spacing was 0.1 m and layer thickness was 0.1 m.
Figure 4.20 Parts (a) and (c) show data for the sound level with respect to free field and deduced complex impedance of the ground surface obtained for a gravel pit containing three layers with different stone sizes; the largest stones being near the surface. The sound level differences were obtained from free field measurements with raised source and receiver and from measurements near the pit
Predicting outdoor sound
140
surface. For (a), microphone and sound source were 0.54 m above the ground and the horizontal separation was 2 m. For (c), microphone and sound source were 0.54 m above the ground and the horizontal separation was 1.5 m. Parts (b) and (d) show real and imaginary parts of the impedance calculated from the measured and predicted complex sound pressure level differences. The various lines represent predictions of impedance models as in Figure 4.18. For the single parameter model, the effective flow resistivity was 80 kPa s m−2. For the two-parameter model, effective flow resistivity was 20 kPa s m−2 and the porosity change rate was −250/m. For the six-parameter model, flow resistivity was 0.5 kPa s m−2, porosity was 0.4, tortuosity was 1/porosity or 2.5, roughness height was 0.01 m, roughness spacing was 0.05 m and layer thickness was 4.5 m.
Figure 4.21 Parts (a) and (c) show data for the sound level with respect to free field and deduced complex impedance of the surface of a pit containing medium sized gravel. The sound level differences were obtained from
Measurements of the acoustical properties
141
free field measurements with raised source and receiver and from measurements near the pit surface. For (a), microphone and sound source were 0.18 m above the ground and the horizontal separation was 2 m. For (c), microphone and sound source were 0.39 m above the ground and the horizontal separation was 1.5 m. Parts (b) and (d) show real and imaginary parts of the impedance calculated from the measured and predicted complex sound pressure level differences. The various lines represent predictions of impedance models as in Figure 4.18. For the single parameter model, the effective flow resistivity was 20 kPa s m−2. For the two-parameter model, effective flow resistivity was 25 kPa s m−2 and the porosity change rate was −200/m. For the six-parameter model, flow resistivity was 1.65 kPa s m−2 (the independently measured value of the compacted ‘pea’ gravel), porosity was 0.4, tortuosity was 1/porosity or 2.5, roughness height was 0.005 m, roughness spacing was 0.02 m and layer thickness was 1.5 m. Table 4.4 Summary of the four adjustable best-fit parameters for ground impedance (Figures 4.18–4.21) using the six-parameter model Location
Effective flow resistivity (kPa s m−2)
Layer Roughness depth (m) height (m)
Roughness spacing (m)
Unploughed ground near 250 m site Ploughed ground (across furrows) Pit 1 (triple layer) Pit 2 (medium gravel with sandy soil backing)
150
∞
0.015
0.05
20
0.1
0.04
0.1
0.5 1.65 (measured compacted value)
4.5 0.01 1.5 (actual 0.005 depth)
0.05 0.02
Table 4.5 Measured flow resistivities and porosities of grassland Ground type
Flow resistivity (kPa Porosity—(air-filled/ waterfilled) or total s m−2)
Loamy sand beneath lawn (no roots) Grass covered compact sandy soil Grass-covered field
677±93 463±122 300
0.288/0.137 0.417/0.052 0.345/0.160
Predicting outdoor sound Loamy sand beneath lawn (0.06 m thick with roots) Grass Grass root-filled layer Loamy sand with roots (mixed grass overgrowth)
142
237±77
0.505
220 189±91 114±52
— — 0.211/0.271
4.6 Measured flow resistivities and porosities Tables 4.5 to 4.7 show the range of flow resistivities and porosities that have been measured for outdoor ground surfaces [6, 13, 51–53]. The range of flow resistivities is particularly wide. According to Table 4.5, the flow resistivity of a ground described simply as ‘grassland’ could vary by a factor of five. According to Table 4.6, the flow resistivity of granular surfaces including soils, sands and gravel could vary by a factor of more than 200. Table 4.6 Measured flow resistivities and porosities of granular surfaces Ground type
Flow resistivity (kPa s m−2)
Wet sandy loam Compacted silt Mineral layer beneath mixed deciduous forest Sand (moistened) Loamy sand on plain Hard clay field Sand (dry) Bare sandy plain Dry sandy loam Humus on pine forest floor Sand (dry) Sand (grain dia. 0.25–0.33 mm) Sand (dry) Sand (grain dia. 0.33–0.5 mm) Gravel (mean max. grain dimension 1.81 mm)
Porosity—(air-filled/ waterfilled) or total
1501 1477 540±92
0.11 0.12 0.365/0.15
479 422±165 400 376 366±108 259 233±223 134 95.9 70.9 61.2 57.8
0.37 0.375/0.112 — 0.35 0.269/0.093 0.5 0.581/0.161 0.47 0.47 0.34 0.4 0.38
Table 4.7 Measured values for low flow resistivity outdoor surfaces Ground type Litter layer on mixed deciduous forest floor (0.02–0.05 m thick) Wet peat mul
Flow resistivity (kPa s m−2)
Porosity—(air-filled/ waterfilled) or total
30±31
—
24±5
0.55/0.29
Measurements of the acoustical properties Beech forest litter layer (0.04–0.08 m thick) Snow (old) Pine forest litter (0.06–0.07 m thick) Snow (new) Gravel (mean max. grain dimension 9.02 mm) Railway ballast [53]
143
22±13
0.825
16.4 9±5 4.73 1.648
0.574 0.389/0.286 0.86 0.38
0.2
0.491
Table 4.8 indicates that the presence of acoustically soft organic root layer (the root zone) above rootless mineral soil reduces the flow resistivity near the surface by a factor of between 2 and 5 compared with that in the substrate. The measured effects of roots on porosity are less dramatic. Table 4.8 Influence of root zones on flow resistivity and porosity Flow resistivity (kPa s m−2) Porosity (volume %)
Ground type
Bare loamy sand 422±165 Grass root layer in loamy sand 153±91 Grass root layer in loamy sand 237±77 Loamy sand beneath root-zone 677±93 Loamy sand with roots 114±52
48.3±1.7 47.9±4.4 50.5±9.3 42.5±1.7 55.2±4.5
Table 4.9 Ranges of effective flow resistivity (when used in (3.2)) that give the best agreement between predicted and measured excess attenuation or level difference spectra over various types of ground surface Description of surface Dry snow, new fallen 0.1 m over about 0.4 m older snow Sugar snow In forest, pine or hemlock Grass: rough pasture, airport, public buildings, etc. Roadside dirt, ill-defined small rocks up to 0.1 m mesh Sandy silt, hard packed by vehicles Asphalt, sealed by dust and light use Upper limit set by thermal-conduction and viscous boundary layer
Flow resistivity/cgs rayls (1 cgs rayl=1000 Pa s m−2) 10–30 25–50 20–80 150–300 300–800 800–2500 ~30,000 2×10⁵ to 1×10⁶
4.7 Effective flow resistivities and other fitted parameters A set of excess attenuation measurements at short range (between 7 and 15 m) made by Embleton et al. [30] over various surfaces have been fitted subsequently by the single-
Predicting outdoor sound
144
parameter Delany-Bazley model (3.2) giving a wide range of effective flow resistivities for several surfaces (see Table 4.9). There are impedance measurements that are not fitted well by using (3.2) [54, 55]. In some cases the ground impedance can be modelled adequately by a single parameter according to (3.30). In the many cases, where the soil is not homogeneous, (3.31) or (3.35) may turn out to give better fits. Using these equations and best fits to the experimental data, Table 4.10 may be constructed. Also listed in Table 4.10 [13, 19, 20, 56, 57], where available, are the non-acoustically determined values of flow resistivity and (air-filled) porosity. Table 4.10 Ground parameter data and corresponding best-fit impedance models Data source
Homogeneous van der Heijden [13] van der Heijden [13] Don and Cramond [20] Don and Cramond [20] Cramond and Don [19] Variable porosity van der Heijden [13] Don and Cramond [20] van der Heijden [13] Hard-backed layer lchida [56] van der Heijden [13] van der Heijden [13] Huisman [57]
Soil type
Best-fit parameters Frequency Measured parameters range (kHz) Re(kpa s αe de/m Rs (kPa s Ω (air) m−2) m−2)
Sand (15 cm)
240
0.27
— —
0.1–2
Sandy soil
366
0.269 715
— —
0.4–10
Grassland
—
—
373
— —
0.4–10
Grass-covered field
—
—
386
— —
0.4–10
Grassland
—
—
303
— —
0.4–10
Lawn
—
0.42
182
40 —
0.1–2
Hay-covered field
—
—
188
50 —
0.4–10
Meadow with grass 8–10 cm high
—
0.473 227
121 —
0.1–2
Snow Floor of a mixed forest containing firs Meadow covered in low vegetation Floor of pine forest
— —
— 43.8 0.394 60
— 0.014 — 0.0325 0.1–2
—
0.28
20.9
— 0.0146 0.1–2
—
—
7.5
16 —
0.07–7
It is noticeable that in many cases the acoustically deduced or ‘effective’ flow resistivities are smaller than the measured ones.
Measurements of the acoustical properties
145
References 1 American Society for the Testing of Materials, ASTM, Standard test method for impedance and absorption of acoustical materials by the tube method, 348–377 (1977). 2 Y.Ando, The directivity and acoustic centre of a probe microphone, J. Acoust. Soc. Jpn., 24:334–342 (1968). 3 P.J.Dickinson and P.E.Doak, Measurement of the acoustical impedance of ground surfaces J. Sound Vib., 13(3):309–322 (1970). 4 T.F.W.Embleton, J.E.Piercy and N.Olson, Outdoor sound propagation over a ground of finite impedance, J. Acoust. Soc. Am., 59(2):267–277 (1976). 5 R.Talaske, The Acoustic Impedance of a Layered Forest Floor, MS Thesis, Pennsylvania State University. 6 O.Buser, A rigid frame model of porous media for the acoustic impedance of snow, J. Sound Vib., 111:71–92 (1986). 7 American Society for the Testing of Materials ASTM E1 050, Standard testing method for impedance and absorption of acoustical materials using a tube, two microphones and a digital frequency analyzer (1986). 8 J.Y.Chung and D.A.Blaser, Transfer function method of measuring a duct acoustic properties: experiment, J. Acoust. Soc. Am., 68:907–921 (1980). 9 F.J.Fahy, Rapid method for the measurement of sample acoustic impedance in a standing wave tube, J. Sound Vib., 97:168–170 (1984). 10 W.T.Chu, Further experimental studies on the transfer technique for impedance tube measurements, J. Acoust. Soc. Am., 83:2255–2260 (1988). 11 G.M.Heissler, O.McDaniel and M.Dahl, Measurements of normal impedance of six forest floors by the tube method, Proc. 2nd Symposium on Long Range Sound Propagation and Acoustic/Seismic Coupling, Vol.2, 408–427, University of Mississippi PARGUM (1985). 12 A.J.Zuckerwar, Acoustic ground impedance meter, J. Acoust. Soc. Am., 73(6): 2180–2186 (1983). 13 L.A.M.van der Heijden, The Influence of Vegetation on Acoustic Properties of Soils, PhD Thesis, University of Nijmegen, The Netherlands (1984). 14 J.F.Allard and B.Sieben, Measurements of acoustic impedance in a free field with two microphones and a spectrum analyzer, 77:1617–1618 (1985). 15 D.Waddington, Acoustical Impedance Measurement using a Two-Microphone Transfer Function Technique, PhD Thesis, University of Salford (1990). 16 G.A.Daigle and M.R.Stinson, Impedance of grass covered ground at low frequencies using a phase difference technique, J. Acoust. Soc. Am., 81:62–68 (1987). 17 M.W.Sprague, R.Raspet, H.E.Bass and J.M.Sabatier, Low frequency acoustic ground impedance measurement techniques, Appl. Acoust., 39:307–325 (1993). 18 L.A.M.van der Heijden, J.G.E.M. de Bie and J.Groenewoud, A pulse method to measure the impedance of semi-natural soils, Acustica, 51(3):193–197 (1982). 19 A.J.Cramond and C.G.Don, Reflection of impulses as a method of determining acoustic impedance, J. Acoust. Soc. Am., 77:382–389 (1984). 20 C.G.Don and A.J.Cramond, Soil impedance measurements by an acoustic pulse technique, J. Acoust. Soc. Am., 77(4):1601 (1985). 21 D.Habault and G.Corsain, Identification of the acoustical properties of a ground surface, J. Sound Vib., 100(2):169–180 (1985). 22 D.Habault and P.Filippi, Ground effect analysis: surface wave and layer potential representations, J. Sound Vib., 79:527–550 (1981). 23 C.Hutchinson-Howorth, K.Attenborough and N.W.Heap, Indirect in-situ and free-field measurement of impedance model parameters or surface impedance of porous layers, Appl Acoust., 39:77–117 (1993).
Predicting outdoor sound
146
24 K.Attenborough, A note on short-range ground characterization, J. Acoust. Soc. Am., 95(6):3103–3108 (1994). 25 L.N.Bolen and H.E.Bass, Effects of ground cover on the propagation of sound through the atmosphere, J. Acoust. Soc. Am., 69:950–954 (1981). 26 J.Wempen, Ground effect on long range propagation, Proc. Inst. Acoust., September (1987). 27 J.M.Sabatier, H.Hess, W.P.Arnott, K.Attenborough, M.J.M.Romkens and E.H.Grissinger, In-situ measurements of soil physical properties by acoustic techniques, Soil Sci. Soc. Am. J., 54:658–672 (1990). 28 H.M.Hess, K.Attenborough and N.W.Heap, Ground characterization by short-range measurements of propagation, J. Acoust. Soc. Am., 87:1975–1985 (1990). 29 H.M.Hess, Acoustical Determination of Physical Properties of Porous Grounds, PhD Thesis, The Open University, Milton Keynes, UK (1988). 30 T.F.W.Embleton, J.E.Piercy and G.A.Daigle, Effective flow resistivity of ground surfaces determined by acoustical measurements, J. Acoust. Soc. Am., 74(4):1239–1244 (1983). 31 S.-I.Thomasson, Sound propagation above a layer with a large refractive index, J. Acoust. Soc. Am., 61(3):659–674 (1977). 32 J.M.Sabatier, R.Raspet and C.K.Frederickson, An improved procedure for the determination of ground parameters using level difference measurements, J. Acoust. Soc. Am., 94(1):396–399 (1993). 33 D.G.Albert, Acoustic waveform inversion with application to seasonal snow covers, J. Acoust. Soc. Am., 109:91–101 (2001). 34 ANSI S1.18, Measurement of ground impedance using the template method (1999). 35 C.Nocke, V.Mellert, T.Waters-Fuller, K.Attenborough and K.M.Li, Impedance deduction from broad-band, point-source measurements at grazing angles, Acust. Acta Acust., 83:1085–1090 (1997). 36 S.Taherzadeh and K.Attenborough, Deduction of ground impedance from measurements of excess attenuation spectra, J. Acoust. Soc. Am., 105(3):2039–2042 (1999). 37 K.Attenborough and T.F.Waters-Fuller, Effective impedance of rough porous ground surfaces, J. Acoust. Soc. Am., 108:949–956 (2000). 38 J.P.Chambers, J.M.Sabatier and R.Raspet, Grazing incidence propagation over a soft rough surface, J. Acoust. Soc. Am., 102(1):55–59 (1997). 39 K.Attenborough and S.aherzadeh, Propagation of sound from a point source over a rough finite impedance surface, J. Acoust. Soc. Am., 98:1717–1722 (1995). 40 P.M.Boulanger, K.Attenborough, S.Taherzadeh, T.Waters-Fuller and K.M.Li, Ground effect over hard rough surfaces, J.Acoust. Soc. Am., 104(3):1474–1482 (1998). 41 K.Attenborough, T.F.Waters-Fuller, K.M.Li and J.A.Lines, Acoustical properties of farmland, J. Agr. Eng. Res., 76:183–195 (2000). 42 D.Aylor, Noise reduction by vegetation and ground, J. Acoust. Soc. Am., 51(1): 197–205 (1972). 43 T.Waters-Fuller, K.Attenborough, K.M.Li and J.Lines, In situ acoustical investigations of agricultural land, Proc. I.O.A., 17(4):451–456 (1995). 44 J.M.Sabatier, H.E.Bass, L.M.Bolen and K.Attenborough, Acoustically induced seismic waves, J. Acoust. Soc. Am., 80:646–649 (1986). 45 S.Tooms, S.Taherzadeh and K.Attenborough, Sound propagation in a refracting fluid above a layered porous and elastic medium, J. Acoust. Soc. Am., 93(1):173–181 (1993). 46 N.D.Harrop, The Exploitation of Acoustic-to-seismic Coupling for the Determination of Soil Properties, PhD Thesis, The Open University (2000). 47 K.Attenborough, On the acoustic slow wave in air filled granular media, J. Acoust. Soc. Am., 81:93–102 (1987). 48 R.D.Stoll, Theoretical aspects of sound transmission in sediments, J. Acoust. Soc. Am., 68(5):1341–1350 (1980). 49 C.Madshus, F.Lovholt, A.Kaynia, L.R.Hole, K.Attenborough and S.Taherzadeh, Air-ground interaction in long range propagation of low frequency sound and vibration—field tests and
Measurements of the acoustical properties
147
model verification, Appl. Acoust., 66(5):553–578 (2005). Reprinted with permission from Elsevier. 50 P.Schomer and K.Attenborough, Basic results of tests at Fort Drum, Noise Control Eng. J., 53:94–109 (2005). 51 M.J.M.Martens, L.A.M.van der Heijden, H.H.J.Walthaus and W.J.J.M.van Rens, Classification of soils based on acoustic impedance, air flow resistivity and other physical soil parameters, J. Acoust. Soc. Am., 78:970–980 (1985). 52 O.Umnova, K.Attenborough, H.-C.Shin and A.Cummings, Response of multiple rigid porous layers to high levels of continuous acoustic excitation, J. Acoust. Soc. Am., 116(2):703–712 (2004). 53 K.Attenborough, P.Boulanger, Q.Qin and R.Jones, Predicted influence of ballast and porous concrete on rail noise, Proc. Inter Noise 2005, Rio de Janeiro, Paper 1583. 54 D.L.Johnson, J.Koplik and R.Dashen, Theory of dynamic permeability and tortuosity in fluidsaturated porous materials, J. Fluid Mech., 176:379–402 (1987). 55 P.Leclaire, L.Kelders, W.Lauriks, C.Glorieux and J.Thoen, Determination of the viscous characteristic length in air-filled porous materials by ultrasonic attenuation measurements, J. Acoust. Soc. Am., 99(4):1944–1948 (1996). 56 T.Ishida, Acoustic properties of snow, Contrib. Intensity Low Temp. Sci. Series A, 20: 23–63 (1965). 57 W.H.T.Huisman, Sound Propagation over Vegetation-covered Ground, PhD Thesis, University of Nijmegen, The Netherlands (1990).
Chapter 5 Predicting effects of source characteristics on outdoor sound 5.1 Introduction The sound field due to a monopole source in a homogeneous medium above an absorbing ground is cylindrically symmetric so that there is no azimuthal variation. But many outdoor noise sources are directional and do not behave as simple monopole sources. Source descriptions in terms of multipoles may be more useful. Although multipole sources radiate a much weaker sound field than the corresponding monopole source, there are many situations when the multi-pole source strength is very large and there is no significant contribution from monopole radiation. For instance, sound radiation by a vibrating sphere or an unenclosed loudspeaker can be represented by a dipole. Lighthill’s aeroacoustic analogy establishes that the sources of a quadrupole nature may be used to model jet noise.
5.2 The sound field due to a dipole source In Chapter 2, we have derived a general expression for the sound field above a ground surface due to a point monopole source. We have seen that the interaction of the sound waves with the ground can be modelled using the concept of the effective impedance. For an extended-reaction ground the plane wave reflection, Rp depends on the angle of incident waves. As the ability for the sound waves to penetrate the ground diminishes, the ground becomes locally reacting so that the plane wave reflection coefficient is essentially independent of the angle of incidence. This is an useful interpretation of the ground impedance as it greatly simplifies our analysis for sources other than a monopole. Apart from the monopole, the simplest source of practical importance is a dipole. It can be imagined as two closely spaced point monopole sources with the same amplitude but opposite in sign, that is to say, they are 180° out of phase. The sound field can be calculated by summing the individual contribution due to these two monopoles and taking the limit of a vanishingly small separation. Typical examples are the sound generated by an oscillating sphere, by an enclosed loud speaker and the component of train noise resulting from wheel/rail interaction. These noise sources can be modelled successfully by using a dipole. In view of this, we continue this section with the study of the sound field due to a dipole source above a ground surface. The ground is assumed to have normalized effective admittance, β, throughout. Previously, sound radiation from a dipole has been studied only in an unbounded medium [1, 2].
Predicting effects of source characteristics on outdoor sound
149
5.2.1 A horizontal dipole Let us assume that two out-of-phase monopoles are placed at the same height, zs above the ground and at a horizontal distance of 2∆ apart. The line joining the two monopole sources (or the so-called dipole axis) can be aligned so that it is parallel to the x-axis. If it is not so aligned, we can always achieve this by rotating the x−y plane about the z-axis appropriately. Without loss of generality, we take the centre of the dipole at the position (0, 0, zs) and the source strength of each monopole to be S0. Since the monopoles are 180° out of phase, we can refer to them as positive and negative monopoles. We adopt the convention that the dipole axis is drawn from the negative monopole to the positive as shown in Figure 5.1. The sound field due to such a system of sources can be found by solving the Helmholtz inhomogeneous equation.
(5.1a) subject to the usual boundary condition at the ground, z=0 of
(5.1b)
Figure 5.1 The source/receiver geometry for a dipole source above an impedance ground: (a) 2D view and (b) 3D view. In the limit of small ∆, the right side of (5.1a) can be simplified by taking the difference of the Taylor expansions of the two terms in the square bracket to give
(5.2)
Predicting outdoor sound
150
where S1=2S0∆ may be regarded as the source strength of the dipole. We look for the Green’s function, Gh(x) for the sound field due to a horizontal dipole locating at xs≡(0, 0, zs) and receivers at x≡(x, y, z) with the source strength S1=1. Using the method of Fourier transformation (see (2.5)), the Helmholtz equation can be reduced to
(5.3a) and the boundary condition at z=0 becomes
(5.3b) The problem as stated in (5.3) can be solved in the same manner as shown in Chapter 2. The solution is
(5.4) Hence the sound field can be cast in an integral form of
(5.5)
where A direct evaluation of the first integral of (5.5) is a challenging, if not impossible, task. A more subtle method for its solution is to reformulate the problem as stated in (5.2): it is equivalent to finding the direct wave field, pd in the absence of any boundary. Replacing the acoustic pressure by pd=∂φ/∂x and reversing the order of differentiation, we obtain
Predicting effects of source characteristics on outdoor sound
151
(5.6) Obviously, φ is the solution for a monopole source located at (0, 0, zs). The solution is Hence the direct wave well known and it can be evaluated exactly as term is simply,
(5.7a)
Sometimes, it will be more convenient to express the solution in the form of spherical centring on the source position. Then the solution becomes polar coordinates
(5.7b) The typical characteristics of the solution for a dipole sound field are evident in the above equation. Essentially, the solution comprises of two components: a near field dominated by the term and a far field term given by ik/R1. Similarly, the second integral of (5.5) can be identified as the sound field due to the image source situating at (0,0, −zs). By analogy, the solution is
(5.8a)
Expressing the solution in the form of spherical polar coordinates (R2, θ, ψ) centred on the image source, we obtain
(5.8b) In (5.5), we are left with the evaluation of the third integral
(5.9)
Predicting outdoor sound
152
in order to specify fully the analytical solution for the Green’s function of the horizontal dipole. Again, we find it fruitful to transform the integral expression from (kx, ky) to (κ, ε) in the same way as we do for the monopole source in Chapter 2. Then (5.9) can be transformed to
(5.10) and Using the general form of the integral expression for the Bessel function of n-th order [1, Eq. (9.1.21)],
(5.11a) together with the identity of
(5.11b) we see that I can be written in terms of the Bessel function of the first order as
(5.12) With the use of the following identities,
and the substitution of κ=k sin µ in (5.12), we arrive at a somewhat more familiar form as follows:
(5.13)
Predicting effects of source characteristics on outdoor sound
153
Comparing with (2.28), we find that (5.13) has an extra sin µ term and the Hankel function of the first order is used instead of zero-th order owing to the fact that the horizontal dipole is considered here. At first sight, the seemingly different Hankel functions used for monopole and horizontal dipole appears to pose a problem for the asymptotic evaluation of (5.13). Nevertheless, we find that it is possible to generalize the method from that of the monopole to a source of ‘higher-order’ pole by using the following integral expression for Hankel functions and their asymptotic forms:
(5.14a) and
(5.14b) The integral can be evaluated asymptotically in the same way as that for monopole and the details are described elsewhere [2]. The solution can be expressed as
(5.15a) where
(5.15b) With the use of (5.14b) with n=1 and the usual approximations, can simplify I to
and θ→π/2, we
(5.16)
Summing all contributions, (5.7) and (5.16), the required Green’s function for a horizontal dipole is
Predicting outdoor sound
154
(5.17)
To express the required Green’s function in the form of Weyl-Van der Pol formula (see (2.38)), we can rewrite (5.16) as
(5.18) where and θ→π/2 are assumed. These assumptions are generally valid for most practical outdoor sound predictions. Hence the Green’s function can be cast in the classical Weyl-Van der Pol form as:
(5.19)
where Q is the spherical reflection coefficient given in (2.40c). We note the interesting point that the Green’s function can be derived also, by stating
(5.20) Substituting (2.40a) into (5.20), differentiating each term with respect to x and assuming that ∂(Q sin θ)/∂x is negligibly small, we can arrive at the same expression as given in (5.19). Nevertheless, we show the fuller derivation here because it is instructive to extend the asymptotic analysis from that of the monopole source to the dipole case through this relatively simple ‘control’ case. As our knowledge grows, we can handle cases for higher-order sources with confidence. We also wish to point out that the corresponding Green’s function can be readily extended to an arbitrarily oriented horizontal dipole. Noting that the azimuthal angle is the angle measured from the dipole axis that is aligned along the x-axis, by a simple rotation of axis we can see that the sound field can be written as
(5.21)
Predicting effects of source characteristics on outdoor sound
155
where ψ1 is azimuthal angle of the axis of the arbitrary orientated dipole. A more rigorous analysis for the validity of this expression will be left to section 5.2.3 when we study the sound field due to an arbitrarily oriented dipole. Before we proceed to study the sound field due to a vertical dipole, we show the predicted sound fields due to a horizontal dipole which is aligned along the x-axis, that is ψ1=0. Figure 5.2(a) compares the excess attenuation, defined as the total sound field relative to the direct field for monopole and horizontal dipole. The source and receiver heights are 1.0 and 0.5 m respectively, and the separation is 5.0 m. The two-parameter impedance model (3.32), is used throughout this chapter. Substituting values for the constant parameters of air, we arrive at the following equation:
which is essentially the same as (3.38). For dipole sources, assumed default parameter values for σe and αe are 38 kPa s m−2 and 15 m−1. Unless stated otherwise, the default parameters are used in all calculations for the dipole. With the assumed geometry, there is little difference between the predicted excess attenuation spectra for monopole and horizontal dipole sources because the angles for the direct and the reflected wave components, and θ respectively, are very close. Hence, the excess attenuation spectra are virtually indistinguishable, except at the interference minima, for monopole and dipole sources. Figure 5.2(b) shows the same comparison but at only 1 m range. For this geometry, the angle between and θ is large and so the difference between the excess attenuation spectra predicted for monopole and horizontal dipole sources is significant. Also shown in Figure 5.2(a)(b) are the prediction of sound fields due to a vertical dipole. Their interpretations will be discussed in the next section.
Predicting outdoor sound
156
Figure 5.2 The comparison of excess attenuation spectra due to a monopole (solid line), horizontal dipole (dotted line) and a vertical dipole (dashed line). The source/receiver geometry is zs=1.0 m and z=5.0 m: (a) range=5.0 m (b) range=1.0 m. 5.2.2 The sound field due to a vertical dipole Suppose that the dipole is aligned so that its axis is aligned along the vertical z-axis as shown in Figure 5.3. The governing inhomogeneous Helmholtz equation is
(5.22) where a unit dipole source strength is assumed. The required Green’s function after the Fourier transformation is
(5.23) subject to the same boundary condition (5.3b).
Predicting effects of source characteristics on outdoor sound
We introduce a potential function such that potential function is modified to dφ/dz+ikβφ=0 at z=0.
157
The boundary condition for the
Figure 5.3 A vertical dipole above an impedance ground. Equation (5.23) can then be simplified to
(5.24) Since the original Helmholtz equation (5.22) contains a source term proportional to ∂δ(z−zs)/∂z, we expect continuity of pressure gradient but a pressure ‘jump’ at the plane z=zs. This condition can be stated in terms of the potential function φ (see also (2.12)) as
(5.25) Hence the solution for (5.24), which satisfies the boundary conditions (5.25), is
(5.26) where the sign function
Predicting outdoor sound
158
(5.27) and substituting it into the inverse Fourier Replacing the potential function with integral, we can express the sound field for the vertical dipole as
(5.28)
We can identify immediately that the first integral corresponds to the direct field, pd while the second is the sound field due to the image source, pr. Again, the solution for a free field dipole can be used for a vertical dipole as we did for a horizontal dipole in the last section. The only requirement is to determine the angle between the dipole axis and the line radiating from the source to receiver, which is for the case of the direct wave. Hence, it is not difficult to see that
(5.29a)
Similarly, the angle between the dipole axis and the line radiating from the image source to receiver is θ. The corresponding sound field can be represented by
(5.29b)
Note, in the direct wave, that the sign function has been incorporated in the cosine term by a precise definition of the direction of polar axes (dipole axis and the spherical polar coordinate axis. We choose that all the polar angles are measured from the direction of the negative z-axis (see Figure 5.3). When the source is located above the receiver, the is positive. On the polar angle for the direct wave is less than π/2 which implies which implies other hand, when the source is placed below the receiver, then a negative value for the cosine term. An immediate consequence is that the principle of reciprocity does not hold for a vertical dipole. Exchanging the source and receiver
Predicting effects of source characteristics on outdoor sound
159
position will not lead to the same sound field. We confirm this later where we derive the full expression for the sound field due to the vertical dipole. In (5.28), we are left with the third term for further investigation. Just like the horizontal dipole, this term can be simplified to
(5.30) The integral with respect to ε can be evaluated by using the identity (5.11 a) to yield
which can be further reduced to
(5.31a) We resolve the integrand by partial fractions leading to
(5.31b)
A close examination of the above integrals reveals that the first term is akin to the direct wave term of a monople and the second term is analogous to the boundary wave term (see (2.28)). Hence, no extra effort is required to obtain the solutions for these two integrals and the boundary wave term for the vertical dipole is simply
(5.32) Summing (5.29) and (5.32), we get the total sound field due to a vertical dipole (or the Green’s function) as
Predicting outdoor sound
160
(5.33)
it is possible to write the Green’s function in the With the extra requirement that classical form of the Weyl-Van der Pol formula as
(5.34)
where cos µp (with µp as a complex angle) is determined according to
cos µp=−β. (5.35) The term cos µp is used to facilitate the interpretation of the theoretical formula as it is linked to the propagation of ground wave. We can imagine it as the direction that characterizes such propagation. It is tempting, as for the horizontal dipole, to replace µp with θ. However, numerical experiments suggest that it will not lead to a satisfactory approximation. Figure 5.4(a)(b) show predictions (solid line) of the sound field due to a vertical dipole as a function of horizontal range at 1000 and 100 Hz. The source and receiver heights are located at 2.0 and 1.0 m above the ground surface. The dotted line represents the predicted sound levels due to a monopole source at the same source/receiver geometry and frequencies as the case of vertical dipole. The source strength for the dipole is normalized to give the same sound level as the vertical dipole at 0 m range. In general, the interference pattern of the dipole is essentially the same as that of the monopole source but the level is somewhat lower. Predictions of the excess attenuation spectra due to a vertical dipole are shown also plotted in Figure 5.2(a)(b) in the last section. Compared with the corresponding spectra for a monopole or a horizontal dipole, they exhibit greater interference effects. Figure 5.5
Predicting effects of source characteristics on outdoor sound
Figure 5.4 The predicted sound pressure level (SPL) from a vertical dipole (solid line) above an impedance ground. The predicted sound level due to a monopole (dotted line) is shown also. The source and receiver heights are 2.0 m and 1.0 m respectively: (a) frequency, f=1000 Hz and (b) frequency, f=100 Hz.
Figure 5.5 Predicted excess attenuation of sound due to a monopole (solid line) and vertical dipole (dashed line) above an
161
Predicting outdoor sound
162
impedance ground. The dotted line is the ground wave component of the sound field due to the vertical dipole. The horizontal dipole for this case is indistinguishable from that for a monopole. The geometrical configuration used in the plot is as follows: the source and receiver heights are 0.1 m and 0.025 m respectively and range is 2.0 m. shows predictions of excess attenuation spectra with vertical dipole (solid line), monopole (dotted line) sources and receiver close to an impedance ground surface with heights of 0.1 m and 0.25 m respectively. Propagation of near-grazing sound, the ground wave contribution due to the vertical dipole is predicted to be particularly significant. In Figure 5.5, the predicted ground wave contribution due to a vertical dipole is shown by the dotted line. It is of interest to point out that the predicted sound fields are different by changing the position of source and receiver. This is illustrated in Figure 5.6 by excess attenuation predictions at a range of 1 m but with the source at 0.025 m and the receiver at 0.1 m over the default impedance ground surface. The discrepancy can be explained by the fact that the polar angles joining the source directly with the receiver are different by π as shown in Figure 5.7(a)(b). The magnitude of the direct wave is the same for both cases but they are different by a factor of −1. Therefore, the sound fields for both situations are not identical. Consequently, a straightforward application of the reciprocity theorem is not applicable in the case for a vertical dipole source above the ground surface.
Figure 5.6 Predicted excess attenuation of sound due to a monopole (solid line) and vertical dipole (dotted line) above an impedance ground with source and receiver heights of 0.25 m and 0.1 m respectively and
Predicting effects of source characteristics on outdoor sound
163
range of 1.0 m. The dashed line represents the prediction for a vertical dipole with source and receiver heights of 0.1 m and 0.25 m respectively and the same range.
Figure 5.7 The differences in the polar angles when the position of source and receiver are interchanged. 5.2.3 The Green’s function for an arbitrarily orientated dipole Having gone through the analyses for the sound field due to a horizontal and vertical dipole, it is natural to expect that the Green’s function for an arbitrarily orientated dipole is a combination of these two fundamental building blocks. To fix ideas, let’s think about the representation of an arbitrarily orientated dipole—the separation of the two equal and opposite monopoles being 2∆. The process is much easier if one introduces the direction cosines l≡(lx, ly, lz) of the dipole axis. Sometimes, these direction cosines are referred as the dipole-moment amplitude [1, 2, pp. 165]. As in our previous analysis, the spherical polar coordinates are frequently used. So it is convenient to define the dipole axis as
(5.36)
where γ1 is the polar angle measured from the negative z-axis and ψ1 is the azimuthal angle measured from the positive x-axis, see Figure 5.8. Take, for example, that the direction cosines for a horizontal dipole aligned in the x-direction is (1, 0, 0). Hence, the
Predicting outdoor sound
164
polar and azimuthal angles γ1 and ψ1 are π/2 and 0 respectively. On the other hand, the direction cosines for a vertical dipole aligned in the z-direction and its corresponding polar and azimuthal angles are (0, 0, 1), 0 and π/2 respectively. The source on the right side of (5.1a), Γ1(rs) is simply Γ1(rs)=−S0[δ(r−[rs+1∆])−δ(r−[rs−1∆])] (5.37a)
Figure 5.8 An arbitrarily oriented dipole above an impedance ground. where rs and r are the source and receiver position. Expanding the terms in Taylor’s series and grouping the resulting terms, we modify the source term to Γ1(rs)=S1[δ′(x)δ(y)δ(z−zs)+δ(x)δ′(y)δ(z−zs)+δ(x)δ(y)δ′(z−zs)], (5.37b) where the primes denote the derivatives of the delta functions with their respective arguments. We can now apply the method of Fourier transformation to (5.1a) with (5.37b) as the source term. Then the Green’s function, Gd(x, y, z) for a dipole of unit strength can be reduced to
(5.38) subject to the same impedance boundary condition, dp/dz+ikβφ=0 as before.
Predicting effects of source characteristics on outdoor sound
165
Following the same procedure as detailed in section 5.2.2 and 5.2.3, we obtain a solution for as
(5.39a) where Λ−=kxlx+kyly+sgn(z−zs)kzlz (5.39b)
Λ+=kxlx+kyly+kzlz (5.39c) and
(5.39d) Since each of the terms, Λ− and Λ+, can be decomposed into a horizontal and a vertical component, the horizontal component contains a further of two terms, kxlx and kyly. There is only a single term, kzlz for the vertical component. It is obvious that the Green’s function can be considered as a sum of two components that can be written as
Gd(x, y, z)=Gh(x, y, z)+Gv(x, y, z), (5.40a) where,
(5.40b)
and
Predicting outdoor sound
166
(5.40c)
The inverse Fourier transforms for horizontal and vertical dipoles can also be written in the polar form as
(5.41a)
(5.41b) where the reflection coefficient V is transformed to
(5.41c) The results in the preceding sections can be applied for the evaluation of (5.41a) and (5.41b) with some minor modifications. The solutions are
(5.42a)
and
(5.42b)
Predicting effects of source characteristics on outdoor sound
167
For an arbitrary orientated dipole, the total sound field can be calculated by substituting (5.42) into (5.40a). To write the expression in a more compact form, we can introduce the following unit vectors:
(5.43a)
(5.43b)
(5.43c) where and are the unit vectors pointing radially outward from the dipole centre towards the observation point for the direct and reflected wave respectively. In addition, we may regard as the unit vector that characterizes the direction of propagation of the ground wave as it involves the complex angle µp. Noting that l is the direction cosine of the dipole axis, we can show that
(5.44a)
(5.44b) and
(5.44c) For near-grazing propagation where we can substitute (5.42–5.44) into (5.40a) to obtain a close form analytical solution for the sound field due to an arbitrarily orientated dipole as follows:
Predicting outdoor sound
168
(5.45)
Finally, it is of interest to point out that although the sound field generated by a dipole can be obtained, in principle, by differentiating the monopole sound field with respect to the appropriate spatial coordinates [see for example, the asymptotic expression given in 3], in practice however, the asymptotic expression for the monopole sound field is not sufficiently precise to yield satisfactory results, especially when calculating the verticaldipole component of the sound field.
5.3 The sound field due to an arbitrarily orientated quadrupole In the last section, the asymptotic solution of the sound field due to a dipole has been derived. It is natural to ask whether a similar asymptotic solution can be developed for an arbitrarily orientated quadrupole because it can be imagined as two closely spaced dipoles with equal but opposite dipole-moment amplitude vectors. Also, we are interested to see whether the classical form of the Weyl-Van der Pol formula can be extended to the corresponding sound field due to the quadrupole. Study of the field due to a quadrupole source above a ground surface is relevant to modelling jet engine testing noise outdoors. In this section, we shall derive the corresponding asymptotic formula for the sound field due to the quadrupole. As the ‘construction’ of a quadrupole is realizable by putting two closely spaced dipoles of equal but opposite dipole-moment amplitude vectors, the source term for the inhomogeneous Helmholtz equation is simply Γ2(rs)=Γ1(rs+m∆)−Γ1(rs−m∆) (5.46) where Γ1(rs) is the source term for a dipole (see (5.37)), and m≡(mx, my, mz) are the direction cosines that characterize the orientation of the quadrupole axis. Also, it is convenient to introduce the corresponding spherical polar coordinates with the polar angle of γm and azimuthal angle ψm. Using the definition for the dipole source (5.37b) in (5.46), expanding the corresponding terms by Taylor Series and simplifying the resulting expression, we can show that the quadrupole source term can be written in a rather compact form as
(5.47a)
Predicting effects of source characteristics on outdoor sound
169
where and S2=2S1∆ is the quadrupole source strength. The term can be expanded further to yield Γ2(rs)=S2{lxmxδ″(x−xs)δ(y−ys)δ(z−zs) +lzmzδ(x−xs)δ(y−ys)δ″(z−zs) +lymyδ(x−xs)δ″(y−ys)δ(z−zs) +(lxmy+lymx)δ′(x−xs)δ′(y−ys)δ(z−zs) +(lymz+lzmy)δ(x−xs)δ′(y−ys)δ′(z−zs) +(lzmx+lxmz)δ′(x−xs)δ′(y−ys)δ′(z−zs)}.
(5.47b)
The method for deriving the required asymptotic solution for arbitrary orientated quadrupole is similar to that for the dipole, which has been described in section 5.2. The derivation involves some tedious algebraic manipulations, but the approach is straightforward. In this section, we outline the method and obtain the solution. Using the method of Fourier transformation, as before, with the source term specified by (5.47), the approximate solution for an arbitrarily orientated quadrupole of unit strength is [4]
(5.48)
It is evident from (5.48) that the amplitude of the sound field due to a quadrupole source is a function of frequency. This characteristic is quite different from that of a monopole source in which the monopole source is proportional to 1/R. This implies that the extra path length of the image wave (i.e. R1−R2) becomes significant at high frequencies and the excess attenuation spectrum tends to large values. This feature, which is more prominent at smaller incident angles, is therefore not related to the effective impedance of the ground surface, but rather to the fact that the amplitude of the quadrupole field is dependent on the frequency. Two types of quadrupole, longitudinal and lateral, are classified normally although it is possible to introduce the horizontal and vertical components just like we do for the dipole. A longitudinal quadrupole has the characteristic such that the direction cosines, l and m, are parallel while they are perpendicular for a lateral quadrupole (see Figure 5.9). In the following plots, we show the numerical results of our asymptotic solution (5.48) for these two types of quadrupole. In particular, we consider the case of a longitudinal quadrupole such that it is aligned perpendicular to the ground surface, γm=γ1=0. We shall describe it as the vertical longitudinal quadrupole. A lateral quadrupole, with γm=π/2 and
Predicting outdoor sound
170
Figure 5.9 Two basic types of quadrupole: a longitudinal quadrupole and a lateral quadrupole. The direction of arrows indicate the orientation of the dipole axis (l) and the quadrupole axis (m). γ1=0, is considered also. Ground parameters with σe and αe of 100 kPa s m−2 and 50 m−1 are used for the predictions in this section. Figures 5.10 and 5.11 show the predicted excess attenuation spectra for a vertical longitudinal quadrupole and a lateral quadrupole. The corresponding spectra due to a vertical dipole and monopole are also shown in the figures for comparison. The horizontal quadrupole [γm=γ1=π/2], which has a similar characteristic as the monopole and horizontal dipole source, will not be discussed here. In Figure 5.10, the source and receiver heights are assumed to be 2.5 and 1.2 m respectively and the separation is 50 m. As shown in section 5.2.2, the predicted excess attenuation for a vertical dipole shows greater interference effects as compared with that due to a monopole (the dotted and dashed lines in 5.10(a)). Furthermore, the frequencies of the subsequent interference dips are about the same for the monopole, vertical dipole and longitudinal quadrupole, but the interferences are much less significant for the longitudinal quadrupole. The
Predicting effects of source characteristics on outdoor sound
Figure 5.10 The excess attenuation spectra for a quadrupole (solid line), a vertical dipole (dotted line) and a monopole (dashed line). The source and receiver heights are 2.5 m and 1.2 m respectively and the horizontal range is 50 m. (a) A vertical longitudinal quadrupole, and (b) A lateral quadrupole with γm=π/2, γ1=0, and ψm=π/2, ψ1=0. The lateral quadrupole and the vertical dipole spectra are almost coincident within the thickness of the line.
171
Predicting outdoor sound
172
Figure 5.11 The excess attenuation spectra for a quadrupole (solid line) a vertical dipole (dotted line) and a monopole (dashed line). The source and receiver heights are 2.5 m and 1.2 m respectively and the range is 320 m. (a) A vertical longitudinal quadrupole, and (b) A lateral quadrupole with γm=π/2, γ1=0, and ψm= π/2, ψ1=0.The lateral quadrupole and the vertical dipole spectra are almost coincident within the thickness of the line. predicted spectra for a lateral quadrupole, a vertical dipole and a monopole are shown in 5.10(b). At this source/receiver geometry, there is little difference in the predicted spectra between a lateral quadrupole and a vertical dipole. Figure 5.11 (a) shows prediction of attenuation spectra with a vertical longitudinal quadrupole (solid line), a vertical dipole (dotted line) and a monopole (dashed line) source with the same source and receiver heights, but the range is 320 m. It can be seen, in this near-grazing propagation, that the predicted excess attenuation due to the longitudinal quadrupole is lower than that due to a vertical dipole, but it is still higher than that due to a monopole. In Figure 5.11(b), we show the predicted attenuation, for the same source/receiver geometry, for a lateral quadrupole (solid line), a vertical dipole (dotted line) and a monopole (dashed line). There is not much difference in the predicted excess attenuation between a lateral quadrupole and a vertical dipole, and these predictions are different from that due to a
Predicting effects of source characteristics on outdoor sound
173
monopole. It should be noted that typographical errors in reference [6] have been corrected in Figures 5.10(b) and 5.11(b). Finally, we remark that the resulting formula may be used to study the propagation of jet noise above a ground surface. In an idealized case, jet noise source is represented by either a randomly orientated longitudinal or a randomly orientated lateral quadrupole. Taherzadeh and Li [7] have applied the above formulation to investigate the directivity pattern of a simple quadrupole and have suggested that there is a significant influence of the impedance of ground surface on the directivity of jet noise. This is a consequence of near cancellation of the intensity field at the near-grazing angles for both longitudinal and lateral quadrupoles. Furthermore, the directivity pattern is explicitly dependent on the frequency and the source height rather than the product of kzs as suggested by Smith and Carpenter [8] when they consider turbulent jet noise above a hard ground. Such a modification is due to the frequency dependence of the reflected wave term.
5.4 Source directivity and railway noise prediction Accurate prediction of noise from railways has become increasingly important as a result of increased rail traffic and the emphasis on high-speed rail links. There are several forms of noise generation on modern trains: traction noise, rail/wheel interaction noise, auxiliary equipment noise and aerodynamic noise. In many studies of noise from trains travelling at speeds below 200–300 km h−1, it is often assumed that traction and aerodynamic noise are unimportant and that the predominant noise mechanism is the rail/wheel interaction. In this respect, it has been suggested that railway noise at these speeds can be modelled by a set of sources which are located at some positions between 0 m and 1 m above either the centreline of the nearest track or the nearside rail. It has been known for many years that wheel/rail noise emitted by a train is directional and the approximate representation by a line of incoherent dipole sources provides good agreement with the measured data. In particular, most electrically hauled trains radiate sound with dipole source characteristics. As a result, the Austrian ÖAL model [9] uses a combination of dipole and monopole sources with the ratio of 15% monopole and 85% dipole type radiation. An alternative numerical model based on the boundary integral equation method has been considered by Morgan [10]. According to this model, the boundary integral form (8.7) is modified so that the standard 2-D Green’s function for sound propagation from a monopole above an impedance ground, G(r, rs), is replaced by
(5.49) where ux, uy are the components of u=(ux, uy), the unit vector along the axis of the dipole, and the derivatives ∂G(r, rs)/∂xs and ∂G(r, rs)/∂ys can be calculated using a very efficient technique [11]. Usually, in railway noise calculations, the dipoles are assumed to be orientated horizontally, that is u=(1, 0). Morgan used the boundary integral equation method to predict railway noise propagation in the presence of noise barriers and rigid train bodies [10]. The cross-section
Predicting outdoor sound
174
of the track considered in this study is reproduced in Figure 5.12. Two railway tracks here are modelled separately with a pair of dipole sources at the railheads above a porous layer of ballast. The assumed spectral strength of these sources is that suggested by Hemsworth [12] for a passenger coach. The ground is flat and consists of grassland on the receiver side including the vicinity of a 2.0 m noise barrier (NB). The left side of the noise barrier is absorbing. The acoustic surface admittance of the porous ballast, grassland and absorbing barrier treatment can be modelled, for example, using the four-parameter Attenborough model [13] for which Morgan suggested the values of the non-acoustic parameters listed in Table 5.1. The receiver positions are located at distances of 20, 40 and 80 m on the right-hand side from the noise barrier and at 1.5 m above the ground. The insertion losses are calculated in 1/9-octave bands in the frequency range between 63 and 3150 Hz
Figure 5.12 Assumed railway cross-section (adapted from [10]). Table 5.1 A summary of the non-acoustical parameters used in a four-parameter model for porous grassland, ballast and absorbing barrier treatment (adapted from [10]) Surface type Grassland Ballast Absorbing barrier treatment
Flow resistivity, R (kPa s m−2) 125.00 9.57 6.30
Porosity Tortuosity Layer depth Pore shape (Ω) (q) d (m) factor (sp) 0.5 0.4 0.9
1.67 1.54 1.50
∞ 0.5 0.13
0.5 0.4 0.5
Predicting effects of source characteristics on outdoor sound
175
Table 5.2 Comparison of the broad band A-weighted insertion loss (dB) for two types of sources of railway noise (adapted from [10]) Barrier height (m) Source type Nearside track (m) Farside track (m) 20 40 80 20 40 80 1.5 2.0
Monopole Dipole Monopole Dipole
12.7 13.3 15.6 16.2
9.5 10.0 11.7 12.5
6.2 6.9 8.0 8.7
6.9 7.1 9.6 10.0
3.4 3.6 6.3 6.4
0.7 0.8 2.6 2.6
using the boundary integral equation method for both monopole (equation (8.7) with Green’s function (8.10)) and dipole sources (equation (8.7) with Green’s function (5.49)). The following formula is then used to combine the 1/9-octave band results
(5.50) so that the broadband insertion losses, LB, presented in Table 5.2 [10] can be obtained. Here L0(fn) are the N 1/9-octave railway noise spectra predicted in the absence of the barrier and LB(fn)=L0(fn)−ILP(fn), where ILP(fn) is the predicted 1/9-octave barrier insertion loss. The results demonstrate that, for the assumed railway noise spectrum, the difference between the predictions based on the monopole and dipole models is marginal and vanishes at the receiver positions more distant from the noise barrier. This prediction that the difference is small may be largely attributed to the effect of acoustic scattering from the ballast, train body and from the noise barrier. A small discrepancy between these results can be observed also with an increased barrier height and this is explained by the actual difference in the emission characteristics.
References 1 A.D.Pierce, Principles and Applications, second printing, Acoust. Soc. Am., New York (1991). 2 A.P.Dowling and J.E.Ffowcs Williams, Sound and Sources of Sound, Ellis Horwood Ltd., Chichester (1983). 3 M.Abramowitz and I.A.Stegun, Handbook of Mathematical Functions with Formulas, Graphs, and Mathematical Tables, Dover Publications, Inc., New York (1972). For other identities of Bessel functions, see also G.N.Watson, A Treatise on the Theory of Bessel Functions, Cambridge UP, Cambridge (1944). 4 K.M.Li, S.Taherzadeh and K.Attenborough, Sound propagation from a dipole source near an impedance plane, J. Acoust. Soc. Am., 101:3343–3352 (1997). 5 A.V.Generalov, Sound field of a multipole source of order N near a locally reacting surface, Sov. Phys. Acoust., 33:492–496 (1987). 6 K.M.Li and S.Taherzadeh, The sound field of an arbitrarily-oriented quadrupole above a ground surface, J. Acoust. Soc. Am., 101:2050–2057 (1997).
Predicting outdoor sound
176
7 S.Taherzadeh and K.M.Li, On the turbulent jet noise near an impedance surface, J. Sound Vib., 208:491–496 (1997). 8 C.Smith and P.W.Carpenter, The effect of solid surfaces on turbulent jet noise, J. Sound Vib., 185:397–413 (1995). 9 ÖAL—Richtlinie, Nr. 30, 1990. Calculation of Noise Emission from Rail Traffic (in German). 10 P.A.Morgan, Boundary element modelling and full scale measurement of the acoustic performance of outdoor noise barriers, PhD Thesis, University of Bradford, November (1999). 11 S.N.Chandler-Wilde and D.C.Hothersall, Efficient calculation of the Green’s function for the acoustic propagation above a homogeneous impedance plane, J. Sound Vib., 180 (5):705–724 (1995). 12 B.Hemsworth, Prediction of train noise, in P.M.Nelson (Ed.), Transportation Noise Reference Book, Butterworth, London (1987). 13 K.Attenborough, Acoustical impedance models for outdoor ground surfaces, J. Sound Vib., 99(4):521–544 (1985).
Chapter 6 Predictions, approximations and empirical results for ground effect excluding meteorological effects 6.1 Approximations for frequency and range dependency Several analytical approximations for ground effect have been derived. Rasmussen [1] has obtained an approximation for frequency-dependent ground effect in the form of the direct and plane wave reflected fields plus a correction. This approximation is based on the Delany and Bazley single parameter model for ground impedance (3.2). His result for the sound level relative to free field may be expressed as follows: EA=10 log{l+(|R(θ)|r1/r2)2+2(|R(θ)|r1/r2) cos[k(r1−r2)+a]+A2 +2 exp(−5cos(θ))A cos ξ[1+(|R(θ)|r1/r2) cos[k(r1−r2)+α]]
(6.1)
where the complex plane wave reflection coefficient, R(θ)=RR+iRI, is calculated from
Z=R+iX is the normalized surface impedance, α=−tan−1(|RI/RR|), A= (1−RR)/[1+k2(36.4r/Rse)]2 and ξ=−4 tan−1[k(36.4r/Rse)]. An example comparison between (6.1) and a calculation based on the Weyl-Van der Pol expression (2.40) is shown in Figure 6.1. Although it avoids computation of complementary error functions of complex argument, the approximation does not reproduce the main ground effect dip particularly well for the chosen parameters and it is restricted to a single-parameter ground impedance model (see Chapter 3 for a discussion of impedance models). Moreover, it is not difficult to compute the full solution for any impedance model or measured impedance (see Chapter 2 (2.34) et seq). Defiance and Gabillet [2, 3] have derived two approximations, also based on the Delany and Bazley impedance model. The two approximations are, respectively,
Predicting outdoor sound
178
Figure 6.1 Comparison between the approximation represented by (6.1) and a calculation using the Weyl-Van der Pol formula for source at 1.65 m, receiver at 1.2 m and separated horizontally by 10 m over a Delany-Bazley impedance given by an effective flow resistivity of 200 kPa s m−2. for shorter ranges over relatively hard surfaces and longer ranges over soft surfaces. This is a consequence of the intended application to predictions in the presence of barriers where the ground on the source side of the barrier (a road surface for example) tends to be acoustically harder than that on the receiver side. Their results may be expressed as EA1=10 log {[1−δ/r−B+cos (kδ)]2+[B−sin(kδ)]2} (6.2) where
(6.3) where
Predictions, approximations and empirical results
179
Figures 6.2 and 6.3 show example comparisons between the predictions of these equations and those of (2.40) (the Weyl-Van der Pol formula), for a relatively short range (20 m). The approximations are reasonable for their intended combinations of range and
Figure 6.2 Comparison between predictions of the Defrance approximation (6.2) (solid and dash-dot lines) for source height 0.3 m, receiver height 2 m and 20 m range over two relatively hard surfaces. Corresponding predictions, using the Weyl-Van der Pol formula (2.40), are shown as broken and dotted lines. The ground impedances are given by the Delany and Bazley model (3.2) with Rse=5000 kPa s m−2 and 1000 kPa s m−2 respectively.
Predicting outdoor sound
180
Figure 6.3 Comparison between predictions of the Defrance approximation (6.3) (solid line) for source height 0.3 m, receiver height 2 m and 200 m range over softer ground (6.3). The corresponding Weyl-Van der Pol type predictions are represented by the dashed line. The ground impedance is computed from the Delany and Bazley formula (3.2) with Rse= 100 kPa s m−2. flow resistivity. Nevertheless, again (6.2) and (6.3) are limited to a single impedance model of limited applicability for outdoor surfaces. Moreover (6.3) fails to be a good approximation at short range for low flow resistivity surfaces. As mentioned earlier, given the relative ease with which the more exact analytical approximation (2.40) can be calculated, there seems little reason for these frequencydependent approximations. There is a better computational case for such approximations if predictions of the variation of A-weighted levels with distance are required.
6.2 Approximations and data for A-weighted levels over continuous ground Makarewicz and Kokowski [4] have deduced a simple semi-empirical form for carrying out calculations of the variation in A-weighted levels from a stationary source for ranges up to 150 m taking into account wavefront spreading and ground effect only. Their result for propagation from a point source may be expressed as
Predictions, approximations and empirical results
181
(6.4) Here E is an adjustable parameter intended to include the effect of the presence of the ground on radiation of sound energy from the source (2≥E≥1), LWA is the A-weighted sound power level of the source and γg is an adjustable ground parameter. The lower the impedance of the ground, the larger is the value of γg. Figure 6.4 shows a comparison of predictions of (6.4) for the decrease in A-weighted level with range from a source with a sound power spectrum similar to that of an Avon jet engine but 30 dB less. The circles represent predictions obtained from (2.40) using the Delany and Bazley single parameter ground impedance model (Rse=200 kPa s m−2). The solid line represents predictions from (6.4) with E=2 (the value for hard ground) and γg=4×10⁻³. The agreement between the predictions is rather good. Strictly (6.4) is intended for use at relatively short ranges (<150 m). Makarewicz and others [5–8] have suggested approximations that can be used for predicting for Aweighted levels for longer ranges. These depend on the assumed impedance model and take meteorological factors into account as well as ground effect and wavefront spreading. They will be discussed in Chapter 12. The values of the parameters to be used in (6.4) to predict the curve shown in Figure 6.4 have been derived from trial-and-error fitting. However, where the sound power level of the source is unknown, Makarewicz suggests the use of in situ sound level measurements (LA1 and LA2) at two locations (r1, h1) and (r2, h2). The ground parameter γg may be deduced subsequently from
(6.5) where value for γg in (6.4).
The value of E may then be obtained by substituting the
Predicting outdoor sound
182
Figure 6.4 Predictions of A-weighted levels up to 110 m from a source with a broad band sound power spectrum similar to that of an Avon jet engine (see Chapter 4) but 30 dB less. The source and receiver heights are 1 m. Circles represent predictions obtained from (2.40) and (3.2) with Rse= 200 kPa s m−2. The solid line represents values obtained from Makarewicz formula (6.4) with E=2 (the value for hard ground) and γg=4×10⁻³. Figure 6.5 [4, 9] shows average data for the A-weighted sound level with distance up to 50 m over three surfaces. Two of the surfaces were of adjacent portions of a field. One part of the field was covered in wheat stubble and the other had been ploughed. The rate of sound attenuation over the ploughed portion is clearly greater than that over the wheat stubble. The third surface was covered with oil seed rape plants shortly after flowering. No quantitative meteorological data is available for the measurements over the wheat stubble field. However, in the oil seed rape field, there was with a slight wind component (between 0.9 and 1.9 m s−1) from source to receivers. The same source (an Electro-Voice loudspeaker) was used to obtain all of these data which have been normalized to the level measured at 1 m. Since this level was uncalibrated, the data show relative rather than absolute values of sound levels. The shape of the A-weighted sound power spectrum deduced from the measured sound level spectrum at 1m, assuming spherical spreading from the source, is shown in Figure 6.6. The open diamonds in Figure 6.5 represent data obtained with the source at 1.65 m height and receivers at 1.2 m height (except at 1 m range where the receiver was at 1.65
Predictions, approximations and empirical results
183
m height) above the oil seed rape crop which was about 1 m high. Also shown (as a dotted line), are predictions obtained from the simple formula for
Figure 6.5 A-weighted levels at receivers 1.2 m high due to a broad-band sound signal generated by a loudspeaker source 1.6 m high over an oil seed rape field shortly after flowering (diamonds) and adjacent portions of a wheat stubble field unploughed (joined crosses) and ploughed (joined circles). Also shown are predictions of the Makarewicz and Kokowski approximation [4] (solid, broken and dash-dot lines respectively) and the ISO 9613–2 scheme [9] for broad-band A-weighted levels excluding air absorption (dotted line).
Predicting outdoor sound
184
Figure 6.6 A-weighted sound spectrum at 1 m from the loudspeaker (arbitrary reference) used to generate the levels shown in Figure 6.5. Table 6.1 Values of the ground parameter γg (6.4) obtained from measurements at ranges up to 50 m over three surfaces (see Figure 6.5) Surface
γg
Oil seed rape field (recently flowered) Undisturbed part of wheat stubble field Ploughed part of wheat stubble field
0.025 0.027 0.231
A-weighted ground attenuation Ag given in the ISO scheme [9], that is, Ag=4.8−(2h/r)[17+(300/r)], Ag≥0. (6.6) The measured data indicate significantly larger ground attenuation up to 50 m than predicted by the ISO broadband formula. The differences in attenuation are much greater than the expected contribution of air absorption at the ranges concerned. Moreover they have been observed under slightly downwind conditions (wind component between source and receiver approximately 2 m s−1). The ISO formula is intended to predict for moderate downwind conditions. The solid lines in Figure 6.5 shows predictions from (6.4) with E=1 (the value for soft ground) and the value of γg listed in Table 6.1. The agreement between the (6.4) predictions and data (open diamonds) obtained over the oil seed rape field is good. The procedure based on (6.5) and the measured levels at 10 and 50 m have been used to fit the data shown in Figure 6.5 (open circles and crosses) above subsoiled and undisturbed portions of the wheat stubble field respectively. This yields the values of γg listed in Table 6.1. In each case, the resulting predictions of (6.4) at the three other locations (between
Predictions, approximations and empirical results
185
20 and 40 m) are good, whereas the ISO broadband formula (6.6) underestimates the measured attenuation by up to 10 dB. It should be noted that the values of γg that fit these used by Makarewicz and Kokowski [4] to data are significantly larger than those fit data obtained over grassland.
6.3 Predictions of the variation of A-weighted noise over discontinuous surfaces 6.3.1 Comparison between predictions and data for traffic noise The empirical formula in CRTN [10] for predicting ground effect from free-flowing traffic is ∆LCRTN=5.2 log(3h/d), 1≤h≤d/3 (6.7a) where h is the mean propagation path height and d is the distance from edge of the nearside carriageway. Hothersall and Chandler-Wilde [11] have used a boundary element method to make a series of predictions of excess attenuation for A-weighted traffic noise. They assumed a continuous line source with a standard traffic noise spectrum over a hard surface and 3.5 m from the edge of soft ground. The soft ground impedance was represented by the Delany and Bazley model (3.2) using an effective flow resistivity of 250 kPa s m−4. They calculated the excess attenuation compared to a reference level at 10 m from the source. A good fit to their calculations for continuous soft ground beyond the edge of the hard surface was found to be given by the formula ∆LBEM=8 log(3.72h/d) 1≤h≤d/3.72. (6.7b) A comparison of predictions using (6.6) and (6.7) assuming a receiver height of 1.5 m is shown in Figure 6.7. The predictions of the standard (CRTN) method, for a receiver height of 1.5 m, appear relatively conservative. On the other hand, the boundary element predictions are for an isothermal stationary atmosphere whereas the standard predictions are intended to apply to moderate downwind conditions and the data on which it is based will include turbulence effects. In particular, turbulence will tend to reduce the ground effect. 6.3.2 Measurements and predictions of noise from aircraft engine testing Noise measurements have been made to distances of 3 km during aircraft engine run-ups with the aim of defining noise contours in the vicinity of airports [12].
Predicting outdoor sound
186
Figure 6.7 Comparison between predictions of a formula deduced from boundary element calculations [11 (solid line) and the empirical relationship for excess attenuation used in CRTN [10] for free flowing traffic (broken line). Measurements were made for a range of power settings during several summer days under near to calm weather conditions (wind speed <5 ms−1, temperature between 20 and 25°C). Between 7 and 10 measurements were made at every measurement station (in accordance with ICAO Annex 16 requirements) and the results have been averaged. Example results are shown in Figure 6.8. It can be shown that these data are consistent with nearly acoustically neutral conditions [12]. Note that at 3 km, the measured levels are more than 30 dB less than would be expected from wavefront spreading and air absorption only. Figure 6.8 shows predictions based on the known engine spectrum in the direction of the measurements (Figure 6.9), (2.40) and the Delany and Bazley one-parameter impedance model (3.2) with effective flow resistivities of 20,000, 300 and 2000 Pa s m−2 respectively for concrete, grass and soil. Up to distances of between 500 and 700 m from the engine, the data in Figure 6.8 suggest attenuation rates near to the ‘concrete’ or ‘spherical spreading plus air absorption’ predictions. Beyond 700 m, the measured attenuation rate is nearer to the ‘soil’ or between the ‘soil’ and ‘grass’ predictions. These results are consistent with the fact that the run-ups took place over the concrete surface of an apron and further away (i.e. between 500 and 700 m in various directions) the ground surface was ‘soil’ and/or ‘grass’. Indeed these data can be shown to be consistent
Predictions, approximations and empirical results
187
Figure 6.8 Measured differences (joined crosses) between the A-weighted sound level at 100 m and those measured at ranges up to 3 km during an II-86 aircraft’s engine test in the direction of maximum jet noise generation (~40° from exhaust axis) and predictions for levels due to a point source at the engine centre height assuming spherical spreading plus air absorption and various types of ground [12]. Reprinted with permission from Elsevier.
Figure 6.9 SPL Spectra, normalized to a distance of 1 m from an IL-86 engine test, as a function of angle (theta) (forward of the aircraft=0°) [12]. Reprinted with permission from Elsevier.
Predicting outdoor sound
188
Figure 6.10 Measured differences (joined crosses) between the A-weighted sound level at 100 m and those measured at ranges up to 3 km from an AI-24 turbo-prop engine (on an An-24 aircraft) in the direction of maximum propeller noise generation (~80° from axis of engine inlet) [12]. Reprinted with permission from Elsevier. with predictions that assume an impedance discontinuity between 500 and 1000 m from the source [12]. Figure 6.10 shows equivalent data and predictions for the attenuation from a propeller aircraft. The averaged data in both the maximum jet noise and the maximum propeller noise directions indicate a change from one rate of attenuation to another at distances greater than 500 m.
Predictions, approximations and empirical results
189
Figure 6.11 Measured sound levels in the direction of maximum propeller noise from a turboprop aircraft and the fit given by (6.8). Figure 6.11 shows that a fit to the data beyond 100 m in the direction of maximum propeller noise is given by LA=162−27.5 log(d)−0.005d, (6.8) where d m is the horizontal distance. This suggests attenuation considerably in excess of the sum of spherical spreading together and air absorption.
References 1 K.B.Rasmussen, Approximate formulae for short-distance outdoor sound propagation, Appl. Acoust., 29:313–324 (1990). 2 J.Defrance, Methode Analytique pour 1e calcul de propagation de bruit exterieur, PhD Thesis, L’Université du Maine, France (1997). 3 J.Defrance and Y.Gabillet, A new analytical method for the calculation of outdoor noise propagation, Appl. Acoust., 57(2):109–127 (1999). 4 R.Makarewicz and P.Kokowski, Simplified model of ground effect, J. Acoust. Soc. Am., 101:372–376 (1997). 5 R.Makarewicz, Near-grazing propagation over soft ground, J. Acoust. Soc. Am., 82: 1706–1711 (1987). 6 K.M.Li, K.Attenborough and N.W.Heap, Comment on ‘Near-grazing propagation over soft ground’, J. Acoust. Soc. Am., 88:1170–1172 (1992). 7 R.Makarewicz, Reply to comment on ‘Near-grazing propagation over soft ground’, J. Acoust. Soc. Am., 88:1172–1175 (1992).
Predicting outdoor sound
190
8 K.Attenborough and K.M.Li, Ground effect for A-weighted noise in the presence of turbulence and refraction, J. Acoust. Soc. Am., 102:1013–1022 (1997). 9 ISO 9613–2, Method for predicting outdoor sound—Part 2 a general method of calculation, HMSO 1996. 10 Calculation of Road Traffic Noise, Dept. of the Environment and the Welsh office, HMSO 1993. 11 S.N.Chandler-Wilde and D.C.Hothersall, Propagation of road traffic noise over ground of mixed type, in Proc. Inst. Acoust., 7(2):367–374 (1985). 12 O.Zaporozhets, V.Tokarev and K.Attenborough, Predicting noise from aircraft operated on the ground, Appl. Acoust., 64:941–953 (2003). Reprinted with permission from Elsevier.
Chapter 7 Influence of source motion on ground effect and diffraction 7.1 Introduction Many of the previous chapters have been concerned with the sound field due to a stationary monopole source above an absorbing ground. For example, the asymptotic solution for a stationary monopole was considered in Chapter 2. However, there is an increasing concern about the noise from all forms of transportation. Such sources are neither stationary nor monopole in nature. We studied the sound field due to a directional source in Chapter 5. In this chapter, we study the effect of source motion on sound propagation outdoors. Previous analyses have simplified the problem of modelling a moving source either by treating it as a quasi-stationary point source or, in the case of road traffic noise, as a continuous line source. This assumption is valid for a vehicle travelling at a low speed but is unlikely to be adequate for a source travelling at a non-negligible Mach number such as a high-speed train, an advancing helicopter or aircraft approaching an airport during landing (or taking-off). A better physical understanding of the effects of source motion should lead to better designs of suitable noise control devices. There have been many theoretical and experimental efforts to study the effects of motion on aerodynamic noise. However, these were restricted to either an unbounded medium or propagation above a rigid half plane [1–3]. In this chapter we investigate the effect of motion of the source on propagation of sound above an absorbing ground by means of analytical approximation. The problem to be addressed can be considered as an extension to the problem of predicting the free field sound pressure due to a moving source. This type of problem has a long history and has been addressed by many authors. In his seminal paper Lowson [4] pointed out the importance of stating whether the theoretical derivation is based on the wave equation for the velocity potential or on the wave equation for the perturbation pressure. Similarly, Graham and Graham [5] have distinguished two different types of models for a moving source: a conventional moving source that injects fluid as it moves, and, a modified source that can be depicted as an expanding and contracting balloon in uniform motion. Despite the considerable previous theoretical work, there are relatively few in-depth studies addressing outdoor sound propagation from sources moving at high speeds. In this chapter, we shall provide the theoretical basis for such developments. Our study is based on the wave equation for the velocity potential as it is used to describe the sound field due to a moving monopole source [3]. The use of velocity potential is tied in closely with the fundamental theory of fluid mechanics whereas an approach based on the wave equation for the perturbation pressure has little physical significance.
Predicting outdoor sound
192
7.2 A monopole source moving at constant speed and height above a ground surface Consider a point monopole source of unit strength moving at a constant speed of u(≡cM) along the x-axis where c is the speed of sound and M is the Mach number. The source is moving at a constant height, zs above an impedance ground with a specific admittance β. The intention is to determine an analytical expression for the sound field due to a moving source above an impedance ground in the homogeneous atmosphere. The governing equation is the space-time wave equation given by
(7.1a) and the boundary condition, at z=0, is determined by
(7.1b) Here, φ is the velocity potential relating to the acoustic pressure p by
p=∂φ/∂t, (7.2) ω0 is the angular velocity of the source (x, y, z) are the rectangular coordinates of space and t is time. The analysis can be simplified considerably by using a Lorentz transformation [5] such that
(7.3)
where
(7.4) This transformation reduces the governing wave equation and the boundary condition (at zL=0) to
Influence of source motion on ground effect
193
(7.5a)
(7.5b) where hs=γzs and the subscript L denotes the corresponding parameters in the Lorentz coordinates. The resulting equation (see (7.5a)), is analogous to that of a stationary source except that the source strength and the time-dependent factor are modified accordingly. In addition, the boundary condition (7.5b), is somewhat different from that of a stationary source above an impedance ground. It is apparent from (7.5b) that use of a Lorentz transformation leads to a relatively simple equation compared to that resulting from use of a Galilean transformation [6, 7]. The interpretation of different terms in the analytic expression will be left until section 7.5 after we have derived the corresponding expression for a source moving perpendicularly to the ground surface in section 7.3. can be factored out by separating the variables in the The time-dependent factor, solution of (7.6) into spatial and temporal domains as
(7.6) where GL(XL) is the required Green’s function for the Helmholtz equation with the source located at (0, 0, hs). Then (7.5) becomes
(7.7a)
(7.7b) where k0(≡ω0/c) is the wavenumber. We introduce a Fourier transformed pair for the Green’s function in the Lorentz space (cf. (2.5a) and (2.5b) of Chapter 2),
(7.8a)
and
Predicting outdoor sound
194
(7.8b) using the same analysis as described in Chapter 2, we can show that
(7.9) Substitution of (7.9) into (7.8b) gives an integral representation of the sound field which can be estimated by evaluating the integrals asymptotically. The solution for (7.9) is wellknown for the case of a stationary source and it is sometimes referred to as the Weyl-Van der Pol formula. The method of steepest descent is used to derive the asymptotic solution. The total field is given by a sum of three components: a direct wave term G1, a contribution due to an image source G2 and a boundary wave term Gb. The boundary wave term is particularly important for the near-grazing propagation above a ground of finite impedance. The same analytical method can be applied to the corresponding result for a moving source and leads to an accurate asymptotic solution. It follows that φ1 and φ2 can be found straightforwardly as
(7.10)
(7.11) where d1 and d2 are the direct and reflect path lengths in Lorentz space:
(7.12)
The boundary wave term, Gb, can be expressed as
(7.13)
Influence of source motion on ground effect
195
The evaluation of the above integral can be simplified considerably by using spherical polar coordinates centred on the source and the concept of effective admittance such that βL=γβ(1+M sin θL cos ψL) (7.14) where θL and ψL are, respectively, the polar and the azimuthal angles of the reflected wave in the Lorentz space. The polar angle θL may be interpreted as the angle of incidence of the reflected wave also. Using the procedure detailed in Chapter 2, the boundary wave term can be evaluated to give
(7.15a) where
(7.15b) Noting the relationship (7.6) and summing the contributions due to the direct wave term, image source term and the boundary wave term, we have
(7.16)
where
(7.17a)
(7.17b) Equation (7.16) reduces to the classical Weyl-Van der Pol formula (2.40) in the case of a stationary source (M=0). It should be pointed out that the ground wave term in (7.16) is ignored in earlier publications [5–7]. However, it has been shown that the ground wave term is particularly important for a stationary source at low frequencies near the ground
Predicting outdoor sound
196
effect dip. Since it is expected that the same situation will apply to a moving source above an impedance plane, ignoring the ground wave term will lead to erroneous predictions especially at frequencies near the ground effect dip. Equation (7.16) is an asymptotic expression for the sound field due to a source moving at constant speed parallel to the ground. Next we aim to give the physical interpretation of each term in (7.16). Let us first consider the amplitude of the direct and reflected waves. It is sufficient to study the reflected wave term as they have similar characteristics. In general, sounds heard at different positions are heard at different times. It is apparent that the instantaneous relative positions between the moving source and a stationary receiver have little relevance in the determination of the sound field. It is convenient to use the ‘emission time geometry’. This is the geometry we have already used to describe the sound field due to a stationary source in the homogeneous atmosphere. Ignoring the constant factor, 1/4π, the virtual distance travelled is d2/γ2=r2(t) say. Replacing the Lorentz coordinates with the emission time coordinates, the virtual distance is simply
(7.18a) It should be remarked that the instantaneous distance, R1(t) between the source and receiver is given by
(7.18b) Suppose τ2 is the emission time of sound heard at x at time t. An implicit relationship between t and τ2 can be expressed as
(7.19a) This can be solved to obtain τ2 explicitly for any locations of observer as follows,
(7.19b) The spurious roots have been introduced as a result of squaring both sides of (7.19a) in Since must be real and less than t, there is only one order to obtain a solution for root with the choice of negative sign that satisfies these conditions. To write the virtual distance r2 in terms of R2, it is useful to combine (7.18a) and (7.19b). With some simple algebraic manipulations, we obtain
Influence of source motion on ground effect
197
r2(t)=c(t−τ2)−M(x−cMτ2). (7.20) The above equation can be simplified further if we introduce a Doppler factor, 1−Mr2, such that Mr2=M(x−cMτ2)/R2(τ2)=M sin θ cos ψ. (7.21) where θ and ψ are the polar angle and azimuthal angle between the source and observer’s position at emission time. Hence, it follows from (7.20) and (7.21) that the virtual distance is given by
(7.22)
The virtual distance, r2, may be interpreted as the distance between the image source and receiver’s position at the emission time τ2. This distance is further modified by the wellknown Doppler factor, 1−Mr2. The emission time τ2 may be regarded as the retarded time as a result of the time delay for the sound propagation from the image source to the receiver’s position. We seek to represent the phase of the reflected wave in terms of the retarded time. The phase function of the reflected wave, can be transformed back from the Lorentz space to the emission time coordinates as follows:
(7.23)
Similarly, the plane wave reflection coefficient Rp and the numerical distance wL can be written in the emission time coordinates as
(7.24a)
Predicting outdoor sound
198
(7.24b)
where w and Rp are, respectively, the numerical distance and the plane wave reflection coefficient in the emission time geometry. The following identities, which are adapted from Morse and Ingard [3], are found useful in deriving (7.24).
(7.25a) and
(7.25b) The source motion has no effect on the plane wave reflection coefficient but the numerical distance has been modified by a factor (1−Mr2)−1/2. The same transformation can be applied to the direct wave term, although Rp and wL are not required in this situation. Denoting the Doppler factor for the direct wave by 1−Mr1, we can express (7.16) in the emission time coordinates:
(7.26)
In principle the sound field can be obtained by differentiating (7.26) because it is related to the velocity potential, φ, through the use of (7.2). However, this approach will lead to a somewhat lengthy evaluation [8]. An alternative method for obtaining an asymptotic form for p is to differentiate both sides of the space-time equation. Noting (7.2) and expanding the right-hand side of (7.1a), we obtain
(7.27a)
Influence of source motion on ground effect
199
where the prime denotes the derivative respect to its argument. Similarly, the boundary condition (cf. (7.1b)) can be re-stated in terms of the sound pressure as
(7.27b) A close examination of (7.27a) reveals that there are two source terms consisting of a monopole and horizontal dipole in the space-time equation. Applying the principle of superposition, we can find the sound field corresponding to each individual component source and assume that the total sound field is a sum of these two contributions. From the analysis earlier in this section, the monopole sound field, pm can be written down immediately as
(7.28)
The asymptotic solution for the sound field due to the horizontal dipole is available also because we developed it in Chapter 5. The sound field due to a moving horizontal dipole, pd can be found by starting from the solution for a moving monopole. The asymptotic solution is obtained by differentiating the appropriate solution for the moving monopole to give
(7.29)
This can be transformed back to the emission time coordinates by using the same approach as we did for the sound field due to a monopole source. After some algebraic manipulation, it is straightforward but tedious to show that the total sound field from combining (7.28) and (7.29) yields the rather compact form
Predicting outdoor sound
200
(7.30)
This is the asymptotic solution for the sound field due to a monopole source moving at constant speed parallel to a ground surface. It may be called the ‘Doppler Weyl-Van der Pol formula’. As expected, the solution can be reduced to the classical form (2.40) when the speed of the source vanishes.
7.3 The sound field of a source moving with arbitrary velocity In the last section, we saw that the use of a simple transformation serves to bring the source at rest relative to the ground surface in the frame of Lorentz space. This is possible only when the source is moving at a constant height above the ground surface. Generalization of the method to other situations faces considerable geometrical complexities even for one of the simplest case where the source just moves at constant speed vertically upwards. This is because the ground surface is now moving away from the source after the transformation. This renders subsequent analyses intractable. Consequently, it is rather difficult to extend the method of Lorentz transformation to other more general situations. So, if it is of interest to derive an asymptotic formula for a source moving at arbitrary velocity above a ground surface, the method of Lorentz transformation is not applicable even if we are prepared to take up the challenge of modifying the solution to meet the boundary condition of a moving impedance plane. A new approach is required to allow the derivation of the required asymptotic formulae. Before we move on to derive a generalized expression for a source moving at arbitrary speed above a ground surface, it is instructive to consider the classical prediction of the free field due to a moving source. The space-time wave equation is
(7.31) where r≡(x, y, z) is the field point and rs≡(xs, ys, zs) is the instantaneous position of the source. Differentiation of rs with respect to t gives the instantaneous velocity, u=cM≡(cMx, cMy, cMz) of the source. Without resort to the use of the method of Fourier transformation, there is a subtle way in deriving an exact solution for the sound field due to a moving source. The method is as follows: the field generated by a source (or even an extended source) of strength q(r, t) is given by the well-known integral representation [9] of
Influence of source motion on ground effect
201
(7.32) where y is the source’s location and τ is the retarded time which varies over the source. It is given by τ=t−|r−y|/c. By the use of generalized function, δ(t−τ−|r−y|/c, (7.32) is identical to
(7.33) Now, for a point moving harmonic source, the source strength is simply q(r, t)=−exp(−iω0t)δ(r−rs(t)). Hence, the sound field given in (7.33) may be rewritten as
(7.34) Changing the order of integration, the triple integral with respect to y can be evaluated straightforwardly and exactly because of the δ-function and its solution is
(7.35) The integral with respect to τ can be evaluated also. Using a property of δ-functions
where f and g are any arbitrary functions and τ* is a zero of g, that is, any solution for g(τ)=0, and the prime denotes the derivative with respect to τ, we can identify that f=exp(−iω0τ)/4π|r−rs(τ)| and g=t−τ−|r−rs(τ)|/c. The differentiation of g with respect to τ gives
Predicting outdoor sound
202
For a subsonic source speed,
|g′|=1−Mr where
Comparing with (7.21), we can see Mr is the component of the source Mach number in the direction of the observer. With the aid of this analysis, the integral with respect to τ in (7.35) can be evaluated exactly to yield
(7.36) where R(τ*)=|r−rs(τ*)| and τ* satisfies
c(t−τ*)=|r−rs(τ*)|. (7.37) Now we are in a position to investigate the sound field due to a source moving above a ground surface with an arbitrary velocity. Again, the sound field is governed by the space-time wave equation given in (7.31) subject to the impedance boundary condition of (7.1b). As expected, the sound field is composed of two terms: a direct wave φ1 and a reflected wave φ2. With this analysis, the solution for the direct wave can be written immediately as
(7.38a) where
(7.38b) τ1 is a zero of
Influence of source motion on ground effect
203
c(t−τ1)=R1(τ1), (7.38c) and Mr1 is the component of the source Mach number in the direction of the observer. The same method is readily adaptable to the reflected wave by noting the source strength q(r, t) in (7.32) is replaced heuristically by q(r, t)=−exp(−iω0t)Qδ(r−rs(t)), (7.39a) where Q is the spherical wave reflection coefficient given by
Q=Rp+(1−Rp)F(w). (7.39b) Then, by using the same procedure, we can obtain an asymptotic formula for the reflected wave as
(7.40a) where
(7.40b) τ2 is a zero of
c(t−τ2)=R2(τ2), (7.40c) and Mr2 is the component of the image source Mach number in the direction of the observer. The spherical wave reflection coefficient Q in (7.40a) is calculated at the emission time τ2. If we consider the special case of a source moving at a constant speed in the x-direction, we discover that the reflection wave term derived in this section is the same as that derived in section 7.2, except that the numerical distance w differs by a correction term (1−Mr)−1/2. The correction term, which is introduced as a result of approximating the source strength in (7.39a), is small if the source traverses at low subsonic speed. To allow an uniform asymptotic solution for two derivations, we assume that the numerical distance should be modified by the same correction term as derived in
Predicting outdoor sound
204
section 7.2. Hence, summing the contribution of the direct and reflected wave terms, we obtain the velocity potential for a source moving at arbitrary velocity as follows:
(7.41)
To obtain an asymptotic expression for the acoustic pressure, we need to differentiate the velocity potential with respect to t. It is useful just to consider the direct wave, p1;
(7.42)
Making use of the following identities,
where is the component of the source acceleration in the direction of the observer, we can show that the direct wave is given by
(7.43) Equation (7.43) is the free field sound pressure due to a source moving at arbitrary velocity. An extra term is introduced as a result of the acceleration of the source, which is This furnishes a generalization of the result derived significant when
Influence of source motion on ground effect
205
by Morse and Ingard [3] who have considered the sound field due to a source moving at a constant speed, apart from a minor typographical error in their equation (11.2.15). For a distant slow source, variations of the spherical coefficient Q with emission time t are generally small. Hence, the reflected wave term can be derived in an analogous manner as that for the direct wave. The solution is
(7.44)
The total sound field is obtained by summing the contributions of the direct and reflected waves to give,
(7.45)
The ground attenuation for stationary sources is usually expressed by means of the excess attenuation (EA), that is the ratio in dB of the total pressure field to the direct field (see Chapter 2). For sources in motion, we refer to the instantaneous excess attenuation which is that observed at the emission time te for which the interfering direct and reflected fields respectively. An example are calculated by means of the retarded times tL and numerical prediction of the instantaneous excess attenuation [10], for a source moving above a porous ground at a height of 3 m at Mach number 0.3 in uniform circular motion with radius 2 m about a vertical axis, is shown in Figure 7.1. The impedance of the porous ground is modelled by using (3.13) with σe=140 kPa s m−2 and αe=35 m−1. Equation (7.45) can be reduced to (7.30) for the special case of a monopole source moving parallel to the ground surface at constant speed. The solutions for a moving source ((7.45) and (7.30)) have a similar form to that for a stationary source. The only difference is that the magnitudes of the direct and reflected waves are modified due to the effect of source motion. The apparent impedance of the ground surface is unaffected by the convection of the source but there is a small correction to the numerical distance. This slightly alters the boundary loss factor and has a relatively small effect on the overall sound field especially for a relatively slow moving source. In the next section, we shall compare the accuracy of another approximation scheme with the ‘exact’ formulation derived in this section.
Predicting outdoor sound
206
Figure 7.1 (a) Predicted instantaneous excess attenuation for a source in circular motion at Mach 0.3 about the vertical axis, (b) Excess attenuation for the corresponding stationary source.
7.4 Comparison with heuristic calculations As a first approximation for low source speed, the effects of motion are sometimes ignored. For example, a road or railway track may be modelled as a coherent line source [11]. This assumption produces a simple solution since the asymptotic solution for a line source (see section 2.7) can be used. An alternative heuristic approach is to model the problem as the sound field due to a quasi-stationary point source with the source frequency adjusted by the Doppler factor, (1−Mr)−1. The sound field can be computed by using the Weyl-Van der Pol formula (2.40) with the source frequency of f1≡f0(1−Mr)−1. Moreover, the ground admittance can be calculated using the Dopplerized frequency for the interfering reflection. Numerical calculations of the pressure field due to a source in uniform motion above an impedance plane have been carried out (M Buret thesis) for Mach numbers up to 0.3 (370 km h−1). The modified Weyl-Van der Pol calculation (7.16) is compared with the heuristic approach for the calculation of the sound field in Figure 7.2. The source is located at height zs=1 m above the ground, and is travelling along the xaxis. The receiver height is 1.2 m. The ground admittance is calculated by means of the variable porosity model (3.13) with parameters σe=140 kPa s m−2 and αe=35 m−1. Predictions of the two models for a moving point source are compared with the calculation for stationary source in Figures 7.2 and 7.3. The varying time parameter used here and subsequently relates to the position of the
Influence of source motion on ground effect
207
Figure 7.2 Predicted instantaneous excess attenuation at a receiver 1.2 m high and 50 m from an approaching source moving parallel to a horizontal flat ground at a height of 1 m (a) using (7.16), (b) using the heuristic approach with Dopplerized frequency and (c) assuming a stationary source. source corresponding to the emission of the interfering reflection. For Figure 7.2 the separation distance between the source path and the receiver is 50 m. With the chosen geometry, there is near-grazing incidence for all source positions so the values taken by the emission times for interfering direct and reflected waves are indistinguishable. The observation time t varies non-linearly with the emission position. Figures 7.3 (a) and (b) show that the ground effect dip is shifted towards the low frequencies when the source approaches the receiver (the ground is seen as softer), and towards higher frequencies when the source is receding (the ground is seen as harder). However, the heuristic, that is Dopplerized frequency, calculation shows greater sensitivity to the motion than the modified Weyl-Van der Pol calculation (7.16). Although effects due to source motion are observable in the frequency domain, the influence on the intensity of the ground attenuation on the variation in magnitude of the ground effect dip is only a few dB. For the chosen geometrical and ground parameters, at Mach number 0.3, there is a shift of about 100 Hz according to the modified Weyl-Van der Pol formula (solid lines) and 170 Hz with the heuristic calculation (dashed lines). Figure 7.4 shows the frequency shift of the ground effect dip due to source motion at Mach numbers 0.1 (white), 0.2 (grey) and 0.3 (black). The calculation of the frequency of the ground effect dip is carried out by locating the first minimum in the instantaneous excess attenuation. Because this calculation has been carried out numerically, the smoothness of the resulting curves is rather poor. For the chosen
Predicting outdoor sound
208
Figure 7.3 Instantaneous excess attenuation predicted (A) when the source approaches the receiver: and
Influence of source motion on ground effect
209
(B) when the source is receding from the receiver: (a) Solid lines represent predictions of the modified Weyl-Van der Pol formula (7.16); dashed lines represent predictions using the Heuristic approach (i.e. Dopplerized frequency). The dotted line represents predictions for a stationary source.
Figure 7.4 Frequency shift of the ground effect dip due to source motion. The configuration is the same as that for Figure 7.3. Solid lines represent predictions using the modified WeylVan der Pol formula. Broken lines represent predictions using the heuristic approach. geometrical and ground parameters, at Mach number 0.3, the predicted shift is about 100 Hz according to the modified Weyl-Van der Pol formula (solid lines) whereas a shift of 170 Hz is predicted with the heuristic calculation (dashed lines). For higher source speeds, the shift of the ground effect dip is predicted to have a significant influence on the resulting sound level, particularly for a source whose spectrum peaks in the frequency range where the maximum attenuation is observed.
Predicting outdoor sound
210
7.5 Diffraction of sound due to a point source moving at constant speed and height parallel to a rigid wedge 7.5.1 Kinematics Consider a semi-infinite rigid wedge with arbitrary top angle T=2π−T1−T2 and constant cross section in the y–z plane. A sound source S is moving along the x-axis, parallel to the edge of the wedge and a cylindrical coordinate system [ξ, r, x] can be introduced as shown in Figure 7.5, with rS≡[ξS, rS, xS] representing the source coordinates. For uniform source motion at Mach number M, the only varying parameter is the source-receiver offset x−xS. If the initial position of the source is at x=0,
Figure 7.5 Geometry describing a source in uniform motion along a semi-infinite wedge. then, where c0 denotes the speed of sound,
xS(t)=c0Mt. (7.46) The projection of the geometry in the cross-sectional plane remains unchanged with source motion so there is an analogy with a stationary source in a 2-D situation. According to the geometrical theory of diffraction, the diffracted sound ray is a broken segment linking the source S to the edge of the wedge E to the receiver R. The diffraction angle ε is the same on both source and receiver side [12]. If the receiver is at x=0,
(7.47) where te is the time of emission of the diffracted wave reaching the receiver at time t and L the total length of the diffracted ray. Also, from the geometry,
Influence of source motion on ground effect
211
(7.48) and
(7.49a) where
(7.49b) ME=M cos ε being the component of the Mach number along the diffracted ray. 7.5.2 Diffracted pressure for a source in uniform motion The solution for wedge-diffracted wave from a stationary point source is well known. The result given by Pierce [12], based on the electromagnetic theory, is used here. Morse and Ingard [3] have derived the sound field due to a monopole in uniform motion in the free field by means of a Lorentz transformation. Buret et al. [13] have used this transformation to formulate the Doppler-Weyl-Van der Pol formula (7.30). The coordinates and time (xL, yL, zL, tL) in the Lorentz space are given by (7.3). In the Lorentz space, it can be shown that the acoustic pressure field can be expressed as the sum of contributions from two stationary sources: a monopole and a dipole oriented in the direction of source motion [14]. Denoting these relative contributions by p(0) and p(1) respectively, the total pressure p due to a source of strength P0 can be expressed as [13]:
(7.50) With constant Mach number, the Lorentz transformation involves uniform expansion along the three dimensions, as well as a time-dependent translation along the direction x of source motion. As a result, the transformed geometry is analogous to that for a stationary source in the physical space. A cylindrical coordinate system [ξL, rL, xL] is introduced and is related to that in the physical plane by
(7.51)
Predicting outdoor sound
212
The polar angle is unaffected by the transformation. As a result, the top angle of the wedge has the same value in both the transformed and the physical space. The expression for the monopole component of the diffracted wave is deduced straightforwardly from Pierce’s formulation [12] as
(7.52a) where LL is the diffracted path in the transformed coordinates and AD is the diffraction integral given by
(7.52b)
(7.32c)
(7.52d) where ν=π/(2π−T) is the wedge index and ρS=γrS. Buret et al. [15] have derived the expression for the 3-D dipole field diffracted by a wedge and they have validated this expression through laboratory measurements. For a dipole lying along the xL-axis,
(7.53)
In (7.53), dipole orientation cosines missing from eq. (14a) of Ref. [15] have been reintroduced, that is (ℓx, ℓy, ℓz)=(cos εL, 0, 0). For long diffraction paths and high frequencies, XL+ and XL− take small values and the second term in (7.53) can be neglected [15]. This approximation is particularly sensible for source motion along the wedge, as the diffracted path length increases with the time-dependent source-receiver offset x−xS. The dipole component of the pressure then takes a form similar to the monopole pressure given in (7.52), except for a directivity factor and a strength factor:
(7.54)
Influence of source motion on ground effect
213
(7.55a)
(7.55b) and
(7.55c) where the total diffracted pressure is expressed by substituting (7.52) and (7.54) into (7.50). Hence the diffracted acoustic pressure wave due to a monopole in uniform motion in parallel to a rigid wedge can be formulated as follows:
(7.56)
where AD is defined as in (7.52b) with
(7.57) For a receiver in the shadow zone of the obstacle, the total pressure field is given by (7.56). However, for arbitrary source or receiver position, it involves potential contributions from a direct pressure wave, as well as reflections on the sides of the wedge. The formulation of the total pressure in the transformed space is straightforward by means of (7.45) together with the expression for diffraction of sound from arbitrarily positioned monopoles [12] and its extension to dipoles by Buret et al. [15]. This is not developed here for brevity’s sake. In Figure 7.6, predictions of the diffracted wave are plotted for discrete frequencies 100 Hz, 1 kHz and 5 kHz, for a point source moving at Mach number 0.3 in the vicinity of a semi-infinite rigid half plane (T=0; ν=1/2) with source, receiver and obstacle edge at
Predicting outdoor sound
214
heights 1 m, 1.2 m and 2 m respectively. The shortest horizontal separation from the obstacle to the source is 10 m and that to the receiver on the other side is 20 m. Solid lines show the calculation by means of (7.56). Calculations by means of the complete dipole component as in (7.53) are indistinguishable from the latter. The approximation used to derive (7.56) is valid along the whole source path. Broken lines show the calculation for the corresponding stationary omni-directional point source located at the position xS(te) of emission.
Figure 7.6 Diffracted pressure predicted at discrete frequencies 100 Hz (——), 1 kHz (— —) and 5 kHz (——) for a source in uniform motion at Mach 0.3 along a half-plane. The source path is 1 m below the edge, at a horizontal separation of 10 m. The receiver is 0.8m below the edge at a distance of 20 m. Solid lines correspond to the approximate solution. Predictions without approximation (i.e. using the full dipole component) are undistinguishable from the approximate results. Dashed lines (with different thicknesses) correspond to predictions for the corresponding stationary source at the point of emission.
Influence of source motion on ground effect
215
Comparison of the predictions for a stationary source with those for a moving source enables assessment of the effects of source motion. As the moving source approaches the the Sound Pressure Levels (SPLs) are predicted to be higher than for receiver the SPLs are predicted to be a stationary source. When the source is receding lower than for a stationary source. In particular, the maximum in SPL is predicted to occur when the source is approaching the receiver, that is before the position of closest approach. These effects are related to the Doppler factor (1−M cos ε)−1 and the convection coefficient (1−M cos ε)−2 in (7.56). Both are larger than unity on approach and smaller than unity on recession. These observations are consistent with previous results for a source in the free field [3].
7.6 Source moving parallel to a ground discontinuity 7.6.1 Introduction A semi-empirical formula for the sound field due to a stationary source in the presence of a ground discontinuity has been derived by De Jong, considering the superposition of two half planes with different admittance [16]. This model was shown to be valid in 3-D situations for which the propagation path is not necessarily perpendicular to the discontinuity [16] and was later and extended to dipole sources [15]. Derivation of the acoustic pressure field for source motion in parallel to the discontinuity is then straightforward (see (7.45)). Consider that a point source is in uniform motion parallel to an impedance jump coinciding with the x-axis and at height zS (see Figure 7.7).
Figure 7.7 Geometry describing a source in uniform motion parallel to a discontinuity in ground impedance. The ground on the source side is characterized by specific admittance β1 and that on the receiver side by β2. The direct wave reaching the receiver R at time t has been emitted at instant te, following path R=c0(t−te) with azimuthal angle ψ and elevation angle The reflected wave reaching R at instant t, and denoted subsequently by dashed parameters in
Predicting outdoor sound
216
the physical space, has been emitted at retarded time and has followed path with azimuthal and elevation angles and respectively. For brevity, the and R′, ψ′, θ are not detailed here since their derivation is expressions for straightforward [14, 15]. The diffracted wave follows path L defined by (7.48) and its time of emission is calculated from (7.48) and (7.49). During the source motion, the point of specular reflection remains on a line parallel to the admittance discontinuity and the source path. Consequently, the proportion of each type of ground covering on the source-receiver path also remains constant during the motion of the source. This is of particular interest if there are strips of different grounds, parallel to the source path. Some models for such a situation involve tedious calculations whereby the diffracted waves at each discontinuity are summed [18–20]. However Nyberg [17] has shown that for an infinite alternation of strips with respective admittance β1 and β2, the ground effect could be modelled using the area-averaged admittance
(7.58a) with a and b the spatial periods for each strip. This theory is valid for short periods compared with the incident wavelength λ [18], that is for
(7.58b) This condition might not be fulfilled for source motion parallel to the strips, since the effective width of the strips along the sound propagation path is increased by a factor 1/cos ψ due to the source-receiver offset. However, some tolerance in the accuracy of the model is acceptable for source positions at large offsets for which the distance attenuation is large. Moreover, Nyberg’s theory has shown to give good agreement with measurements beyond its limit of approximation [18]. Calculation of the acoustic pressure field for a source moving along periodic strips of ground is straightforward, by substituting the area-averaged impedance into the Doppler-Weyl-Van der Pol formula (7.16). 7.6.2 Uniform motion parallel to a single discontinuity After Lorentz-transforming De Jong’s solution for a stationary source [16], the monopole component of the acoustic pressure near a single impedance discontinuity is
Influence of source motion on ground effect
217
(7.59)
where LL is the diffraction path in the Lorentz space for a horizontal half plane whose edge coincides with the ground discontinuity and DL=AD(XL+)+ AD(XL−), that is the sum of the two diffraction integrals given in (7.52). QG is the spherical wave reflection coefficient at the point of specular reflection, with G≡1 or 2 depending on the geometry. Q1 and Q2 are the spherical wave reflection coefficients for each type of ground. They are calculated by using the Doppler-Weyl-Van der Pol formula (7.16), that is
(7.60a)
where is the component of the Mach number in the direction of propagation of the reflected wave,
(7.60b) and Rp,i, the plane wave reflection coefficient, is given by
(7.60c) The expression for the boundary loss factor F is
(7.60d)
where erfc denotes the complementary error function and wi the numerical distance is given by
Predicting outdoor sound
218
(7.60e) When the point of specular reflection coincides with the admittance step, and XL+=0. Since AD(0)=−(1−i)/2, the continuity of the monopole component of the acoustic pressure across the jump is ensured. The dipole component is also expressed as the sum of a direct, a reflected and a diffracted pressure wave to which are applied the appropriate reflection coefficients. The formulations for the direct and the reflected fields are given in Li et al. [21] and the form of the diffracted wave is given in Buret et al. [15]. Hence the total dipole contribution may be expressed as
(7.61a)
In (7.61a)
(7.6 1b) and θL are the azimuthal angle and the represent the directivity factors where elevation angles for the direct and reflected ray in the Lorentz space and θE,L is the elevation angle of the ray linking the source to the admittance step. Corresponding angles in the physical space are shown in Figure 7.7. It should be noted that when the point of and continuity of the specular reflection lies on the impedance jump, acoustic pressure across the jump is ensured. Since variations of the spherical wave coefficient in the horizontal directions are known to be small [15], the last term in (7.61a) can be neglected and (7.61) can be simplified to an expression analogous to (7.59) for the monopole component. The total pressure field is derived by substituting (7.59) and (7.60) into (7.45). Transformation back into the physical space is straightforward by using (7.55) and noting that [13]
(7.62a)
Influence of source motion on ground effect
219
(7.62b)
and
(7.62c) A double dash denotes the parameter in the physical space (see Figure 7.7). The pressure field for a source in uniform motion along an admittance discontinuity is then expressed as:
(7.63a) Where (7.63b)
(7.63c)
(7.63d)
Figure 7.8(a) shows the predictions of the SPL according to (7.63) as a function of the with a 33%-hard ground mix. The source position at emission of the reflected wave source is supposed to be moving at Mach number 0.3 with its track located 10 m away from the impedance jump at height 1 m above hard ground. The receiver is located 20 m away from the discontinuity, 1.2 m above soft ground characterized by the two-parameter impedance model (3.13) with flow resistivity σe=140 kPa s m−2 and porosity rate αe=35 m−1. Figure 7.8(b) shows the corresponding SPL predictions for a stationary source at offset locations between 0 m and 200 m. Comparison of these Figures enables the effects of source motion to be assessed.
Predicting outdoor sound
220
Figure 7.9 shows the same calculations but for the source track and receiver 20 m and 10 m away from the impedance jump respectively (66% of hard ground). The corresponding predictions of instantaneous excess attenuation (10 log(|p(t)|/|pdir(t)|)) are thick shown in Figure 7.10, for the source at offset 100 m on approach thin solid line) and for the corresponding solid line) and recession stationary source (broken line). Thick and thin dotted lines represent the predictions at the for moving and stationary source respectively and are closest position undistinguishable from one another.
Figure 7.8 (a) Sound Pressure Level (SPL, re. arbitrary reference) predicted for a source moving at Mach number 0.3 parallel to an admittance discontinuity, 10 m away from it, at height 1 m. The receiver is 20 m away from the step-line at height 1.2 m. The ground on the source side (33%) is hard, the ground on the receiver side is characterized by σe=140 kPa s m−2 and αe=35 m−1. (b) SPL for a stationary source in the same geometry as in (a), but with offset from 0 to 200 m.
Influence of source motion on ground effect
221
Figure 7.9 Same as Figure 7.8, but for a discontinuity at 20 m from the parallel source path (66% hard ground).
Figure 7.10 Instantaneous excess attenuation for the same configurations as in (a) Figure 7.8, (b) Figure 7.9.——Approach ——Recession ----stationary source at offset xS=100 m, ......moving source at closest separation the results for a stationary source at closest separation are undistinguishable from the latter. As observed for homogenous ground in section 7.4 (see also [13]), the predicted effects of motion are small. The predicted SPL contours are asymmetric along the source motion
Predicting outdoor sound
222
direction due to the Doppler shift and the convection factor that affect the location and magnitude of the ground effect dip. This results in lower SPL being predicted than for a up to the frequency of stationary source when the source approaches the receiver the ground effect dip and higher levels being predicted from the dip up to the higher frequency destructive interference. This trend in the predictions is reversed when the source recedes from the receiver. As the source approaches, the ground effect dip is predicted to be slightly sharper and deeper than that for a stationary source whereas, as the source recedes it is predicted to be slightly broader and shallower. Deformation of the SPL pattern and hence sensitivity to motion is predicted to be stronger on approach than on recession. On the other hand, change of the proportion in the ground mix covering the source-receiver path is predicted to have little effect.
7.7 Source moving along a rigid barrier above the ground 7.7.1 Barrier over hard ground Sound propagation in the presence of a rigid barrier above the ground is a classical problem. In the case of hard ground on both sides of the barrier, the solution is straightforward, by means of mirror images. When there is no direct sound and no reflection on the barrier, the total sound field is the sum of four diffracted waves,
Figure 7.11 Geometry describing a source in uniform motion parallel to a thin barrier above the ground. The diffraction path ‘12’ with ground reflections on both sides of the barrier is represented by thick lines. corresponding to the paths linking the source S and its image with respect to the ground S′ to the receiver R and its image R′ via the edge of the barrier (Figure 7.11).
Influence of source motion on ground effect
223
The paths including a ground reflection on the source side are denoted with subscript 1 and subscript 2 is used to indicate the paths for which there is a ground reflection on the receiver side. The total field is given by p=P0(p0+p2+p12) (7.64) where p0 stands for the diffracted wave obtained for path 0, linking source to edge to receiver with no ground reflection. Using the same reference systems as in section 7.5, the coordinate vectors of the image source and the image receiver are and r′ respectively. In the Cartesian and the cylindrical coordinates (x, y, z) and [r, ξ, x] they are expressed as
(7.65a) r′(t)=(0, y, −z)≡[r′, φ, x] (7.65b) where φS and φ are the elevation angles of the paths linking the projection of the image source and image receiver to the top of the barrier (see Figure 7.11). If zE denotes the barrier height,
(7.66a, b) The four diffracted paths have different lengths and as a result, for each contribution in
LK=c0(t−tK) (7.67a) where the LK’s are the diffracted path lengths,
(7.67b)
Predicting outdoor sound
224
The subscripts 0, 1, 2 and 12 have the same meanings as in (7.64). The components of the Mach number in the direction of the diffracted rays MK are determined from the diffraction angles εK by
(7.68) After solving the system of equations in (7.67), each pressure wave component is calculated from (7.56) by substituting the appropriate (image) source and (image) receiver coordinates together with the corresponding diffracted path and angle, LK and εK. The total pressure is then calculated by substituting the component pressures into (7.64). Figure 7.12(a) shows predictions of the sound field for the same configuration as used for Figure 7.6, but above hard ground (at zero height). The SPL predicted for the corresponding stationary source locations is given for comparison in Figure 7.12(b).
Figure 7.12 Predicted sound field due to a source moving at Mach number 0.3 along a thin barrier of height 2 m above hard ground. The source path is 10 m away from the barrier, at height 1 m. The receiver is in the shadow zone, 20 m away from the barrier and at height 1.2 m Again, the pressure field is predicted to be asymmetric along the source travel direction. Lower levels and hence stronger barrier attenuation are predicted as the source recedes from the receiver (xS(t0)≥0). On the other hand, sensitivity of the sound field to source motion is predicted to be more important on source approach (xS(t0)≤0), for which the deformation of the sound pressure level pattern is stronger. Strong interference between the four components of the acoustic pressure is observed in the high frequencies.
Influence of source motion on ground effect
225
7.7.2 Motion parallel to a barrier over arbitrary impedance ground If the ground on either or both source and receiver side of the barrier has finite impedance, the corresponding reflection coefficients differ from 1 (the value for acoustically hard ground). Equation (7.64) must be amended to account for the ground reflections [22]. It is then necessary to consider separately the monopole and the dipole component of the pressure field given in (7.45). We use β1 and β2 to denote the admittance of the ground on the source and receiver side respectively. As in the previous section, subscript 1 denotes a ground reflection on the source side, whereas subscript 2 corresponds to a ground reflection on the receiver side. The monopole component is obtained by transforming to the Lorentz space the sound field due to a stationary monopole in the presence of a barrier over the ground [22]:
(7.69) The primes on the reflection coefficients in the last term denote the fact that the emission time for p12 is different from those for p1 and p2. The diffracted monopole pressures are calculated from (7.52). Using Huygens’s principle and considering that the diffracted wave is emitted by a secondary source located at the edge of the obstacle, the spherical wave reflection coefficients are calculated for the paths joining the image source and the image receiver to the edge of the barrier [23]. Hence
(7.70) Using the Doppler-Weyl-Van der Pol formula (7.16), with i≡1, 2
(7.71a)
(7.71b)
(7.71c)
(7.71d)
Predicting outdoor sound
226
cos θ1=(zS+zE)/ρ1; cos θ2=(z+zE)/ρ2 (7.71e) (7.71a–e) can be used as appropriate also to calculate and To obtain the dipole component of the pressure field is expressed in the Lorentz space, we recall the solution for the stationary dipole [15]. For a dipole orientated along the xLaxis,
(7.72) are calculated using (7.54). where the diffracted dipole pressures The last term in (7.72) can be neglected due to the small variations of the spherical wave reflection coefficient in the horizontal plane. Hence after summing the monopole and the dipole contributions and transforming back into the physical space,
(7.73a)
(7.3b)
where K≡0, 1, 2, 12. Figure 7.13 shows predictions of the pressure field for the same source and barrier geometries as were used for Figure 7.11 but with hard ground on the source side and soft ground on the receiver side. Figure 7.14 shows the corresponding predictions for soft ground on both sides. As observed in respect of Figure 7.11, lower levels are predicted when the source is receding (xS(t0)≥0). Two dips related to the reflections on each side of the barrier are identifiable, particularly at large offsets and for source recession. As before, sensitivity to motion is predicted to be stronger on source approach. Also, source motion is predicted to be more important for soft ground. This was not so obvious in the predictions involving a
Influence of source motion on ground effect
227
Figure 7.13 Predictions for the same situation as in Figure 7.12 but with hard ground on the source side and soft ground (σe=140 kPa s m−2 and αe=35 m−1) on the receiver side.
Figure 7.14 Predictions for the same situations as obtain in Figures 7.12 and 7.13 but with soft ground on both sides. ground discontinuity as the proportion of hard ground was varied. This suggests that the source motion effect is related to the fact that, in the presence of a barrier, the angles of incidence of the reflected waves take higher values.
Predicting outdoor sound
228
References 1 D.G.Crighton, Scattering and diffraction of sound by moving bodies, J. Fluid. Mech., 72:209–227 (1975). 2 A.P.Bowling, Convective amplification of real simple sources, J. Fluid. Mech., 74: 529–546 (1976). 3 P.M.Morse and K.U.Ingard, Theoretical Acoustics, Princeton University Press, Princeton, NJ (1986), Chapter 11. 4 M.V.Lowson, Sound field for singularities in motion, Proc. Royal Soc. Series A, 286: 559 (1965). 5 E.W.Graham and B.B.Graham, Theoretical acoustical sources in motion, J. Fluid. Mech., 49:481 (1971). 6 T.D.Norum and C.H.Liu, Point source moving above a finite impedance reflecting plane— experiment and theory, J. Acoust. Soc. Am., 63:1069–1073 (1978). 7 S.Oie and R.Takeuchi, Sound radiation from a point source moving in parallel to a plane surface of porous material, Acustica, 48:123–129 (1981). 8 S.Oie and R.Takeuchi, Sound radiation from a point source moving vertical to a plane surface of porous material, Acustica, 48:137–142 (1981). 9 G.Rosenhouse and N.Peled, Sound field of moving sources near impedance surfaces, International Conference on Theoretical and Computational Acoustics, Mystic, CT, USA, 5–9 July 1993, vol. I, 377–388 (1993). 10 M.Buret, New Analytical Models For Outdoor Moving Sources of Sound, PhD Thesis, The Open University, UK (2002). 11 A.P.Dowling and J.E.Ffowcs Williams, Sound and Sources of Sound, Ellis Horwood Ltd., Chichester (1983), Chapter 7. 12 A.D.Pierce, Acoustics, an Introduction to its Physical Principles and Applications, Acoustical Society of America, New York (1989). 13 M.Buret, K.M.Li and K.Attenborough, Optimisation of ground attenuation for moving sound sources, Appl. Acoust., 67:135–156 (2006). 14 K.M.Li, M.Buret and K.Attenborough, The propagation of sound due to a source moving at high speed in a refracting medium, Proc. Euro-Noise, 98, Vol.2, pp. 955–960 (1998). 15 M.Buret, K.M.Li and K.Attenborough, Diffraction of sound from a dipole source near to a barrier or an impedance discontinuity, J. Acoust. Soc. Am., 113(5):2480–2494 (2003). 16 B.A.De Jong, A.Moerkerken and J.D.Van der Toorn, Propagation of sound over grassland and over an earth barrier, J. Sound Vib., 86(1):23–46 (1983). 17 D.C.Hothershall and J.N.B.Harriot, Approximate models for sound propagation above multiimpedance plane boundaries, J. Acoust. Soc. Am., 97(2):918–926 (1995). 18 P.Boulanger, T.Waters-Fuller, K.Attenborough and K.M.Li, Models and measurements of sound propagation from a point source over mixed impedance ground, J. Acoust. Soc. Am., 102(3):1432–1442 (1997). 19 M.R.Bassiouni, C.R.Minassian and B.Chang, Prediction and experimental verification of far field sound propagation over varying ground surface, Proc. Inter-Noise 83, Vol.1, pp.287–290 (1983). 20 C.Nyberg, The sound field from a point source above a striped impedance boundary, Acta Acust., 3:315–322 (1995). 21 K.M.Li, S.Taherzadeh and K.Attenborough, Sound propagation from a dipole source near an impedance plane, J. Acoust. Soc. Am., 101(6):3343–3352 (1997). 22 H.G.Jonasson, Sound reduction by barriers on the ground, J. Sound Vib., 22(1): 113–126 (1972). 23 P.Koers, Diffraction by an absorbing barrier or by an impedance transition, Proc. Inter-Noise 83, vol. 1, pp. 311–314 (1983).
Chapter 8 Predicting effects of mixed impedance ground 8.1 Introduction Many outdoor sound propagation situations involve at least one visible change in the ground impedance. Frequently there is a change from acoustically hard ground near the source to acoustically soft ground near the receiver. A typical example is sound propagation from a road where the road traffic source is over an acoustically hard surface such as hot-rolled asphalt but the receiver might be above grassland adjacent to the road. Other situations might involve propagation over a strip of acoustically hard ground such as a service road or acoustically soft ground such as occurs in a belt of trees. In addition, the impedance of naturally occurring acoustically soft ground varies from place to place along the propagation path. There might be several areas of differing impedance. Do these variations have a significant influence on propagation? Can the influence be predicted using an average or effective impedance and hence the models described in Chapters 2 and 3? In current prediction schemes for outdoor sound, allowance is made for mixtures of hard and soft ground. Either the computed soft ground effect is reduced linearly in proportion to the fraction of soft ground between source and receiver [1, 2], or it is computed only over the soft ground proportion of the path [3]. In this chapter, we review models for predicting the effects of impedance changes along propagation paths and the resulting understanding of these effects. We begin by discussing propagation over a single discontinuity. Subsequently we describe models and measurements over strips of different impedance. Also, we present some predictions of the resulting effects on Aweighted sound levels. Finally we consider the simultaneous effects of meteorological conditions and impedance change.
8.2 Single discontinuity 8.2.1 De Jong’s semi-empirical method Various analytical methods of solution for the two-impedance boundary have been proposed. These range from an exact solution in the form of a triple integral [4] to an approximate solution of the boundary integral [5]. Semi-empirical formulas have been proposed by Koers [6] and by De Jong et al. [7]. The former presented a model based on Kirchoff diffraction theory where the diffracted field at an impedance transition is calculated by taking it as a wedge with a top angle of 180° and having a different impedance on each side. De Jong considered Pierce’s formulation of sound diffraction
Predicting outdoor sound
230
from a wedge [8] with different surface acoustic impedances at either side. He then considered the limiting case where the wedge opens flat and derived his expressions for the propagation of sound over an impedance discontinuity. The form of solution proposed by De Jong et al. [7] is particularly useful since it is an empirical combination of the formulas for diffraction of spherical waves at a rigid half plane and the field due to a point source over an impedance plane. This means that it includes the spherical wave reflection coefficient calculation described earlier (Chapter 2) and, hence, it offers a relatively straightforward computation. Consider the situation shown in Figure 8.1. According to the De Jong model, the excess attenuation over the single discontinuity between portions of ground with impedance Za and Zb, the source being over Za, is given by
(8.1) where
(8.2)
Qa,b is replaced by Qa, the spherical wave reflection coefficient for the portion of the ground with impedance Za and the positive sign in the curly brackets is used when the point of specular reflection falls on that portion of ground. Conversely, Qa,b is replaced by Qb, the spherical wave reflection coefficient for the portion of the ground with impedance Zb, and the negative sign in the curly brackets is used when the point of specular reflection falls on that portion of ground. and are Fresnel integrals of
Figure 8.1 The geometry and path lengths for the De Jong formula (8.1).
Predicting effects of mixed impedance ground
231
the form and the path lengths are defined in Figure 8.1. Rd is the source-discontinuity-receiver path. According to Daigle et al. [9] and Hothersall and Harriott [10], the De Jong model fails at grazing incidence. On the other hand it agrees remarkably well with data obtained when source and receiver are elevated (see section 8.2.5). 8.2.2 Rasmussen’s method Rasmussen [11] has suggested a numerical method for determining the sound field over a plane containing an impedance discontinuity. A hypothetical planar source 40 wavelengths wide and 20 wavelengths tall is placed above the discontinuity. The planar source is discretized into an array of point sources a fifth of a wavelength apart. The relative strength of each source is calculated using the usual point source theory for propagation over infinite impedance Z1. The received field is calculated as the sum of the contributions from each of the constituent planar sources over an infinite Z2. However, comparison between predictions of this relatively numerically intensive method, the De Jong semi-empirical formula, and data indicated [11] that the De Jong formula is adequate for engineering purposes. The method is known also as the substitute sources method and has been developed further recently [12]. 8.2.3 Fresnel zone methods Following a suggestion by Slutsky and Bertoni [13], Hothersall and Harriott [10] have developed an approach based on Fresnel diffraction theory. They observe that if the oscillations due to diffraction are ignored, the excess attenuation with range from the source essentially varies between the values appropriate to point-to-point propagation over each impedance alone. The transition is within a well-defined region around the point of specular reflection between source and receiver. This may be defined as a Fresnel zone (see Figures 8.2 and 8.3) at the boundary of which the path length is some fraction (F) of a wavelength (e.g. λ/3) greater than the specularly reflected path.
Figure 8.2 Source-receiver geometry, specular reflection point P, equivalent specularly reflected path (S′R) and path (S′P′R) via point P′ on the Fresnel zone boundary so that S′P′+RP′−R2=Fλ.
Predicting outdoor sound
232
Figure 8.3 The elliptical boundary of the Fresnel zone in the ground plane. Hothersall and Harriott [10] have shown that path length differences between λ/3 and λ/4 are acceptable. The locations P′ of points on the surface of the Fresnel volume define the boundary of an ellipsoid with foci S′ and R and its major axis along S′R with semi-major axis a=(R2+Fλ)/2 and semi-minor axis the ground plane at an ellipse (see Figure 8.3) with equation
The Fresnel ellipsoid cuts
(8.3) where c=R2/2−SP and the origin of the coordinate system is the point of specular reflection. The area of this ellipse may be computed from the locations of the points x1,2 and y1,2 shown in Figure 8.3. These locations are given by
(8.4a)
(8.4b)
where
Predicting effects of mixed impedance ground
233
and
The expression for y1,2 differs from that given by Hothersall and Harriott [10], since they interchange variables x and y without being consistent with their notation. Moreover their corresponding expression is not dimensionally correct. The area of the ellipse is πx1y1. The frequency-dependent and geometry-dependent elliptical area defined in this way may be interpreted as the area of ground between point source and receiver which is important in determining the ground effect. The reduction in Fresnel zone size with increasing frequency is demonstrated in Figures 8.4 to 8.6 for source and receiver at 1 m height above the ground, separated horizontally by 10 m and F=1/3. Note that the major axis of the ellipse exceeds the source-receiver separation (10 m) at 100 Hz (see also the 63 Hz ellipse in Figure 8.6). This implies that the area of ground of interest at this frequency extends beyond that between source and receiver. The elliptical area becomes circular at normal incidence. If it is assumed that the excess attenuation is linearly dependent on the proportion of the different surfaces (µ) along the line between source and receiver representing the Fresnel zone, then
(8.5)
The line representing the Fresnel zone is defined by the intersection between the Fresnel zone ellipse ((8.4) and Figure 8.3)) and the vertical plane through source, receiver and specular reflection point.
Predicting outdoor sound
234
Figure 8.4 Semi-axes of elliptical Fresnel zone (8.3) as a function of frequency calculated for hs=hr=1 m, r=10 m and F=1/3. The solid line represents the semi-major axis and the broken line represents the semi-minor axis.
Figure 8.5 Area of elliptical Fresnel zone (8.3) calculated for hs=hr=1 m, r=10 m and F=1/3.
Predicting effects of mixed impedance ground
235
Figure 8.6 Fresnel (F=1/3) zones centred at the specular reflection point (5 m from source or receiver along source-receiver axis) at three frequencies for source and receiver at 1 m height and separated by 10 m. The projections of the source and receiver positions on the (x, y) plane are at (0, −5) and (0, 5) respectively. Apart from the factors µ and (1−µ), the terms on the right hand side of (8.5) represent the excess attenuation over uniform boundaries with surface impedance Z1 or Z2 respectively. The linear combination of excess attenuation given by (8.5) is implicit in standard calculations of ground effect [1, 2]. Alternatively, it is possible to assume that the excess attenuation components are proportional to the areas of the Fresnel zone occupied by each impedance. Other possibilities are that either the pressure or the intensity is proportional to µ. For example, if a linear interpolation of pressure is used,
Predicting outdoor sound
236
(8.6)
where µ is calculated from the areas of each impedance inside the Fresnel zone. 8.2.4 The Boundary Element Method The increasing availability of powerful computational resources is making numerical schemes based on Boundary Elements more attractive. The computational complexity of the Boundary Element approach is reduced considerably if it is used only for 2-D in a medium, D, problems. Let a line source produce a time-harmonic sound field, bounded by a locally reacting impedance surface, S. This impedance plane can have features such as impedance discontinuities, etc. The Boundary Integral form of the wave equation can be written as
(8.7) where rs is the position vector of the boundary element ds, and n is the unit normal vector out of ds. The parameter, ε, is dependent on the position of the receiver [14]. It is equal to 1 for r in the medium, 1/2 for r on the flat boundary and equal to the Ω/2π at edges where Ω is the solid angle. The Green’s function, G(r, r0), is the solution of the wave equation in the domain without the effect of scatterers. The integral is then the contribution of the scatterer elements to the total sound field at a receiver position. This integral formulation (first derived by Kirchhoff in 1882) is called the HelmholtzKirchhoff wave equation. It is the mathematical formulation of Huygen’s principle. For receiver points on the boundary, one obtains an integral equation for the field potential at the boundary. This Boundary Integral Equation is a Fredholm integral equation of the second kind. Once solved, the contribution of the scatterers can be determined by evaluating the integral in (8.7) and calculating the total field for any point in the entire domain, D. This is the main BIE equation for the acoustic field potential in the presence of non-uniform boundary. The BEM represents the acoustic propagation in a medium by the boundary integral equation and solves this integral equation numerically. The locally reacting impedance boundary condition is as follows:
(8.8) where β, the admittance, can be a function of the position on the boundary. This applies to the surface of the plane boundary and to the surfaces of the scatterers. Thus the
Predicting effects of mixed impedance ground
237
derivative term of the unknown potential can be written in terms of the potential itself. Hence,
(8.9) The integral equation (8.9) has to be solved numerically through discretizing the boundary [14–18]. When discretizing the boundary surface, it is assumed that the unknown potential is constant in each element, thereby reducing the integral equation to a set of linear equations. One method involves using a quadrature technique (Simpson’s rule or Gauss) which is similar to a finite difference formulation. To minimize the number of elements, the Green’s function includes reflection from the flat impedance surface. Consider a 2-D problem with an infinitely long line source radiating cylindrical waves in the medium. In this case the boundary integral is a line integral and its evaluation by numerical means is a simple matter. In this case the Green’s function takes the form [14]
(8.10) with
(8.11) In these expressions H(1)( ) is the Hankel function of the first kind, r, r0 and are the receiver, source and image source position vectors respectively. The wavenumber k and the complex admittance β are dependent on the frequency. The function Pβ represents the ground wave term. The derivatives of the Green’s function in the x and z directions are also available [15]. 8.2.5 Data obtained over a single discontinuity There have been many laboratory measurements of propagation from a point source over a single impedance discontinuity [19–21]. Figure 8.7(a) and (b) illustrate the good
Predicting outdoor sound
238
Figure 8.7 Comparison of De Jong et al. model predictions with laboratory measurements over a single surface discontinuity between hardwood and sand. Source and receiver heights were 0.1 m and they were separated by 1 m. (a) Source over wood, discontinuity at 0.8 m from source (b) source over sand, discontinuity at 0.6 m from source.
Figure 8.8 Path lengths for propagation over an impedance strip. agreement obtained between predictions of the De Jong formula and data obtained using a small-scale geometry in the laboratory [20]. A ‘model’ discontinuous surface was composed of varnished hardwood board and 0.3 m deep sand contained within a box measuring 1.1 m×2 m×0.3 m. The box was placed in an anechoic chamber. The impedance of the continuous sand surface was derived from complex excess attenuation spectra by the root-finding method described in Chapter 4 and was shown in Figure 4.9. Figure 8.8 compares predictions of the De Jong model with data of the spectrum level due to a point source at 0.1 m height at a receiver at 0.1 m height and separated by 1 m. The predictions use the impedance for the sand deduced from the excess attenuation data over a continuous sand surface (see Figure 4.9) and assume that the hardwood board is acoustically hard. These laboratory data correspond to grazing angles of about 11°. Rasmussen [11] has compared predictions of the De Jong model and the numerical model described in section
Predicting effects of mixed impedance ground
239
5.2.2 with outdoor data taken under light wind conditions (<2 m s−1). The source height was 1 m, the receiver height was 0.1 m and their horizontal separation was 10 m. This corresponds to a grazing angle of about 5.7°. The agreement between predictions and data was good.
8.3 Propagation over impedance strips 8.3.1 Single absorbing strip Consider a single strip of absorbing material, impedance Z2 lying perpendicular to the line between source and receiver in a plane of less absorbing material with impedance Z1 (see Figure 8.8). The Boundary Integral Equation formulation developed in this way by ChandlerWilde and Hothersall [14] may be written as
(8.12) where
is the pressure at the receiver for a surface with homogeneous impedance are the positions vectors of the source, the receiver and a point in the boundary is the Green’s function associated with propagation over a boundary respectively, of impedance Z2 (see for example (8.11)) and S is the surface of the strip. The integral can be calculated numerically by a standard boundary element technique is known at point in the strip. If the source and receiver are once the pressure restricted to a vertical plane perpendicular to the impedance discontinuity, then the surface integral is replaced by a line integral which saves computation time. Hothersall and Harriott [10] have shown that it is straight-forward to apply the empirical model developed by De Jong to a single strip. Figure 8.8 defines the various path lengths needed in the expression of the acoustic pressure over a ground of impedance Z2 with a single strip of impedance Z1. 8.3.2 Multiple discontinuities It is straightforward to extend the model to multiple strips by summing over all the diffraction terms, each term arising from each impedance discontinuity [20]. The pressure at the receiver relative to the free field in the case of multiple strips of impedance Z1 imbedded in a plane of impedance Z2 is given by
Predicting outdoor sound
240
(8.13)
where j is the index characterizing the various strips and n is the total number of strips between source and receiver. In accordance with previous definitions, The spherical wave reflection coefficients Q1 or Q2 are used when the specular reflection point falls on the ground of impedance Z1 or Z2 respectively. The sequences of values (Q1,2, γj, δj) appear in (8.13) according to the following combinations: (Q2, 1, −1) if the specular reflection point is on the source side of the j-th strip, (Q2, −1, 1) if the specular reflection point is on the receiver side of the j-th strip, (Q1, −1, −1) if the specular reflection point is inside the j-th strip. However, comparisons with laboratory data [20] have shown that extension of the De Jong formula to multiple strips is not very successful. Nyberg [22] has solved the Helmholtz equation with the boundary condition for a point source above an infinite plane surface consisting of strips with alternating impedance by using Cartesian coordinates and a Fourier transform technique. The ground effect due to a two-valued, infinitely periodic (i.e. striped) impedance (see Figure 8.9), may be determined, approximately, from that predicted for a point source (see Chapter 2). Hence, the expression for the field at height z, due to a source at height z0, is
(8.14) and L0 is the where a, b are the periods of the two types of strips, usual integral for a point source (see Chapter 2) using the area-averaged admittance This (β0b+β1a)/(a+b). Also, α is the horizontal wavenumber and approximation requires
Predicting effects of mixed impedance ground
241
Figure 8.9 Magnitude of a surface admittance varying regularly between values of β0 and β1 with periods a and b respectively.
Figure 8.10 Predictions of excess attenuation due to the ground from a point source over ground containing a single discontinuity (solid lines), continuous impedance 1 (dotted lines),
Predicting outdoor sound
242
continuous impedance 2 (broken lines) and the area-averaged impedance (dot-dash lines) for receiver height 1.2 m, separation 25 m, distance to discontinuity 3.5 m and two source heights above impedance 1 (a) 0.5 m, (b) 0.1 m. The impedances are those predicted by the two-parameter model (3.13) with effective flow resistivities of 10,000 and 100 kPa s m−2 respectively (α=100 m−1). Figure 8.10 illustrates that use of the area-averaged impedance does not lead to good predictions in the case of a single discontinuity. Predictions of excess attenuation due to the ground using the De Jong formula are compared with those obtained with either continuous impedance and with the continuous averaged impedance for two geometries. 8.3.3 Comparison between predictions and laboratory data for impedance strips Laboratory measurements have been made with a broadband point source over the edge of a box measuring 1 m×0.8 m×0.08 m containing alternate wood and sand strips [17]. Figures 8.11 and 8.12 show the good agreement obtained between the predictions of Nyberg’s theory [22] and examples of these data.
Figure 8.11 Sound level relative to free field (solid line) obtained with a point source and receiver at 0.1 m height and 1 m apart over alternating wood and sand strips [20]. 8×0.1 m wide blocks of wood were separated by 0.025 m wide strips of sand. A sand strip was at the
Predicting effects of mixed impedance ground
243
specular reflection point. This corresponds to 80% hard surface cover. Predictions of the Nyberg theory (dash-dot line) have used the measured geometry and sand impedance (see Figure 4.9).
Figure 8.12 Sound level relative to free field obtained with a point source and receiver at 0.1 m height and 1 m apart over alternating wood and sand strips [20]. 5×0.1 m wide blocks of wood were separated by 0.125 m wide strips of sand with either wood (thick line) or sand (thin line) at the specular reflection point. These data correspond to 50% hard surface cover. Predictions of Nyberg’s theory (dash-dot line) used the measured geometry and sand impedance (Figure 4.9). The regular oscillations in these data may be due to the edges of the box containing the sand and the strips below the source and receiver. However, they might also be the consequence of multiple interferences between the strips. Recently it has been shown that similar oscillations occur in the excess attenuation above an acoustically hard surface containing randomly positioned semicylinders and that these are predicted by an accurate multiple-scattering theory [23]. It should be noted that the Nyberg theory does not predict any difference between the excess attenuation due to the ground for a hard or soft strip at the point of specular reflection. However, the data show a difference between these conditions (see Figure 8.12). The BEM formulation is extended easily to enable calculation of propagation over multiple strips and has been found to predict a different attenuation according to whether
Predicting outdoor sound
244
a hard or soft strip occupies the specular reflection point [20]. An example is shown in Figure 8.13.
Figure 8.13 Spectra of the sound levels relative to free field for a 60% hard-strip boundary with (a) a strip of wood at the specular reflection point and (b) a strip of sand at the specular reflection point. The dotted lines represent the measured data and the solid lines represent the boundary element predictions.
8.4 Effects of refraction above mixed impedance ground The Parabolic Equation (PE) method is a useful technique for incorporating both a refracting medium and range-dependent impedance. For example, Robertson et al. [24]
Predicting effects of mixed impedance ground
245
have used a PE routine to investigate low-frequency propagation over an impedance mismatch, and You and Yoon [25] have used a polar PE formulation to investigate the effect of road-grass verge discontinuity on sound field in a refracting medium. Berengier et al. [26] have used the PE method successfully to model propagation involving impedance variation, topography and wind speed gradients. Here we describe an extension of De Jong’s formulation to allow for a refraction and range-dependent impedance. To test the validity of the assumptions inherent in our heuristic extensions to the De Jong’s model to allow for refraction, predictions of the modified De Jong formulation are compared with an alternative numerical procedure based on the Boundary Integral Equation [27]. The predictions from the two methods, in the absence of turbulence, are compared at high and low frequencies. Equation (8.2) can be extended to allow for atmospheric refraction using ideas of geometrical optics. In downwind or temperature inversion conditions, there may be multiple ray arrivals and rays may have multiple reflections from the ground. The second term in (8.2) becomes a sum over all rays with Qa,b replaced by
(8.15) where l is the number of the bounces the ray makes at the region a and m is the number of bounces in region b. There will be more than one diffracted ray path from the source to the point of discontinuity and then to the receiver. In general, if the numbers of ray paths from source to the discontinuity and from the discontinuity to the receiver are m and l respectively, then the total number of diffracted ray paths is m×l. Since there is more than one R3, the term inside the brackets that includes the Fresnel function should also be replaced by a sum over all possible R3’s. Furthermore, the term under the square root in the argument of the Fresnel function can now have negative value, but this is unrealistic. To avoid this we revert to the original expression by Pierce [9] and introduce a modulus function. The expression for the total field becomes
(8.16)
In this expression Rn are sound ray trajectories from source to the receiver with n=1 taken as the direct ray path and M, the total number of possible ray paths, is equal to m×l. The parameters, µ1,j and µ2,j are the polar angles of the incident and diffracted wave at the point of discontinuity for any Rd respectively and sgn(x) is the sign function. Its value
Predicting outdoor sound
246
is −1 for a negative x and +1 otherwise. The evaluation of Rd,j requires computation of all possible combinations of ray trajectories from the source to the point of discontinuity at the ground plus trajectories from the point of discontinuity to the receiver. This will involve multiple values of Rd in the downwind case. In the presence of a positive gradient, caused by a temperature inversion or downwind, the rays that go through n reflections on the ground can be determined from the following quartic equation:
(8.17)
where
(8.18) and x is the distance from the source to the first reflection from the ground. Only real roots of the equation are to be considered. This equation is to be solved for all n until no real solutions exist. A more useful parameter is the angle of incidence of any particular ray. This is given in terms of x by
(8.19) where x is determined from (8.18). All other ray parameters can easily be determined from this angle. We define three terms:
(8.20)
(8.21)
(8.22)
Predicting effects of mixed impedance ground
247
where
(8.23) These are the horizontal distances from the source, receiver or the point of reflection at the ground, to the turning point of the ray path. The angle µi is the
Figure 8.14 Definitions of the terms used to describe a ray path for the extended De Jong model. polar angle (the angle that the tangent to the ray makes with the positive z-axis) of the ray at the source or receiver position. These distances and angles are shown in Figure 8.14. Once the angle of incidence for a particular ray is known, the phase and amplitude of each ray can be evaluated. There are four cases that can be distinguished. 1 Range=T1+T2+T3
(8.24) and
(8.25) 2 Range=T1+T2−T3
Predicting outdoor sound
248
(8.26) and
(8.27) 3 Range=T1−T2+T3
(8.28) and
(8.29) 4 Range=T1−T2−T3
(8.30) and
(8.31) The geometrical path length, Rg, of the ray is simply the arc length of the ray path and can be determined by the integral
(8.32) where µ1 and µ2 are the polar angles of the beginning and the end points respectively and Rc is the radius of curvature of the ray. Rg determines the amplitude along the ray. The
Predicting effects of mixed impedance ground
249
phase of the ray is determined by its acoustic path length, Ra. This takes into account the change of the speed of sound along the ray path and is given by
(8.33) It is important to note that for n>0 more than one option may be valid. In fact for n=1 there may be one or three rays present, and for each n>1 there may be two or four rays up to a maximum value of n depending on the gradient and the range. Figure 8.15(a) and (b) compare the predictions of the extended De Jong model (8.16) and numerical hybrid BIE/FFP code [24] in a downward-refracting condition corresponding to a positive wind speed gradient of 0.25 m s−1 m−1 over an impedance discontinuity at frequencies of 200 Hz and 1 kHz. Source and receiver are assumed at 5 m height. For Figure 8.14(a), the discontinuity is 200 m from the source and the ground is assumed acoustically hard from the source to the discontinuity and absorbing thereafter. At the higher frequency, the hard section extends only up to 100 m. While the two models agree well at 1 kHz up to 300 m range, the performance of the extended De Jong model is not as good at the lower frequency.
Figure 8.15 (a) Predictions, obtained by using the extended De Jong model (broken line) and the BIE/FFP (solid line) at a frequency of 200 Hz, of the sound field in a downwind condition over an impedance discontinuity at 200 m. The source and receiver heights are 5 m. (b) As for (a) but at a frequency of 1000 Hz and with the impedance jump at only 100 m from the source.
8.5 Predicted effects of porous sleepers and slab-track on railway noise
Predicting outdoor sound
250
8.5 Predicted effects of porous sleepers and slab-track on railway noise As a consequence of noise mapping of major railways in accordance with the European Directive on Environmental Noise (Commission of the European Communities 2002), it is likely that additional noise mitigation will be required. Methods for controlling railway noise that have been explored include barriers, cuttings and tunnels. Less attention has been paid to options relating to track design. These options include optimizing the characteristics and deployment of railway ballast and the introduction of porous sound absorption into sleeper and track materials. Such options will be particularly important in respect of wheel/rail noise. Here we present the results of a brief study using a boundary element code to predict the likely effects on wheel/rail noise of introducing porous sleepers and using porous concrete on slab track [28]. Figure 8.16 shows the track profile assumed for considering the effect of sleepers. This profile includes two tracks, a Cess walkway and a cable trough. The walkway and cable trough are assumed to be acoustically hard. The edges on either side of the railway track are assumed to be flat and grass covered. The track consists of areas of ballast and sleepers, that is a mixed impedance situation in respect of ground effect. The receiver height is assumed to be 1.5 m above the grass surface and the horizontal source/receiver range is denoted by di where i=1 to 4 corresponding to each of the four rails. The assumed values of di are d1=28.3 m, d2=26.9 m, d3=24.9 m and d4=23.5 m. In the BEM used for this study, the rail/wheel excitation is modelled by a coherent line of monopole sources, that is monopole sources in the vertical plane perpendicular to
Figure 8.16 Assumed railway track profile. the track. If Cartesian coordinates Oxy are adopted, with the y-axis vertically upwards, the boundary (ground surface and track) lies entirely on or above the line y=0. For some of the calculations reported here, the boundary is assumed locally reacting and β(rs) is used to denote the surface admittance relative to air at a point rs=(xs, ys) on the boundary. It is also assumed that β(rs)=βc, some constant value, at points on the boundary sufficiently far from the tracks. The numerical procedure treats the above problem as a perturbation of the case in which the boundary is coincident with the line y=0 and β=βc. In this simple case the propagation problem can be solved exactly. Let Gβc(r, r0) denote the Green’s function for this problem, that is Gβc(r, r0) denotes the acoustic pressure at r when a unit strength monopole source is located at r0 above a flat homogeneous plane of admittance βc. The boundary element method is a numerical method applied to the reformulation of the Helmholtz equation as a boundary integral equation. In this study the integral equation employed is
Predicting effects of mixed impedance ground
251
(8.34) γ denotes those parts of the boundary on which β≠βc or which lie above the line y=0. Equation (8.34) holds for points r=(x, y) on or above the boundary, where k is the wavenumber, p(r) denotes the pressure at r and p0(r) the pressure that would be measured if the boundary were flat, coinciding with the line y=0, and had constant admittance βc. For points r=(x, y) on the boundary, ε(r)=Ω(r)/(2π) if y>0 or Ω(r)/π if y=0, where Ω(r) is the corner angle at r(=π if r is not a corner). ε(r)=1 at points above the boundary. Equation (8.34) is solved by the piecewise constant collocation boundary element method [29, 30]. In this study, two monopole sources are assumed on each track, that is four sources altogether. The sources are located close to the wheel rail interfaces, that is 0.05 m above the top of the 0.171 m high rails. A separate simulation is made for each source position and the resulting predicted noise levels are added logarithmically in pairs, assuming that the sources are incoherent. The sources on the track furthest from the receiver give rise to the highest predicted sound reductions. This is a consequence of the fact that, for the nearer track sources, the Fresnel zone for sound interaction with the ground falls largely on the (assumed) grass edge and the acoustical properties of the track area play a lesser role in the overall sound attenuation. BEM-predicted A-weighted SPL spectra in vertical planes through either acoustically hard sleepers or porous concrete sleepers (red and blue broken lines respectively) with simultaneous sources at positions (1) and (2) on the further track are compared in Figure 8.17. The reference source spectrum used is that shown in Figure 8.18. Sleepers made of porous concrete mix 1 are predicted to give greater sound reduction than the reference case (in which sleepers are assumed to be acoustically hard) below 1500 Hz. Also shown are predictions in a vertical plane through ballast only (black diamonds). The parameters assumed for predicting the acoustical properties of ballast and porous concrete are listed in Table 8.1. The acoustical properties have been predicted by means of the Johnson-AllardUmnova model [31] (see also (3.15) and (3.16)). According to the latter model, the dynamic (complex) tortuosity α(ω) may be approximated by
(8.35)
Predicting outdoor sound
252
Figure 8.17 BEM-predicted A-weighted SPL spectra for sources at positions (1) and (2) in the assumed railway profile (see Figure 8.16) for hard, soft and absent sleepers.
Figure 8.18 Idealized ‘slabtrack’ railway profile, source/receiver geometry and the discretizations used for BEM calculations.
Predicting effects of mixed impedance ground
253
Table 8.1 Parameter values assumed for railway ballast and porous concrete Material Ballast Porous concrete mix 1 Porous concrete mix 2
Porosity Tortuosity
Flow resistivity (Nsm−4)
Viscous characteristic length
200 3.619
0.491 0.3
1.3 1.8
0.01 2.2×10⁻⁴
120
0.3
2
2.2×10⁻⁴
where ω is the angular frequency, A is the characteristic viscous length, η is the coefficient of dynamic viscosity and ρ0 the density for air. The dynamic compressibility C(ω) is assumed to be that deduced for stacked spheres (see (3.17–3.19)). Hence
(8.36) where Θ≈0.675(1−Ω). The impedance is given by
(8.37)
It should be noted that the flow resistivity of railway ballast is sufficiently low that it is externally reacting and the acoustic surface impedance depends on the angle of incidence. Another consequence of the low flow resistivity is that the surface impedance depends on the depth of the ballast even when this is of the order of 0.5 m. A thickness l=0.3 m has been assumed here. The angle-dependence of the relative surface impedance of a hardbacked ballast layer has been computed from
(8.38)
where k0 is the propagation constant in air, l is the layer depth, ρ0, ρ1 are the (real) density of air and (complex) density of the porous material respectively and θ is the incidence angle measured from the normal to the surface. The ballast impedance has been evaluated for each boundary element length of the ballast sections in the discretized version of the profiled track. The incidence angle has been defined as that between the line from the source to the middle of the boundary
Predicting outdoor sound
254
element segment and the normal to the segment. Where, as a consequence of the assumed track profile, the normal to the segment and the straight line to the source are separated by more than 90°, the incidence angle has been set to 90°. The grassland is assumed to have the impedance of an infinitely thick homogeneous porous layer predicted by a fourparameter model (see Chapter 3) using the values shown in Table 8.2. These values are consistent with those used by Morgan et al. [32]. The predictions for a 2-D cross-section through ballast only show the greatest attenuation at low frequencies. Predictions of the broadband SPL, obtained from a logarithmic summation of the narrow-band values in the SPL spectra, for simultaneous sources (1) and (2), show that in the vertical plane through the sleepers (assumed infinitely long), a 3 dB reduction of overall A-weighted SPL is predicted if acoustically hard sleepers are replaced by porous concrete sleepers. Since the BEM allows only 2-D calculations, that is in a vertical plane, the 3-D effects of ballast between the sleepers have been ignored. One way of adjusting for the presence of ballast between the sleepers along the track axis is to calculate an energy equivalent continuous level over a ‘ballast plus sleeper period’ assuming a constant velocity source. It is possible then to compute the energy equivalent level from the sum of the energies (i.e. squared pressures) weighted according to the width of the sleeper and the width of the ballast between the sleepers. The results of this ‘time-average’ approach for sources on the further rail from the receiver are shown in Table 8.3 (to nearest 0.5 dB). Figure 8.18 shows the track profile assumed for predicting the effect of using porous concrete instead of sealed concrete for slab track. The two rail beds Table 8.2 Parameter values used to predict the grass impedance Flow resistivity σ (Nsm−4)
Porosity (Ω)
Tortuosity q Pore shape factor sp
125,000
0.50
1.67
0.5
Table 8.3 BEM-predicted A-weighted broadband SPL for simultaneous sources (1) and (2) computed from ‘timeaveraged’ levels A-weighted Leq (dB)
Porous concrete sleepers
Reference hard sleepers
56.5
58
Predicting effects of mixed impedance ground
255
Figure 8.19 BEM-predicted A-weighted SPL spectra over continuous slab tracks with grass edges for sources at positions (1) and (2). are assumed to be either continuous porous concrete slab track, or continuous acoustically hard (non-porous) concrete. BEM-predicted A-weighted SPL spectra for vertical planes through porous concrete mixes 1 and 2 and for hard slab (joined squares, joined circles and joined stars respectively) with simultaneous sources at positions (1) and (2) on the further track are shown in Figure 8.19. Also shown is the reference A-weighted spectrum (joined diamonds), that is the SPL measured at 1 m, for a train running at a speed of 145 km h−1. These results assume spherical spreading from ‘point’ source rail/wheel contacts. If cylindrical spreading were to be assumed instead, then all of the predictions would be shifted to higher levels. The predicted effects of porous concrete are to reduce the A-weighted sound level above 200 Hz, compared with acoustically hard slab track. The predicted difference between hard and porous slab track is nearly 8 dB at 2 kHz. Porous concrete mix 1 is predicted to give greater sound reduction than mix 2 below 1000 Hz. The difference between the predicted A-weighted levels for the two mixes is nearly 5 dB between 50 and 500 Hz for simultaneous sources at positions (1) and (2), that is on the further track.
Predicting outdoor sound
256
Table 8.4 Predicted overall A-weighted levels for source spectrum shown in Figure 8.19 and the track profile shown in Figure 8.18 Mix 1
Mix 2
Hard slab track
Sources (1) and (2) 59 Sources (3) and (4) 63
59 63
65 67
Despite the superior performance predicted for mix 1 at low frequencies, the predicted reductions in the overall A-weighted level compared with an acoustically hard track for both porous concrete mixes are identical for the assumed reference source spectrum. The predicted reductions in the overall A-weighted levels are summarized in Table 8.4. Even for the nearest rail, the predicted reduction due to replacing non-porous by porous slab track is significant.
References 1 ISO9613–2 Acoustics—attenuation of sound during propagation outdoors—part 2: a general method of calculation (1996). 2 The calculation of road traffic noise, Department of Environment HMSO (1985). 3 K.J.Marsh, The CONCAWE model for calculating the propagation of noise from open-air industrial plants, Appl. Acoust., 15:411–428 (1982). 4 B.O.Enflo and P.H.Enflo, Sound wave propagation from a point source over a homogeneous surface and over a surface with an impedance discontinuity, J. Acoust. Soc. Am., 82:2123–2134 (1987). 5 J.Durnin and H.Bertoni, Acoustic propagation over ground having inhomogeneous surface impedance, J. Acoust. Soc. Am., 70:852–859 (1981). 6 P.Koers, Diffraction by an absorbing barrier or by an impedance transition, Proc. Internoise, 311–314 (1983). 7 B.A.De Jong, A.Moerkerken and J.D.Van Der Toorn, Propagation of sound over grassland and over an earth barrier, J. Sound Vib., 86:23–46 (1983). 8 A.D.Pierce, Diffraction of sound around corners and over wide barriers, J. Acoust. Soc. Am., 55(5):941–955 (1974). 9 G.A.Daigle, J.Nicolas and J.-L.Berry, Propagation of noise above ground having an impedance discontinuity, J. Acoust. Soc. Am., 77:127–138 (1985). 10 D.C.Hothersall and J.N.B.Harriott, Approximate models for sound propagation above multiimpedance plane boundaries, J. Acoust. Soc. Am., 97:918–926 (1995). 11 K.B.Rasmussen, Propagation of road traffic noise over level terrain, J. Sound Vib., 82 (1):51–61 (1982). 12 J.Forssen, Calculation of noise barrier performance in a turbulent atmosphere by using substitute-sources above the barrier, Acust. Acta Acust., 86:269–275 (2000). 13 S.Slutsky and H.L.Bertoni, Analysis and programs for assessment of absorptive and tilted parallel barriers, Transportation Research Record 1176, Transportation Research Record, National Research Council, Washington, DC, 13–22 (1987). 14 S.N.Chandler-Wilde and D.C.Hothersall, Sound propagation above an inhomogeneous impedance plane, J. Sound Vib., 98:415–491 (1985).
Predicting effects of mixed impedance ground
257
15 S.N.Chandler-Wilde, Ground Effects in Environmental Sound Propagation, PhD Thesis, University of Bradford (1988). 16 R.P.Shaw, Boundary integral equation methods applied to wave problems, in Developments in Boundary Element Methods-1, Eds, P.K.Banerjee and R.Butterfield, Applied Science Publishers, London (1980). 17 D.F.Mayers, Quadrature methods for fredholm equations of the second kind, in Numerical Solution of Integral Equations, Eds, L.M.Delves and J.Walsh, Clarendon Press, Oxford (1974). 18 D.C.Hothersall and S.N.Chandler-Wilde, Prediction of L10 noise levels from road traffic: distance corrections for inhomogeneous ground cover, Acust. Acta Acust., 10(2):509–514 (1988). 19 C.Klein, Kritische studie van het geluidsveld, opgewekt door een monopool, in de nabijheid van een reflekterend oppervlak, PhD Dissertation, Catholic University of Leuven (1983). 20 P.Boulanger, T.Waters-Fuller, K.Attenborough and K.M.Li, Models and measurements of sound propagation from a point source over mixed impedance ground, J. Acoust. Soc. Am., 102(3):1432–1442 (1997). 21 M.R.Bassiouni, C.R.Minassian and B.Chang, Prediction and experimental verification of far field sound propagation over varying ground surfaces, Proc. Internoise, 287–290 (1983). 22 C.Nyberg, The sound field from a point source above a striped impedance boundary, Acta Acust., 3:315–322 (1995). 23 P.Boulanger, K.Attenborough, Q.Qin and C.M.Linton, Reflection of sound from random distributions of semi-cylinders on a hard plane: models and data, J. Phys. D., 38:3480–3490 (2005). 24 J.S.Robertson, P.J.Schlatter and W.L.Siegmann, Sound propagation over impedance discontinuities with the parabolic approximation, J. Acoust. Soc. Am., 99:761–767 (1996). 25 C.S.You and S.W.Yoon, Predictions of traffic noise propagation over a curved road having an impedance discontinuity with refracting atmospheres, J. Korean Phys. Soc., 29(2):176–181 (1996). 26 M.C.Bérengier, B.Gauvreau, Ph. Blanc-Benon and D.Juvé, Outdoor sound propagation: a short review on analytical and numerical approaches, Acta Acust., 89:980–991 (2003). 27 S.Taherzadeh, K.M.Li and K.Attenborough, A hybrid BIE/FFP scheme for predicting barrier efficiency outdoors, J. Acoust. Soc. Am., 110(2):918–924 (2001). 28 K.Attenborough, P.Boulanger, Q.Qin and R.Jones, Predicted influence of ballast and porous concrete in railway noise, Proc. InterNoise 2005, Rio de Janeiro, Paper IN05_1583. 29 O.Umnova, K.Attenborough, E.Standley and A.Cummings, Behavior of rigid-porous layers at high levels of continuous acoustic excitation: theory and experiment, J. Acoust. Soc. Am., 114(3):1346–1356 (2003). 30 S.N.Chandler-Wilde and D.C.Hothersall, Efficient calculation of the Green’s function for acoustic propagation above a homogeneous impedance plane, J. Sound Vib., 180: 705–724 (1995). 31 D.C.Hothersall, S.N.Chandler-Wilde and N.M.Hajmiraze, Efficiency of single noise barriers, J. Sound Vib., 146:303–322 (1991). 32 P.A.Morgan and G.R.Watts, Investigation of the screening performance of low novel railway noise barriers. Unpublished project report, TRL, PR SE/705/03 (2003).
Chapter 9 Predicting the performance of outdoor noise barriers 9.1 Introduction Noise reduction by barriers is a popular method for mitigating the effects of noise from transportation. Near a highway, railway or airport, the receiver can be shielded by a barrier, which intercepts the line-of-sight from the noise source. As long as the direct transmission of sound through the barrier is negligible, the acoustic field in the shadow region is mainly dominated by the sound diffracted around the barrier. The many different types of barriers include a ‘normal’ straight-edge barrier, a top-bended or ‘cranked’ barrier, an inclined barrier, a louvre barrier and a barrier with multiple edges. To design noise barriers with optimum acoustic performance, it is important to have accurate prediction schemes for calculating the sound reduction by barriers. The aims of this chapter are 1 to introduce the basic principles of the diffraction of sound by noise barriers and identify the important parameters, 2 to discuss both analytical and empirical models for studying the acoustic performance of noise barriers, 3 to determine the degradation of performance due to presence of gaps in barriers, 4 to explore the effectiveness of a barrier in screening a directional source and 5 to investigate the consequences of assuming a fixed source spectrum when calculating the performance of noise control elements such as barriers.
9.2 Analytical solutions for the diffraction of sound by a barrier Since the diffraction of spherical, cylindrical or plane waves by a thin half plane is of interest in optics as well as in acoustics, it has been studied, experimentally and theoretically, since the eighteenth century. In the optical context, it was suggested that the diffraction pattern behind a half plane is the result of the superposition of waves scattered by the edge and the unobstructed portion of the incident waves. The first mathematically rigorous solution of a half-plane diffraction problem was formulated in 1896 by Sommerfeld who considered the two-dimensional problem of a plane wave incident on a thin, perfectly reflecting, half plane and solved the corresponding partial differential equations [1, 2]. The resulting solutions are composed of two main terms. The first term is the direct wave and is expressed exactly according to the principles of geometrical acoustics. The second term, which is identified as the contribution of the diffracted wave, is expressed in terms of Fresnel integrals. Subsequently, Carslaw [3, 4] and MacDonald
Predicting the performace of outdoor noise barriers
259
[5] extended Sommerfeld’s approach to the generalized problems of the diffraction of cylindrical and spherical incident waves by wedges. In a similar manner to Sommerfeld’s solution, their solutions are expressed as the sum of two integrals, associated with the incident and scattered (diffracted) fields respectively. An alternative to seeking a formal solution for the governing partial differential equations that arise when solving diffraction problems directly is an integral formulation. Copson [6] and Levine and Schwinger [7a, b] have used this approach to diffraction problems and obtained exact solutions by applying the Wiener-Hopf method, which is a standard technique for solving certain types of linear partial differential equations subject to mixed boundary conditions and involving semi-infinite geometries [8, 9]. Tolstoy [10, 11] has obtained an alternative exact and explicit solution for sound waves diffracted by wedges. In his solution, the diffracted sound field can be represented by a sum of an infinite series. The coefficient of each term of the series is given by a set of linear equations which can be solved by a simple recursion scheme. The edge diffractions are taken into account exactly without the need for an asymptotic approximation of integrals. However, the practical application of this formulation is limited by the slow convergence of the series particularly at high frequencies. 9.2.1 Formulation of the problem As described earlier, there are many different models for calculating the diffraction of sound by a thin plane. For the moment, putting aside the mathematical complexity of the analytical solution, we consider simply the geometrical configuration of the problem. It is convenient to use a cylindrical polar coordinate system to describe the relative position of source and receiver from the edge of a thin plane. Let the origin be located at the edge and (r, θ, y) be the cylindrical polar coordinates. The y-axis coincides with the edge of the semi-infinite half plane and the initial line of the polar coordinates lies on the right-hand surface of the half plane. Hence, the thin plane is made of two surfaces at θ=0 (right surface) and θ=2π (left surface) with zero thickness and it has an exterior angle of 2π. With this coordinate system, all radial distances are measured from the edge and all angular positions are measured in the counter clockwise direction as shown in Figure 9.1.
Predicting outdoor sound
260
Figure 9.1 Diffraction of sound by a semiinfinite thin plane. Without loss of generality, a point source is placed in front of the left surface of the thin plane at (r0, θ0, y0), that is 2π≥θ0≥π and the receiver is located at (rr, θr, yr) where 2π≥θr≥0. Using the principle of geometrical acoustics, the sound field consists of a diffracted field, pd and a geometrical solution that combines the incident and reflected waves, pi and pr. The dashed lines at θ=3π−θ0 and θ=θ0−π in Figure 9.1, subdivide the field into three separate regions, I, II and III. The ray that strikes the top edge of barrier reflects back along the path represented by a broken line, θ=3π−θ0. According to the geometrical acoustics, none of the reflected rays can penetrate region II and III and they are confined to region I. The dividing line at θ= 3π−θ0 separates region I from region II and creates a shadow boundary Br for the reflected wave. Similarly, the direct wave cannot penetrate region III because of the presence of the thin plane preventing direct line-of-sight contact between source and receiver. Region III is called the shadow zone. The dividing line at θ=θ0−π separates region II from region III and it is called the shadow boundary, Bi, for the direct wave. If the source faces the right-hand side of the thin plane, then there is a wave reflected on the θ=0 face. The occurrence of each wave type can be summarized as follows: 1 a direct wave where π−|θr−θ0|≥0; 2 a wave reflected from the θ=0 face when π−(θr+θ0)≥0; 3 a wave reflected from the θ=2π face when (θr+θ0)−3π≥0 and 4 a diffracted wave from edge of plane when 0≤θ0, θr≤2π.
Predicting the performace of outdoor noise barriers
261
Items (2) and (3) mentioned earlier are mutually exclusive as the source cannot ‘see’ both surfaces of the half plane simultaneously. The analytical solution for the total sound field in the vicinity of a semi-infinite half plane can be decomposed into three terms. The first term takes account of the contribution of a direct wave, pi, the second term accounts for the contribution of a reflected wave from the surface of the semi-infinite half plane, pr and the last term deals with the contribution of the diffracted wave at the edge of the half plane, pd. Except the diffracted wave term, the occurrence of the direct and reflected wave terms depends very much on the relative position of source, receiver and the thin plane. In each region, the total sound field, pT, is Region I: pT=pi+pr+pd; (9.1a) Region II: pT=pi+pd; and (9.1b) Region III: pT=pd. (9.1c) In the following sections, we shall discuss two popular solutions that have been frequently used to calculate the diffracted wave term. Nevertheless, it should be noted that the diffracted sound field may be treated as having two components which are associated with the direct and reflected fields, pdi and pdr respectively. The geometrical solution becomes discontinuous at the shadow boundary of the reflected wave because the reflected wave term vanishes in region II. However, the associated component of the diffracted wave for the reflected fields pdr also becomes discontinuous on crossing the shadow boundary of the reflected wave. As a result, the total sound field remains continuous. Similarly, the geometrical solution at the shadow boundary of the direct wave becomes discontinuous due to the absence of the direct wave term but the diffraction solution associated with the direct field pdi becomes discontinuous also and that leads to a continuous solution throughout. 9.2.2 The MacDonald solution Consider the sound field due to a point monopole source which is placed near to a rigid half plane. The source has unit strength and the time-dependent factor, e−iωt, is omitted for simplicity. Using the cylindrical polar coordinate system described in the last section such that the distance from the source and its image (see Figure 9.2) to the receiver, R1 and R2, can be determined according to
(9.2a)
Predicting outdoor sound
262
and
(9.2b)
Figure 9.2 The geometry of source, image source and receiver in the proximity of a semiinfinite plane. We can also determine the shortest distance from the source (or image source) to receiver after diffraction from the half plane, that is the shortest source-edge-receiver path as
(9.3) Following Sommerfeld [1], MacDonald [5] developed a solution in a spherical polar coordinate system. This was subsequently recast in the cylindrical polar system by Bowman and Senior [12] to give the total field as a sum of two contour integrals as follows:
Predicting the performace of outdoor noise barriers
263
(9.4) where k is the wavenumber of the incident wave and is the Hankel function of the first kind. The limits of the contour integrals are determined according to
(9.5a) and
(9.5b) where sgn(u), the sign function, takes the value of +1 or −1 depending on the sign of the argument. Note that both terms in (9.4) contain integrals that are related to the integral representation of spherical wave where
(9.6)
The integrals solution of (9.4) can be spilt into two parts: a geometrical and diffraction contribution. The total sound field in regions I, II and III can be expressed in the form given in (9.1a–c) with the direct wave, reflected wave and diffracted wave determined respectively by
(9.7a)
(9.7b)
and
Predicting outdoor sound
264
(9.7c) A limiting case that should be checked is the high-frequency limit, for which k→∞. Both |ς1| and |ς2| tend to infinity in this limit. Hence, the diffraction integrals in (9.7c) become negligibly small and the geometrical solution is recovered as it should. Another limiting case of interest is the situation where the source or the receiver (or both) are close to the and where R′ is defined by edge of the half plane such that (9.3c). We can expand the integrands by means of Taylor series and integrate the resulting expression to yield an approximate solution for the total pressure as
(9.8) The last case is when both the source and receiver are far from the edge and the shadow MacDonald [5] derived an asymptotic solution for this case in boundaries, that is which the contribution from the diffracted wave can be written in terms of Fresnel integrals as follows:
(9.9) The function G(u) is defined as
(9.10a) where
Fr(u)=C(u)+iS(u), (9.10b) and the Fresnel integrals C(u) and S(u) are defined [13] by
(9.11a)
Predicting the performace of outdoor noise barriers
265
and
(9.11b) The corresponding Fresnel numbers of the source and image source are denoted, respectively, by N1 and N2. They are defined as follows:
(9.12a) and (9.12b) If the Fresnel numbers are sufficiently large the asymptotic expansions for the Fresnel integrals can be used in (9.9) to yield an approximate solution for the diffracted sound:
(9.13) The approximation in (9.13) is invalid at the shadow boundaries. In this case, the exact integral representation of the total field (cf. (9.4)) should be used instead. Thus, the total sound field at the shadow boundary of the reflected wave is
(9.14)
When the receiver is located at the shadow boundary of the direct wave, the solution becomes
(9.15)
Predicting outdoor sound
266
9.2.3 The Hadden and Pierce solution for a wedge The last section considered the diffraction of sound by a thin half plane. Now we investigate the sound diffraction around wedges for arbitrary source and receiver locations. An accurate integral representation of the diffracted wave from a semi-infinite wedge has been given by Hadden and Pierce [13]. Consider the geometrical configuration of the problem in Figure 9.3. We are interested in studying the diffraction
Figure 9.3 Diffraction of a spherical sound wave by a wedge. field of a wedge with an exterior angle of In a similar fashion to diffraction by a thin screen, the solution is composed of a geometrical solution of a direct wave term, a wave reflected from the right face of the wedge and a wave reflected from the left face. The direct wave is zero unless the receiver can ‘see’ the source. There are no contributions from the reflected waves unless one can construct specularly reflected waves from either faces of the wedge. In addition to the geometrical solutions, the total field consists of a diffracted wave which can be decomposed into four terms:
Predicting the performace of outdoor noise barriers
267
(9.16)
where ς1=|θr−θ0| (9.17a)
(9.17b) ς3=θr+θ0 (9.17c)
(9.17d) Each of the diffracted wave terms correspond to the sound paths between the source S0, the receiver R0 and its image in the barrier that is paths its image in the barrier and for the wedge shown in Figure 9.4. For each path the diffracted field V(ςi) can be calculated from
(9.18a)
where
(9.18b)
(9.18c)
(9.18d)
Predicting outdoor sound
268
Figure 9.4 Source, image source, receiver and image receiver for a wedge.
(9.18e)
(9.18f) and R′, the shortest diffraction path from source to receiver, is given in (9.3c). In (9.18b), the function H(u) is the Heaviside step function which is 1 for positive argument and zero otherwise. The parameter υ is the wedge index with υ=1/2 for a thin screen and υ=2/3 for a right-angle wedge. The diffracted field can be computed readily, using (9.18a–f), as the integral is dominated by the e−y factor, the rest of the integrand is non-oscillatory and its magnitude is bounded by unity. The formulation allows one to evaluate the sound fields for arbitrary point source locations in the vicinity of a rigid wedge. This accurate representation of the sound field has been shown to agree well with experiment. Unlike the MacDonald solution, the formulation allows for reflections of the source and receiver on the faces of the barrier (wedge). As a result, it is possible to consider the effect of barrier surfaces with finite impedance by incorporating appropriate spherical wave reflection coefficient(s) for the paths from the image sources. However, instead of pursuing this idea here, we explore a special case for a thin screen with either the source or receiver located at a distance a few wavelengths from the edge of the screen such that the wedge remains finite. In such a case, index, υ=1/2 and the length ratio the integral given in (9.18c) can be simplified and expressed in terms of Fresnel integrals. Furthermore, the four diffraction terms can be grouped leading to the compact formula,
Predicting the performace of outdoor noise barriers
269
(9.19a)
where
X+=X(θ0+θr), (9.19b) X−=X(θ−θ0), (9.19c)
(9.19d) AD(X)=sgn(X)[f(|X|)−ig(|X|)]. (9.19e) The function AD(X) is known as the diffraction integral that can expressed in terms of the auxiliary Fresnel integrals f(X) and g(X) given by
(9.20a) and
(9.20b) The Fresnel integrals C(X) and S(X) are defined in (9.11 a) and (9.11b) respectively. Note that the first and fourth terms (with i=1 and 4) in (9.16) are combined to give the term AD(X−) in (9.19a). On the other hand, the second and the third terms in (9.16) are grouped to yield the term AD(X+). Figure 9.5 shows a comparison of the two exact solutions with experimental data. The insertion loss (IL) of the screen (sometimes known as the attenuation, Att), defined by
(9.21)
Predicting outdoor sound
270
where pw and pw/o are the total sound fields with or without the barrier, is used often to assess the acoustic performance.
Figure 9.5 Comparison of predictions of the MacDonald solution and Hadden and Pierce formulation with laboratory data. The insertion loss of the thin half plane is plotted against the Fresnel number, N1. 9.2.4 Approximate analytical formulation Many approximate analytical solutions for diffraction by a half plane include the physical interpretation of diffraction suggested by Young and Fresnel. The most common one, the Fresnel-Kirchhoff approximation, is a mathematical representation of the HuygensFresnel principle and is widely used in optics. The wavelengths of optical light are always smaller than obstacles, such as screens. However, the Fresnel-Kirchhoff approximation represents a high-frequency approximation in acoustics. It results from solving the Helmholtz equation with the aid of Green’s theorem. The sound field behind a screen is expressed as the surface integral over the open aperture above the screen. Alternatively, by applying Babinet’s principle, the same result can be obtained if the surface integral is performed on the barrier surface. The details of Young’s and Fresnel’s studies and the Fresnel-Kirchhoff approximation can be found in various textbooks by Hecht [14] and Born and Wolf [2]. Skudrzyk [15] transformed Kirchhoff’s solution to a new diffraction formula, which is now known as Rubinowics-Young formula. He intended to investigate waves diffracted
Predicting the performace of outdoor noise barriers
271
by a screen containing an aperture. The diffracted field was expressed as a line integral along the aperture edge instead of a surface integral as stated in the Kirchhoff’s solution. In addition, Rubinowics was able to show that the Kirchhoff solution for plane or spherical incident waves can be decomposed into two portions: the unobstructed portion of incident wave and the edge-scattered wave. Embleton [16] derived a formula for sound diffracted by a two-dimensional barrier based on the Rubinowics-Young formula. In his studies, Embleton assumed that the line integral was along the edge of the barrier and a semi-circular arc at infinity that connects the two ends of the barrier edge. Embleton’s formula is convenient for numerical implementation because the integration variable is reduced to one dimension only. In this section, we present the Fresnel-Kirchoff approximation scheme only. Consider the configuration shown in Figure 9.6. The dashed line represents an infinite plane surface between the source and receiver. Again, the time-dependent factor e−iωt is understood and suppressed throughout. According to the Fresnel-Kirchoff diffraction formula [2], the sound pressure at the receiver can be written as
(9.22) where the integral is to be evaluated over a surface Γ of infinite extent. The variables d0 and dr are the distances from a point on the surface Γ to the source and to the receiver respectively. The angles and are defined in Figure 9.6. Of course, the integral of (9.22) can be evaluated exactly to yield the free field sound pressure as Suppose that a semi-infinite thin screen is interposed between the source and receiver as shown in Figure 9.7. The screen is represented by the surface Γ2 and the ‘aperture’ is represented by the surface Γ1.
(9.23)
Predicting outdoor sound
272
Figure 9.6 Geometry and notation used for the Fresnel-Kirchhoff approximation for the sound field with a transparent screen in front of a source.
Figure 9.7 Geometry and notation used for the Fresnel-Kirchhoff approximation for the sound field with an aperture above a rigid screen.
Predicting the performace of outdoor noise barriers
273
The advantage of adopting (9.22) to calculate the sound field is that the effect of a screen can be modelled by assuming that there is no contribution to the pressure at the receiver point from areas of the surface corresponding to the screen. Thus for the situation in Figure 9.7, the pressure at the receiver can be calculated approximately from
(9.24) Invoking the Fresnel-Kirchoff diffraction integral for an approximate solution, we implicitly assume that the thin screen transmits and reflects no sound. The expression (9.24) can be evaluated readily by standard numerical quadrature techniques that provide a far field approximation of the total field. If the opening is small compared to the distances of from the surface Γ to the source and to the receiver, the factor does not change appreciably over the surface and can be moved out of the integral. Under this condition (9.24) can be simplified and expressed in terms of the Fresnel integrals as,
(9.25)
where the distances a, b and h are defined in Figure 9.7. When h in (9.25) is positive, the receiver is located in the illuminated zone. An interesting case is when h→−∞, that is the sound field in the absence of the screen. Then, according to the Fresnel-Kirchhoff model [cf. (9.25)], the total (free) sound pressure is ieik(a+b)/4π(a+b), which is different from the exact solution by a phase factor of π/2. Despite the fact that the condition for a small aperture in the study of Fresnel diffraction is violated in the problem of the half plane, the approximation given in (9.25) appears to give reasonable predictions of barrier attenuation. However there are many reported discrepancies of the predictions due to the Fresnel-Kirchhoff model with other more accurate theoretical models and experimental data [17]. Using (9.23) and (9.25), the insertion loss of the screen, defined by (9.21) can be calculated from
(9.26)
To give a better perspective of different approximate solutions, the comparison of the Fresnel-Kirchhoff formula with the experimental data will be deferred until the next section because it is more desirable to discuss a well-known empirical scheme first.
Predicting outdoor sound
274
9.3 Empirical formulations for studying the shielding effect of barriers The most direct way to investigate the acoustical performance of noise barrier is to conduct full-scale field measurements. Alternatively, it can be determined through indoor scale model experiments. The first known graph for sound attenuation in the shadow zone of a rigid barrier due to a point source was developed by Redfearn in the 1940s [18]. The noise attenuation was given as a function of two parameters in his graphs, namely, (i) the effective height of barriers normalized by the wavelength and (ii) the angle of diffraction. Nearly 30 years later, Maekawa [19] measured the attenuation of a thin rigid barrier, with different source and receiver locations. In his experimental measurements, a pulsed tone of short duration was used as the noise source. He presented his experimental data in a chart that the attenuation was plotted against a single parameter known as the Fresnel number. The Fresnel number is the numerical ratio of path difference (the distance difference between the diffracted path and direct path of sound) to the half of a sound wavelength. In the same period, Rathe presented an empirical table for the sound attenuation by a thin rigid barrier due to a point source [20]. His empirical table was based on a large number of experimental data. The attenuation was given in octave frequency bands normalized by the reference frequency with the Fresnel number of 0.5. Kurze and Anderson [21, 22] reviewed diffraction theory from Keller [23], and used Maekawa’s and Redfearn’s experimental data to derive empirical formulas for the barrier attenuation. The attenuation is expressed as the function of relative locations of source and receiver, including the diffracted angles at the source and receiver side. There are some common features of the experimental investigations of these studies. First, a point source was used to generate incident waves in these early experimental studies. Second, the Fresnel number is an elementary parameter for determining the barrier attenuation. As a result of their comparative simplicity, Kurze-Anderson’s formulas and Maekawa’s chart are used extensively for engineering calculations. Although there are several other empirical models and charts to predict the acoustic performance of a thin barrier, we shall only discuss the Maekawa chart and other related developments in the following sections. Maekawa described the attenuation of a screen using an empirical approach based on the important parameters affecting the screening. An important parameter which appears in the treatments described earlier is the difference in path lengths from the source to the receiver via the top of the barrier (r0+rr in Figure 9.7) and the direct path length from source to receiver, R1=a+b. This is a measure of the depth of shadow produced by the screen for the given source and receiver positions. The path difference, δ1, is given by δ1=(r0+rr)−R1. (9.27) The other important parameter is the wavelength of the sound, λ. The longer the wavelength, the greater is the diffracted wave amplitude.
Predicting the performace of outdoor noise barriers
275
These parameters may be combined into the Fresnel number N1 associated with the source, that is
(9.28) In the 1960s, Maekawa obtained a comprehensive set of data for the insertion loss, which corresponds to the attenuation in the absence of ground. The measurements were made in a test room using a spherically spreading pulsed tone of short duration. The solid line in Figure 9.8 shows predictions according to Maekawa’s chart for predicting the attenuation of sound by a semi-infinite plane screen as a function of positive N1 compared with data from measurements made in an anechoic chamber. Various geometrical configurations were used and the frequency range varied from 500 to 10 kHz. Despite the wide range of Fresnel numbers associated with these experimental data, they are consistent with the measurements shown in Maekawa’s chart [19] and hence with the design curve. Also shown are predictions of the MacDonald solution (9.9) and the Fresnel-Kirchoff approximation (9.24). Maekawa obtained experimental data not only in the shadow zone but also in the illuminated zone where the source can see the receiver. In his notation, a negative value of N1 signifies that the receiver is located in the illuminated zone although the same definition (9.28) is used. For N1>1, the abscissa is logarithmic. Below this value it has been adjusted to make the design curve linear. For N1=0 the attenuation is 5 dB. At this point the source is just visible over the top of the barrier. For N1<0, the receiver is in the illuminated zone and the attenuation quickly drops to zero. In Figure 9.8, we only show N1 ranging from 0.01 to 9. A function which fits this curve quite well is
Figure 9.8 Comparison between laboratory data for the sound attenuation by a semi-infinite hard screen in free space and predictions of the Maekawa Chart (thick solid
Predicting outdoor sound
276
line), the Fresnel-Kirchoff approximation (broken line) and the MacDonald solution (thin solid line). Att=10 log10(3+20N) dB. (9.29) This formula was originally defined only for N>0 but is often used for N1>−0.05 [24]. More accurate formulas have been proposed by Yamamoto and Takagi [25]. Based on Maekawa’s original chart, they developed four different approximations.
(9.30a)
(9.30b)
(9.30c)
(9.30d)
where the function G(N1) in (9.30a) is given by
(9.30e)
Any one of these expressions gives good agreement with the data obtained from Maekawa’s chart. The maximum difference is less than 0.5 dB in (i) and is no more than 0.3 dB in cases (ii), (iii) and (iv). Although formula (i) leads to a marginally greater’ error’, it has the advantage that only one formula is required to describe the whole chart. Using the data shown in Figure 9.8 again, we display their comparison with the Yamamoto and Takagi formulae and predictions using the MacDonald solution in Figure 9.9. Kurze and Anderson [21] have derived another simple formula that has been used widely. Maekawa’s curve can be represented mathematically by,
Predicting the performace of outdoor noise barriers
277
(9.31) The empirical formulae associated with Maekawa’s chart only predict the amplitude of the attenuation and no wave interference effects are predicted [19]. In the next section, we shall discuss how they can be extended to model the interference effects of contributions from different diffracted wave paths. Recently, Menounou [26] has modified Maekawa’s chart from a single curve with one parameter to a family of curve with two Fresnel numbers. The first Fresnel number is the conventional Fresnel number and is associated with the relative position of the source to the barrier and the receiver. The second Fresnel number is defined similarly to the first Fresnel number. It represents the relative position of the image source and the receiver. Menounou also modified the Kurze-Anderson empirical formula and the Kirchhoff
Figure 9.9 Comparison between laboratory data and predictions of the different empirical formulae of Yamamoto and Takagi (Y&T) (formulas (i)–(iv) correspond to (9.30a)– (9.30d)) and of the MacDonald solution (9.30). The insertion loss of the thin screen is plotted against the Fresnel number, N1.
Predicting outdoor sound
278
solution. Unlike earlier studies, Menounou considered the plane, cylindrical and spherical incident waves in her analyses. Her study combines simplicity of use with the accuracy of sophisticated diffraction theories. Without providing the details of the derivation, we quote an improved Kurze-Anderson formula that allows a better estimation of the barrier attenuation by including the effect of image source on the total field. The improved Kurze-Anderson formula is given by
Att=Atts+Attb+Attsb+Attsp (9.32a) where
(9.32b)
(9.32c)
(9.32d)
(9.32e)
Predicting the performace of outdoor noise barriers
279
Figure 9.10 Comparison between laboratory data and predictions of the Kurze and Anderson (K&A) empirical formula. Predictions of Menounou’s modification on the Kurze and Anderson formula is also shown. The insertion loss of the thin half plane is plotted against the Fresnel number, N1. The term Atts is a function of N1 which is a measure of the relative position of the receiver from the source. The second term depends on the ratio of N2/N1. It is a measure of the proximity of either the source or the receiver from the half plane. The third term is only significant when N1 is small. It is a measure of the proximity of the receiver to the shadow boundary. The last term is a function of the ratio R′/R1 which is used to account for the diffraction effect due to spherical incident waves. Figure 9.10 shows the predicted attenuation according to the Kurze and Anderson formula and the Menounou modification. Again, both formulae appear to give predictions in agreement with the data for a thin screen.
9.4 The sound attenuation by a thin barrier on an impedance ground The diffraction of sound by a semi-infinite rigid plane is a classical problem in wave theory and dates back to the nineteenth century. There was renewed interest in the problem between the 1970s and early 1980s in connection with the acoustic effectiveness
Predicting outdoor sound
280
of outdoor noise barriers. Since outdoor noise barriers are always on the ground, the attenuation is different from that discussed in sections 9.2 and 9.3 for a semi-infinite plane screen. Extensive literature reviews on the pertinent theory and details on precise experimental studies have been carried out by Embleton and his co-workers [27, 28]. Figure 9.11 shows the situation of interest. A source Sg is located at the left side of the barrier, a receiver Rg at the right side of the barrier and O is the diffraction point on the barrier edge. The sound reflected from the ground surface can be described by the source’s ‘mirror’ image, Si. On the receiver side, sound waves will also be reflected from the ground and this effect can be considered in terms of the image of the receiver, Ri. The pressure at the receiver is the sum of four terms which correspond to the sound paths SgORg, SiORg, SgORi and SiORi. If the surface is a perfectly reflecting ground, the total sound field is the sum of the diffracted fields of these four paths, PT=P1+P2+P3+P4 (9.33) where
P1=P(Sg, Rg, O), (9.34a) P2=P(Si, Rg, O), (9.34b) P3=P(Sg, Ri, O), (9.34c) P4=P(Sg, Ri, O), (9.34d) and P(S, R, O) is the diffracted sound field due to a thin barrier for given positions of source S, receiver R and the point of diffraction at the barrier edge O.
Predicting the performace of outdoor noise barriers
281
Figure 9.11 Ray paths for a thin barrier placed on the ground between the source and receiver. If the ground has a finite impedance (such as grass or a porous road surface) then the pressure corresponding to rays reflected from these surfaces will need to be multiplied by the appropriate spherical wave reflection coefficient(s) to allow for the change in phase and amplitude of the wave on reflection as follows:
PT=P1+QsP2+QRP3+QsQRP4, (9.35) where Qs and QR are the spherical wave reflection coefficients at the source and receiver side, respectively. The spherical wave reflection coefficients can be calculated according to (2.40c) for different types of ground surfaces and source/receiver geometries. For a given source and receiver position, the acoustic performance of the barrier on the ground is normally assessed by use of either the excess attenuation (EA) or the insertion loss (IL). They are defined as follows: EA=SPLb−SPLf (9.36a) IL=SPLb−SPLg, (9.36b) where SPLf is the free field noise level, SPLg is the noise level with the ground present and SPLb is the noise level with the barrier and ground present. Note that in the absence of a reflecting ground, the numerical value of EA (see also Att defined by (9.21) in section 9.2.3) is the same as IL. If the calculation is carried out in terms of amplitude only, as described in [19], then the attenuation Attn for each ray path can be directly determined from the appropriate Fresnel number Fn for that path. The excess attenuation of the barrier on a rigid ground is then given by
Predicting outdoor sound
282
(9.37) The attenuation for each path can either be calculated by the empirical or analytical formulas listed in sections 9.2 and 9.3 depending on the complexity of the model and the required accuracy. If the calculation demands an accurate estimation on both the amplitude and phase of the diffracted waves, then the MacDonald solution or the Hadden and Pierce solution should be used although the latter solution will give a more accurate solution for both source and receiver locating very close to the barrier [28]. Nevertheless, the former solution is equally accurate for most practical applications where both the source and receiver are far from the barrier edge. Figure 9.12(a) displays predicted insertion loss spectra for propagation from a point source for the source-receiver-barrier geometry indicated. The sound pressure was calculated using the four sound paths described above and the MacDonald expression (9.9). Curves plotted with a thin line is for a rigid ground surface and a dashed line is for an absorbing surface such as grassland. For the grassland impedance, the Delany and Bazley one-parameter model with an effective flow resistivity of 300 kPa s m−2 has been used. The oscillations are due to interference between the sound waves along the four ray paths considered. The curve plotted as a thick line is the result using Maekawa’s method to determine the attenuation of each ray path. The total insertion loss is obtained by summing all four paths incoherently by assuming that the point source is located above a rigid ground. The same method is used to predict the insertion loss above the absorbing surface. The predicted results (dotted line) are presented in Figure 9.12(a). Neither of the incoherent predictions oscillates since the phases of the waves are not considered. Nevertheless, these lines give a reasonable approximation to the results of more complex calculations [29]. Figure 9.12(b) shows results for a similar geometry except that in this case a line of incoherent point sources, separated by approximately 1.5 m along the nominal road line, has been assumed and the calculation has been carried out for each source. The averaging over all the predictions for the different sources has smoothed the curves. Note that the IL for the grassland case becomes negative around 500 Hz indicating that the sound absorption due to the grass is greater than the screening effect of the barrier for these conditions. In both Figure 9.12(a) and (b), the height of the barrier is taken as 3 m. The source is assumed to be 5 m from the barrier and 0.3 m above the ground. The receiver is assumed to be 30 m from the barrier and 1.2 m above the ground. Lam and Roberts [30] have suggested a relatively simple approach for modelling full wave effects. In their model the amplitude of the diffracted wave, Att1, may be calculated using a method such as that described in section 9.3. However, the phase of the wave at the receiver is calculated from the path length via the top of the screen assuming a phase change in the diffracted wave of π/4. It is assumed that the phase change is constant for all source, barrier and receiver heights and locations. For example, the diffracted wave for the path SgORg would be given by
(9.38)
Predicting the performace of outdoor noise barriers
283
It is straightforward to compute the contributions for other diffracted paths and hence the total sound field can be calculated through the use of (9.35) for impedance ground and (9.33) for a hard ground. This approach provides a reasonable approximation for many conditions normally encountered in practical barrier situations where source and receiver are many wavelengths from the barrier and the receiver is in the shadow zone.
Figure 9.12 Comparison of predictions resulting from summing the contributions of different ray paths incoherently and coherently for the sound field (a) insertion loss due to a point source and (b) excess attenuation from a coherent line source behind an outdoor noise barrier placed on a ground surface.
Predicting outdoor sound
284
The scheme works well for a barrier located on a hard ground but less so if the ground has finite impedance. To illustrate this point, Figure 9.13 compares data obtained in an anechoic chamber near a thin barrier placed on an absorbing surface of thickness 0.015 m with predictions of the Hadden and Pierce
Figure 9.13 Comparison of laboratory data (points) with predictions obtained from the Hadden and Pierce solution (solid line) and the Lam and Roberts approximate scheme (broken line) for a barrier place on an impedance ground. The source is located at 0.355 m from the barrier and at 0.163 m above the ground. The receiver is placed at 0.342 m from the barrier and 0.198 m above the ground. The ground is modelled as a Delany and Bazley hard backed layer (3.1, 3.2) with effective flow resistivity 9000 Pa s m−2 and (known) layer thickness of 0.015 m. formula and Lam and Roberts approximate scheme. It is obvious that predictions obtained by using the Hadden and Pierce formula agree well with the experimental observations. On the other hand, while the Lam and Roberts model predicts the general trend of the insertion loss spectrum, it does not predict its magnitude as well, particularly in frequency intervals where the ground effects are strong.
Predicting the performace of outdoor noise barriers
285
9.5 Noise reduction by a finite length barrier All outdoor barriers have finite length and, under certain conditions, sound diffracting around the vertical ends of the barrier may be significant. The MacDonald solution (see section 9.2.2) has been adapted to include the sound fields due to rays diffracted around the two vertical edges of a finite length barrier [31]. There are other diffraction theories for the vertical edge effects which have met with varying degrees of success when compared with data [32, 33]. In this section,
Figure 9.14 Eight ray paths associated with sound diffraction by a finite length barrier. a more practical method is described [30]. The accuracy of this approach has been verified [34]. Figure 9.14 shows eight diffracted ray paths contributing to the total field behind a finite length barrier. In addition to the four ‘normal’ ray paths associated with diffraction at the top edge of the barrier (see Figure 9.7), four more diffracted ray paths from the vertical edges, including two ray paths each from either side, have been identified. In principle, there are reflected-diffracted-reflected rays also which reflect from the ground twice but these are ignored. This is a reasonable assumption if the ground is acoustically soft. The two rays at either side are, respectively, the direct diffracted ray and the diffracted-reflected ray from the image source. The reflection angles of the two diffracted-reflected rays are independent of the barrier position. These rays will either reflect at the source side or on the receiver side of the barrier depending on the relative positions of the source, receiver and barrier. We illustrate both possibilities in Figure 9.14. The total field is given by
PT=P1+QsP2+QRP3+QsQRP4+P5+QRP6+P7+QRP8, (9.39)
Predicting outdoor sound
286
where P1−P4 are those given in (9.34 a−d), for diffraction at the top edge of the barrier. The contributions from the two vertical edges E1 and E2 are P5≡ P(Sg, Rg, E1), P6≡P(Si, Rg, V1), P7≡P(Sg, Rg, V2) and P8≡P(Si, Rg, E2) respectively. The spherical wave reflection coefficient QR is used for P6 and P8 as the reflection is assumed to take place at the receiver side but Qs should be used instead if the reflection happens at the source side. Although we can use any of the more accurate diffraction formulas described in section 9.2 to compute P1−P8, a simpler approach, following Lam and Roberts [30], is to assume that each diffracted ray has a constant phase shift of π/4 regardless of the position of source, receiver and diffraction point. Thus the empirical formulations described in section 9.3 can also be used to compute the amplitudes of the diffracted rays. Indeed,
Figure 9.15 Comparison between laboratory data for the insertion loss of a barrier (0.3 m high and 1.22 m long) on hard ground and predictions using the Lam and Roberts approximate scheme [30]. The source was 0.033 m high and 1.008 m from the barrier. The receiver was on the ground and 1.491 m from the barrier. Muradali and Fyfe [34] compared the use of the Maekawa chart, the Kurze-Anderson empirical equation and the Hadden-Pierce analytical formulation with a wave-based Boundary Element Method (BEM). Predictions of the ray-based approaches show excellent agreement with those of the relatively computationally intensive BEM formulation.
Predicting the performace of outdoor noise barriers
287
In Figure 9.15, data obtained by Lam and Roberts (figure 3 in [30]) are compared with predictions using their proposed approximation scheme. In their studies, the measurements were conducted over a hard ground with the barrier height of 0.3 m and length of 1.22 m. The source was located at 1.009 m from the barrier at the source side and 0.033 m above the ground. The receiver was situated at 1.491 m from the barrier at the receiver side with the microphone placed on the ground. Although the data shown in Figure 9.15 are the same as used by Lam and Roberts, the predicted spectrum of the insertion loss is calculated by our own computer program. Predictions based on other numerical schemes detailed in sections 9.2 and 9.3 are not shown because they tend to give similar results to the Lam and Roberts predictions.
9.6 Adverse effect of gaps in barriers When the transmission of sound through the barrier is negligible, the acoustic field in the shadow region is mainly dominated by the sound diffracted around the barrier. However, in some cases, leakage will occur due to shrinkage, splitting and warping of the panels, and weathering of the acoustic seals. The problems of shrinkage and splitting are particularly acute for noise barriers made of timber. Sometimes gaps are unavoidable since spaces are required, for example, for the installation of lamp posts in urban districts. Watts [35] has investigated the resulting sound degradation of screening performance due to such leakage. He used a 2-D numerical model based on the BEM to predict the sound fields behind barriers of various heights with different gap widths and distributions. The A-weighted sound leakage increases as the gap size increases. Also, he reported that (a) sound leakage is more significant in region closed to barrier and (b) there are no significant leakage effects of noise from heavy vehicles. It should be noted that only horizontal gaps can be included in his two-dimensional boundary element model. Here we outline a recent theory developed by Wong and Li [36] and show that their predictions of the effects of barrier leakages agree reasonably well with data from laboratory and outdoor experiments. Consider the barrier diffraction problem shown in Figure 9.16. Based on the Helmholtz integral formulation, Thomasson [37] derived an approximate scheme for the prediction of the sound field behind an infinitely long barrier. The solution for a thin rigid screen is given by
(9.40)
Predicting outdoor sound
288
Figure 9.16 The coordinate system used in the Helmholtz integral formulation for a sound diffracted by a rigid infinitely long barrier of height H. where dS is the differential element of the barrier surface, rS, rR and r0 are, respectively, signifies the the position of source, receiver and barrier surface. The symbol (which can either be or ) due to the source located at sound field at receiver points (which can either be or ). The computation of is straightforward if the Weyl-Van der Pol formula is used (see (2.40a)). The sound field from source to receiver in the absence of a barrier can be determined by noting that the sound field vanishes when the rigid screen, Γ∞ say, occupies the infinite plane of y=0. Then
(9.41a) or
(9.41b) The sound field behind a rigid screen can be computed by substituting (9.41a) into (9.40) to yield
Predicting the performace of outdoor noise barriers
289
(9.42) Although the Thomasson approach (9.42) provides an accurate method for predicting the sound field behind a rigid screen, the use of (9.40) in conjunction with the Weyl-Van der Pol formula is preferable because the area required for integration is generally smaller than that required in (9.42). Hence, less computation is required for the evaluation of the sound fields behind a thin barrier. Since (9.40) is the most general formula for the computation of a sound field behind a thin barrier, it can be generalized to allow any arbitrary gaps in the barrier. Specifically, if there are gaps in the barrier, then their areas should not be included in the computation of the integral. For instance, suppose there is a vertical gap of width 2d in an otherwise infinitely long barrier of height H. Without loss of generality, we assume that the gap extends from y=−d to y=d. The sound field behind such a barrier can be computed by
(9.43)
can be regarded as the contribution due to horizontal Note that the term dipoles on the surface of the barrier. The asymptotic solution for a horizontal dipole above an impedance plane is detailed in Chapter 5. In many practical situations, the thin barrier may be assumed to be infinitely long and to have a constant cross-section along the y-direction. In view of (9.40), the sound field can therefore be expressed as
(9.44) where lB is the constant barrier ‘height’. It follows immediately that the y-integral of the second term can be evaluated asymptotically to yield a closed-form analytical expression. The evaluation of the integral is fairly straightforward but involves tedious algebraic manipulations. The sound field can be simplified to
(9.45)
Predicting outdoor sound
290
where d1, d2, d3 and d4 are defined in Figure 9.17 and XR is the shortest distance measured from the receiver to the barrier plane. The spherical wave reflection coefficients Qs and QR are calculated on the basis of ground impedance on the source side and receiver side respectively. In our case, the ground impedance is the same for both sides but, as demonstrated by Rasmussen [38], they can be different. The integral limits in (9.45) specify the ‘height’ of the thin barrier. If there are horizontal gaps in the barrier, the height of the barrier can be adjusted accordingly. Consider the thin barrier of height H with a horizontal gap of size (h2−h1) shown in Figure 9.18. The integral term in (9.45) is broken down into two parts where the integral limits for lB range from z=0 to z=h1 and from z=h2 to z=H as follows:
(9.46)
It is straightforward to generalize (9.46) to allow for multiple horizontal gaps in the barrier by splitting the integral into appropriate smaller intervals representing the barrier surface.
Figure 9.17 Definition of path lengths and coordinates for evaluating (9.45).
Predicting the performace of outdoor noise barriers
291
Figure 9.18 An infinitely long thin barrier with a horizontal gap. It is important to note that the sound field behind a barrier with horizontal gaps can also be calculated by means of a simple ray method, thus eliminating the need for the timeconsuming numerical integration procedure. Based on either the analytical or the empirical formulation of the diffraction theory outlined earlier, we can use either one of the expressions to evaluate the required sound field in the presence of horizontal gaps. Recognizing that PT(H) may be regarded as the asymptotic solution for the right side of (9.45) and combining the two terms in the equation, we can state the integral as
(9.47)
In the case of a barrier of height H with a horizontal gap starting from z=h1 extending to z=h2 (see Figure 9.18), the sound field can be calculated by using (9.46) to yield
Predicting outdoor sound
292
(9.48)
With the use the above equation, we can compute the sound field behind a barrier that has a horizontal gap as follows:
(9.49) The first term of (9.49) corresponds to the sound field diffracted by a thin rigid barrier without any gaps. Grouping the second and third terms, we can interpret (9.49) as the sound field due to the leakage through the barrier gap. That is to say, the ‘leakage’ of sound through a single gap can be represented by the difference of two barriers with different heights, h1 and h2
(9.50) The total sound field behind a barrier with n horizontal gaps can be generalized to give
(9.51)
is the sound field behind the thin barrier (with no gaps) and is the leakage of sound through gaps. The leakage of sound at each gap can be calculated by using (9.51) with the appropriate barrier ‘heights’.
where
Predicting the performace of outdoor noise barriers
293
Figure 9.19 Comparison of measured (broken line) and predicted transmission loss for a 0.275 m high barrier with a 0.017 wide gap at ground level (thick solid line). Also shown is the predicted transmission loss for a barrier of the same dimensions but with no gap (thin solid line). The receiver is located at horizontal distances of (a) 0.5 m, (b) 0.6 m, (c) 0.7 m and (d) 0.8 from the barrier. Figure 9.19 shows data from a laboratory experiment in which the barrier top edge was 0.275 m from the ground with a horizontal gap of 0.017 m starting from the ground level [36]. The total area of the gap was approximately 6% of the total area of the barrier surface. The source height was located at 0.07 m above the ground and at 0.49 m from the barrier. The receiver was located at 0.11 m above the ground, and at horizontal distances of (a) 0.5 m, (b) 0.6 m, (c) 0.7 m and (d) 0.8 m from the barrier. Measurements were conducted on a hard ground. Experimental data denoted as Transmission Loss (TL) in Figure 9.19 are presented as the relative sound pressure levels with respect to the reference sound pressure measured at 1 m in free field. Numerical predictions are in general agreement with these experimental results. Hence, it is possible to use the proposed model to assess the degradation of acoustic performance of the barrier due to presence of a horizontal gap.
9.7 The acoustic performance of an absorptive screen The application of sound absorbent materials on barrier surfaces for increasing the insertion loss of a barrier has been a subject of interest in the past few decades. Although
Predicting outdoor sound
294
the theory of the sound diffracted by a rigid half plane has been studied with considerable success, there are still uncertainties about the usefulness of covering barriers with sound absorption materials. An early theoretical study [39] has suggested that an absorbent strip of one wavelength width should be adequate to provide a similar insertion loss as the corresponding barrier totally covered by the same sound absorption material. However, this study does not provide the required information about the effect of placing this absorbent strip on either the source side or the receiver side of the barrier. In addition, the experimental and theoretical studies of Isei [40] indicated that the absorptive properties of the barrier surface did not significantly increase the acoustic performance of barriers. However, his conclusion is in contrast with previous experimental and theoretical studies by Fujiwara [41]. In this section, we outline an analytical solution which is based on a heuristic extension of MacDonald’s solution. We also give a heuristic solution based on Hadden and Pierce [13], but a corresponding heuristic extension of the line integral approach of Embleton [16] is not pursued here. Fujiwara [41] suggested the use of a complex reflection coefficient, Rp into the second term of the MacDonald solution (see (9.9)) to obtain an approximate solution for the sound field behind an absorbent thin screen. Clearly, the diffracted field could be modified to allow for reflection of spherical wave fronts. Hence
(9.52) where Qb is the spherical wave reflection coefficient at the barrier façade facing the source. This model takes no account of the impedance on the side of the barrier facing the receiver. It is remarkable that neither of the diffraction models developed by Isei [40] and Fujiwara [41] satisfy the reciprocity condition, that is the predicted sound fields are different if one exchanges the position of source and receiver behind an absorbent barrier with different impedance on the source and receiver sides. To satisfy the reciprocity condition, L’Espérance et al. [42] extended the Hadden and Pierce diffraction model to include consideration of the impedance on both sides of the barrier in the model. In the presence of a rigid wedge, the diffracted field is given by (9.16), re-stated here as pd=V1+V2+V3+V4, (9.53) where Vi≡V(ςi) for i=1, 2, 3 and 4. The values of V1, V2, V3 and V4 can be obtained by evaluating the integrals of (9.18c) numerically using the standard Laguerre technique. These four terms can be interpreted physically as the contributions from the diffracted rays travelling from the source to the edge to the receiver, from the image source to the edge to the receiver, from the source to the edge to the image receiver and from the image source to the edge to the image receiver respectively. As a result, the effect of the impedance boundary conditions on both sides of the wedge can be incorporated into the Hadden and Pierce formulation as
pd=V1+QbV2+QfV3+QbQfV4 (9.54)
Predicting the performace of outdoor noise barriers
295
where Qb≡Q(r0+rr, βb, π/2−θ0) and Qf=Q(r0+rr, βf, π/2−θr) are, respectively, the spherical wave reflection coefficients of the barrier façades facing the source and receiver. The corresponding parameters βb and βf are the effective admittances of the source and receiver sides of the wedge. Using the formula specified in section 9.4, we can determine the insertion of loss of an absorbent barrier resting on an impedance ground. The implementation is straightforward and the details will not be given here. Figure 9.20 shows the comparison between laboratory data obtained by L’Espérance et al. [scaled from figure 4(b) of ref. 43] with predictions of the heuristic modification of the Hadden and Pierce model. In the experiments, the height of the barrier was 0.577 m, the source was placed at 1.2 m from the barrier and at 0.011 m above the ground. The receiver was located at 0.6 m from the barrier and 0.006 m above the ground. A 0.04 m thick fibreglass layer was used to cover either the source side or both sides of the barrier surface. In Figure 9.20, the data corresponding to these two cases are shown as the open circles and open triangles respectively. Also shown are the measured results for a rigid
Figure 9.20 Comparison of laboratory data [43] with the predictions of a heuristic modification of the Hadden-Pierce model [13] for an absorptive screen. The solid circles and solid line represent theoretical and experimental results, respectively, for the hard barrier. The open circles and short-dashed line represent theoretical and experimental results, respectively, when the surface of the barrier facing the source is covered with fiberglass. The open triangles and long-dashed line represent theoretical and experimental results, respectively, when both surfaces of the barrier are covered with fiberglass.
Predicting outdoor sound
296
barrier (small solid circles). The impedance of the fibreglass layer was predicted by using the Delaney and Bazley one-parameter model (3.2) and assuming an effective flow resistivity of 40 kPa s m−2. Good agreement between the predicted and measured insertion losses is evident. In this way, L’Espérance et al. have shown that the application of sound absorption materials on the barrier façade can lead to a significant improvement in the barrier’s performance. However, Hayek [44] has suggested that barrier absorption is less effective in reducing the diffracted noise in the shadow zone where ground absorption is the most dominant factor in determining the acoustic performance of the barrier. It remains important to investigate the effectiveness of using absorptive screens in protecting receivers from excess noise particularly for the case in urban environments where multiple reflections and scattering between surfaces are prevalent.
9.8 Other factors in barrier performance Although there are many other factors that may affect the barrier effectiveness in shielding receivers from excessive noise, in this section we shall address the two issues concerning meteorological effects and the influence of barrier shape that are of current research interest and give a brief review of the salient points. 9.8.1 Meteorological effects In the barrier diffraction models described earlier, atmospheric conditions have been assumed to be steady and uniform. However, meteorological effects, such as temperature and wind velocity gradients, play a very important role in determining the acoustic performance of barriers. As a result of atmospheric refraction, barrier effectiveness is expected to be reduced in the downwind direction but enhanced in the upwind direction. By means of full-scale measurements conducted in the 1970s, Scholes et al. [45] demonstrated such wind effects on the acoustic performance of a noise barrier. Salomons [46] was among the first to study the effect of an absorbing barrier in a refracting medium by using a Parabolic Equation (PE) formulation. He assumed an absorbing barrier in his PE model and set the pressure at the grid points representing the barrier to zero. Thus, the part of the sound that falls on the barrier is stopped. A minor conflict appears in his method. The enforced zero pressure on grid implies that the normal velocity on barrier is zero too. This is the boundary condition for rigid surface. On the other hand the PE, which assumes only forward propagation from source to receiver, does not allow any backscattering of waves by the barrier. Thus, the reflection from the barrier is ignored when computing the total diffracted field. Rasmussen [47] studied the diffraction of barrier over an absorbing ground and in an upwind condition both theoretically and experimentally. He used an approach rather similar to the fast field formulation to estimate effective distances from source to the barrier edge and from the barrier edge to receiver in an upwind condition. Then the uniform theory of diffraction [48] was used to compute the diffracted sound field in the shadow zone. It is questionable whether the barrier diffraction can be ‘de-coupled’ from the wind gradient effects in this way. Nevertheless, Rasmussen’s numerical results agreed reasonably well with his 1:25 scale
Predicting the performace of outdoor noise barriers
297
model experiments. Muradali and Fyfe [49] have proposed a heuristic method for modelling barrier performance in the presence of a linear sound speed profile. Their model combines the effects of the sound refracted over a barrier and the sound diffracted by a barrier. Geometrical ray theory is used to determine the ray paths and the diffracted wave effect is incorporated by using the modified Hadden-Pierce formula. Li and Wang [50] have proposed a novel method to simulate the effects of a noise barrier in a refracting atmosphere. They mapped the wave equation in a medium where the speed of sound varies exponentially with height above a flat boundary to that for a neutral fluid above a curved surface. The barrier problem in an upward-refracting medium is then solved by applying the standard Boundary Element Method over a curved surface in a homogeneous medium. Recently, Taherzadeh et al. [51] developed a hybrid scheme for predicting barrier in a downwind condition. Their numerical scheme is based on a combination of the boundary integral and FFP techniques in which the Green’s function required in the boundary integral equations is evaluated by using the FFP formulation. Atmospheric turbulence is an important factor in barrier performance since it causes scattering of sound into the shadow zone. Although experimental studies of the effects of atmospheric turbulence on the acoustic performance of the barrier are rare, theoretical studies have been conducted by Daigle [52], Forssén and Ogren [53] and others quoted in these references. Some progress in modelling the acoustic performance of barriers in a turbulent atmosphere using a substitute sources method has been reported by Forssén [54, 55]. Hybrid models have been proposed, involving combinations of the BEM with the PE, that enable effects of barriers, range-dependent impedance and turbulence to be taken into account [56, 57]. Rasmussen and Arranz [58] have applied the Gilbert et al. [59] approach, assuming weak atmospheric turbulence with a simple Gaussian distribution in the fluctuating velocity field, in a PE formulation to predict the sound field behind a thin screen in a scale model experiment. The indoor experiments based upon a 1:25 scaling ratio were conducted in a wind tunnel in which the agreement of numerical results and experimental measurements was very good. They concluded that the flow pattern associated with a specific noise barrier could be an important design parameter for improving the acoustic performance of barriers. Improvements in computational speeds and resources have encouraged wider use of time domain models in acoustics. Recent work has been devoted to combining calculations employing time-dependent computational fluid dynamics with PE-based frequency domain calculations [60]. However, there are few studies to measure or predict the velocity profiles and their associated turbulence accurately in the region close to a barrier on the ground and it remains a challenge to combine fluid dynamics and diffraction models to establish an accurate scheme for predicting the acoustic effectiveness of screens under the influence of wind. 9.8.2 Effects of barrier shape Most of the theoretical and experimental studies found in literature are focused on a straight-edge barrier or a wedge. In fact, the shapes of barrier edges can affect their shielding efficiencies significantly. Variations in the barrier shapes may be used to improve the shielding performance without increasing the height of barriers.
Predicting outdoor sound
298
9.8.2.1 (a) Ragged-edge barrier Wirts [61] introduced a type of barrier with non-straight top edge called ‘Thnadners’. The saw-tooth Thnadners barrier consists of a number of large triangular panels placed side by side. Flattop Thnadners are similar to sawtooth Thnadners but each of the sharp corners at the saw-tooth top is flattened. Wirts suggested using the simplified Fresnel theory to calculate the sound fields behind Thnadners barriers. Results of his scale model experiments agreed with the proposed theory. The most interesting conclusions of his study are additional improvements on the shielding performance if some parts of the barrier are removed. Improvements are obtained at some receiver locations even if over 50% of the barrier surface areas are removed. Ho et al. [62] conducted many scale model experiments and concluded that the acoustic performance of a barrier can be improved at high frequencies by introducing a random fluctuation to the height of the barrier, producing the so-called ragged-edge barrier. However, the poorer performance of the raggededge barrier at low frequencies was not explained. An empirical formula for the insertion loss of the ragged-edge barrier was obtained from the experimental results. The formula involves four parameters which are the frequency of the incident sound, the Fresnel number, the maximum height fluctuation from the average barrier height and the horizontal spacing between the height fluctuations. Shao et al. [63] have proposed a 2-D model for a random edge barrier. Their models were based on the Rubinowics-Young formula which is a line integral method. The integration is performed along the random edge. They also conducted scale model experiments to validate their theoretical models. They concluded that the improvement could be obtained by introducing a random edge profile, especially at high frequencies. The insertion loss is controlled by the parameter of average barrier height and the variations of the randomness. In some cases, an improvement in the insertion loss can be obtained if the average height of a random edge barrier is smaller than the original straight-edge barrier. 9.8.2.2 (b) Multiple-edge barriers After reviewing relevant previous experimental studies by May and Osman [64] and Hutchins et al. [65], Hothersall et al. [66] have used the BEM approach to study T-profile, Y-profile and arrow-profile barriers theoretically (see Figure 9.21). They concluded from their numerical simulation results and previous work that a multiple-edge profile barrier has better acoustical performance than a normal thin plane barrier of the same height. However, in most conditions, the Y-profile and arrow-profile barriers perform less efficiently than the T-profile barrier. The use of T-profile barrier can benefit
Predicting the performace of outdoor noise barriers
299
Figure 9.21 T-profile, Y-profile, arrow-profile and cranked (top-bended) barriers. regions close to the barrier and close to ground. On the other hand, the height of the barrier is a dominant factor for the receiver located far away from the barrier and the top profile plays a less important role. The application of absorbent materials on the cap of Tprofile has also been studied. A T-profile barrier with an absorptive cap can increase the insertion loss as long as the thickness of absorbent materials is thin. An excessively thick layer of sound absorbing materials can lead to a less efficient shielding. At present, only numerical tools, such as BEM, are used for study of the acoustic performance of the T-profile and multiple-edge barriers. Consequently, most of the theoretical studies are restricted to two dimensions. Another type of multiple-edge barrier is the ‘cranked’ or top-bended barrier (see Figure 9.21) which is used increasingly in ‘high-rise’ cities. Jin et al. [67] have proposed an analytical method for the prediction of sound behind a top-bended barrier. They used a theoretical model based on the uniform geometrical theory of diffraction [48]. The total diffracted sound is calculated by summing multiple diffractions occurring at the top and corner points, at which convex and concave edges are formed. They concluded that the third and higher orders of multiple diffraction did not contribute significantly to the total diffracted sound and so these higher-order diffracted terms were ignored in their model. They compared the predicted insertion loss spectra between finite and infinite length barriers but some ripples caused by edge effects are evident in their predictions for the finite length barrier. Jin et al. used a commercially available BEM programme to compare with their analytical solutions for the 2-D case and obtained good agreement. Okubo and Fujiwara [68] have suggested another design in which an acoustically soft waterwheel-shaped cylinder is placed on the top of a barrier. They studied its effects by using a 2-D BEM approach and conducted 3-D scale model experiments. They concluded that the insertion loss of barrier is improved by the cylinder but the effect is strongly dependent on the source frequency. Since the depth and opening angle of each channel influence the centre frequency, a suitable variation of the channel depth can flatten the frequency dependency and improve the overall performance of the A-weighted noise levels behind the barrier. 9.8.2.3 (c) Other barrier types Wassilieff [69] has introduced the concept of picket barrier suggesting that traditional Fresnel-Kirchhoff diffraction is not applicable to a picket barrier at low-frequencies
Predicting outdoor sound
300
because the wavelengths of the low-frequency sound are comparatively larger than the widths of the vertical gaps in the picket barrier. He added terms for a ‘mass-layer’ effect to the Fresnel-Kirchhoff diffraction theory to increase the accuracy of the model at low frequencies. Nevertheless, the original Fresnel-Kirchhoff diffraction theory gives better accuracy at the high-frequency region. He concluded that a careful adjustment of the picket gap can result in an improvement at certain low frequencies compared with a solid barrier. However, the overall acoustic performance of barriers is reduced at other frequencies. Lyons and Gibbs [70] have studied the acoustic performance of open screen barriers, mainly the performance of louvre-type barrier at low frequency. Their model barrier consisted of vertical pickets, having a sound absorbing surface on one side, which were in two offset rows. The cavity left between two offset pickets is designed for better ventilation. They concluded that the side with the open area has less influence on transmission loss at low-frequency sound. They also derived an empirical formula for the calculation of transmission loss of his louvre-type barrier with the dependent parameters being the overlapped area and the cavity volume between two offset rows of pickets. They found that the leakage loss through two offset rows of pickets is relatively small at low frequency. As a refinement of this study, Viverios et al. [71] have developed a numerical model that was based on the Fresnel-Kirchoff approximate scheme to estimate the transmission loss of a louvre barrier. After incorporating the amplitude and phase changes due to the absorbing materials within the louvre bladders, their model agreed reasonably well with measurements. Watts et al. [72] have used the BEM formulation to study the acoustic performance of louvred noise barriers. Nevertheless, it seems that more theoretical and experimental studies are required to develop a simple scheme for predicting the sound field behind open screen barriers. A comprehensive summary of the efficiency of noise barriers of different shapes can be found in the paper by Ishizuka and Fujiwara [73]. The authors used the boundary element method and standard traffic noise spectrum to determine the broadband efficiency of several popular noise barrier shapes with respect to that predicted for an equivalent 3 m high plain noise screen. Their work shows that a complex noise barrier edge, for example a Y-shape barrier or a barrier with a cylindrical edge, can yield a 4–5 dB improvement in the insertion loss. This is important when the increase in the barrier height is not practical or impossible. Figure 9.22 reproduced from [73] illustrates the change in the mean insertion loss relative to a standard 3 m high, plane screen noise barrier. If a source of noise is close to the barrier, then the positive effect of the complex barrier shape can become small in comparison with the effect of absorbing barrier treatment. This phenomenon has been investigated, experimentally and numerically, by Hothersall et al. [74] who studied the performance of railway noise barriers. Reflecting
Predicting the performace of outdoor noise barriers
301
Figure 9.22 Predicted acoustic performance of traffic noise barriers of various shapes assuming a standard traffic noise spectrum. The figures indicate the relative change in the mean insertion loss relative to a 3 m plane screen [73]. Reprinted with permission from Elsevier. and absorbing railway noise barriers of different shapes were positioned as close as possible to the train structure, within the limitations of the structure gauge (see Figure 9.23). The barrier shapes included a plain screen (a), a cranked screen (b), a parabolic screen (c), a multiple-edge noise screen (d) and a corrugated barrier (e). It was found that the insertion loss values for a rigid screen were between 6 and 10 dB lower than those for a similar screen with absorbing treatment.
Predicting outdoor sound
302
Figure 9.23 Configuration of the model and barrier cross-sections in a comparative study [74]. In a particular case, where a 1.5 m high plain screen was installed 1.0 m away from a passing railway carriage, the maximum predicted improvement in the average insertion loss due to the absorbing barrier treatment was 14 dB. On the other hand, any of the
Predicting the performace of outdoor noise barriers
303
modifications in the barrier shape, resulted in a less than 4 dB gain in the insertion loss compared with that of the basic plain screen of equivalent height [74].
9.9 Predicted effects of spectral variations in train noise during pass-by Models for predicting the effects of noise control treatments rely heavily on the knowledge of the reference noise source spectrum. In road traffic noise studies, a standardized spectrum is used widely to account for the non-linearity in the emitted acoustic spectrum [75]. No similar standard exists at present to regulate the noise spectrum emitted by high-speed trains. Unlike noise from motorway traffic, which is a relatively stationary process, the noise spectrum of a train can vary significantly during its pass-by. The results of the work by Horoshenkov et al. [76] suggest that during the pass-by of a high-speed intercity train the variation of the sound pressure level (SPL), in the frequency range between 500 and 5000 Hz, can be as high as 20 dB sec−1. It is common in many practical calculations to use the average spectrum for the whole passby. Indeed, several railway noise spectra have been compiled for such use [77, p. 175]. However, a likely drawback in adopting an average spectrum is the failure to model the distinctive time-dependent performance of noise control elements (e.g. noise barriers) during the pass-by of a train. In practice, the engineering measure of the in situ efficiency of a railway noise barrier, the broadband insertion loss, can vary considerably during the pass-by so that the perceived (subjective) acoustic efficiency of a noise control element is somewhat reduced. In this sense, one can argue that the noticeable fluctuations in the insertion loss during the train pass-by are subjectively more significant than the limited average barrier performance. This phenomenon may need to be given a careful consideration when the efficiency of expensive railway noise barrier schemes is assessed. Here we demonstrate that the variation in the reference noise source spectrum can result in a perceivable fluctuation of the noise efficiency of some noise barrier designs. Figures 9.24 and 9.25 present typical narrow-band spectrograms measured for the passage of the Intercity 125 (diesel) and Intercity 225 (electric) trains respectively. The distances on the vertical axes in these Figures correspond to the time-dependent separation between the fixed receiver position on the ground and the varying position of the front locomotive in the train. We have used the measured narrow-band spectrograms to determine the 1/3-octave band reference, time-dependent noise spectra which are required to model numerically the time-dependent insertion loss of three different barrier shapes: a plane screen, a screen with a quadrant of cavities at its upper edge (‘spiky top’) and a T-shape noise barrier. The ‘spiky top’ barrier has been designed to achieve its maximum efficiency
Predicting outdoor sound
304
Figure 9.24 The spectrogram of noise emitted by a passing Intercity 125 (diesel) travelling at 184 km h−1
Figure 9.25 The spectrogram of noise emitted by a passing Intercity 225 (electric) travelling at 176 km h−1. around 1000–2000 Hz, that is in the part of the spectrum where the maximum noise emission occurs (see Figures 9.24 and 9.25). The supposed noise control configurations are shown in Figure 9.26(a), (b) and (c). Two sources of noise are elevated 0.3 m above
Predicting the performace of outdoor noise barriers
305
the ballast and their positions coincided with the areas of rail-to-wheel interactions (see Figure 9.26).
Figure 9.26 Schematic representation of the terrain, train body and the noise barrier profiles assumed for calculations with the BEM model: (a) plane screen, (b) ‘spiky top’ and (c) Tshape. Predictions have been made using the incoherent line source boundary element model proposed by Duhamel [78]. The model requires the discretization of the surfaces in two dimensions only since it assumes that the barrier and the source are infinitely long. The pseudo-3-D pressure field is calculated from
(9.55) where is the attenuation and p2D(x, y, k) is the 2-D, frequencydependent acoustic field predicted, for example, using the boundary integral equation
Predicting outdoor sound
306
method detailed in Chapter 8 (8.2.4). In ideal circumstances, a full 3-D model would be required to predict the time-dependent insertion loss of a finite noise barrier length for a moving train of finite dimensions. A practical realization of such a model is beyond the scope of many numerical methods and, certainly, beyond the power of modern PCs. Using the measured time-dependent spectral data and predicted values of the insertion loss, the broadband time-dependent noise barrier insertion loss is calculated using
(9.56) where L0(fn, t) is experimentally determined time-dependent, 1/3-octave railway noise spectra, LB(fn, t)=L0(fn, t)−ILP(fn) and ILP(fn) is the predicted 1/3-octave insertion loss. The values of fn are the standard 1/3-octave band frequencies defined in the range between 63 and 3150 Hz. The resulting predictions of the time-dependent insertion loss are shown in Figures 9.27(a) and (b) for the diesel and electric trains respectively. The noise barrier surface and the body of the train have been assumed to be rigid so that multiple reflections are included. The acoustic impedances of the porous ballast
Figure 9.27 Predicted time-dependent, broad band insertion losses for three barrier designs: (a) Intercity 125 (diesel) and (b) Intercity 225 (electric).
Predicting the performace of outdoor noise barriers
307
and the porous grassland have been modelled using the four-parameter model and the parameters listed in Table 5.1. The results for the Intercity 125 train demonstrate that the performance of the plane screen barrier is stable throughout the entire passage of the train. The average performance of the T-shape barrier is superior to that of the plane screen; however its dependence upon the instantaneous spectrum of the emitted noise is more pronounced. Although the average performance of the ‘spiky top’ barrier is similar or lower to that of the plane screen during the pass-by, the variation in the performance of this barrier during the pass-by is considerable. With the Intercity 225 train pass-by spectral variation, the insertion loss for the plane screen is inferior, but remarkably stable in comparison with the more complex barrier shapes. The fluctuation in the insertion loss of the ‘spiky top’ barrier is between 5 and 7 dB with a maximum fluctuation around the time of the train arrival and departure. This level of fluctuations might be perceived to be more significant than the predicted gain of between 1 and 2 dB in the average barrier performance. These effects may need to be given careful consideration when the efficiency of expensive railway noise barriers is assessed.
References 1 A.Sommerfeld, Mathematische Theorie der Diffraktion, Math. Ann., 47:317–341 (1896). 2 M.Born and E.Wolf, Principles of Optics, Electromagnetic Theory of Propagation, Interference and Diffraction of Light, Pergamon Press, Cambridge, UK (1975). 3 H.S.Carslaw, Some multiform solutions of the partial differential equations of physical mathematics and their applications, P. Lond. Math. Soc., 30:121–161 (1899). 4 H.S.Carslaw, Diffraction of waves by a wedge of any angle, P. Lond. Math. Soc., 18: 1291–1306 (1920). 5 H.M.MacDonald, A class of diffraction problems, P. Lond. Math. Soc., 14:410–427 (1915). 6 E.T.Copson, On an integral equation arising in the theory of diffraction, Q.J. Math., 17:19–34 (1946). 7 H.Levine and J.Schwinger, (a) On the theory of diffraction by an aperture in an infinite plane screen. J, Phys. Rev., 74:958–974 (1948) (b) On the theory of diffraction by an aperture in an infinite plane screen. II, Phys. Rev., 75:1423–1432 (1949). 8 D.G.Crighton, A.P.Dowling, J.E.Ffowcs Williams, M.Heckl and F.G.Leppington, Modern Methods in Analytical Acoustics Lecture Notes, Springer-Verlag, London, Ch. 5 (1996). 9 M.C. M.Wright (ed.), Lecture Notes on the Mathematics of Acoustics, Part II, Ch. 5, Imperial College Press, London (2005). 10. I.Tolstoy, Diffraction by a hard truncated wedge and a strip, IEEE J. Ocean Eng., 14:4– 16(1989). 11 I.Tolstoy, Exact, explicit solutions for diffraction by hard sound barriers and seamounts, J. Acoust. Soc. Am., 85:661–669 (1989). 12 J.J.Bowman and T.B.A.Senior, Electromagnetic and Acoustic Scattering by Simple Shapes, edited by J.J.Bowman, T.B.A.Senior and P.L.E.Uslenghi, North-Holland, Amsterdam (1969) (revised edition, Hemisphere Publishing Corp., New York, 1987). 13 W.J.Hadden and A.D.Pierce, Sound diffraction around screens and wedges for arbitrary pointsource locations, J. Acoust. Soc. Am., 69(5):1266–1276 (1981). See also the Erratum, J. Acoust. Soc. Am., 71:1290 (1982). 14 E.Hecht, Optics, Addison-Wesley Publishing Company, Wokingham, fifth edition (1998). 15 E.J.Skudrzyk, The Foundations of Acoustics, Springer-Verlag, New York (1971).
Predicting outdoor sound
308
16 T.F.W.Embleton, Line integral theory of barrier attenuation in the presence of the ground, J. Acoust. Soc. Am., 67:42–45 (1980). 17 G.M.Jebsen and H.Medwin, On the failure of the Kirchhoff assumption in backscatter, J. Acoust. Soc. Am., 72:1607–1611 (1982). 18 S.W.Redfearn, Some acoustical source-observer problems, Philos. Mag., 30:223–236 (1940). 19 Z.Maekawa, Noise reduction by screens, Appl. Acoust., 1:157–173 (1968). 20 E.J.Rathe, Note on two common problems of sound propagation, J. Sound Vib., 10: 472–479 (1969). 21 U.J.Kurze and G.S.Anderson, Sound attenuation by barriers, Appl. Acoust., 4:35–53 (1971). 22 U.J.Kurze, Noise reduction by barriers, J. Acoust. Soc. Am., 55:504–518 (1974). 23 J.B.Keller, The geometrical theory of diffraction, J. Opt. Soc. Am., 52:116–130 (1962). 24 R.B.Tatge, Barrier-wall attenuation with a finite sized source, J. Acoust. Soc. Am., 53: 1317–1319 (1973). 25 K.Yamamoto and K.Takagi, Expressions of Maekawa’s chart for computation, Appl. Acoust., 37:75–82 (1992). 26 P.Menounou, A correction to Maekawa’s curve for the insertion loss behind barriers, J. Acoust. Soc. Am., 110:1828–1838 (2001). 27 T.Isei, T.F.W.Embleton and J.E.Piercy, Noise reduction by barriers on finite impedance ground, J. Acoust. Soc. Am., 67:46–58 (1980). 28 J.Nicolas, T.F.W.Embleton and J.E.Piercy, Precise model measurements versus theoretical prediction of barrier insertion loss in presence of the ground, J. Acoust. Soc. Am., 73:44–54 (1983). 29 E.M.Salomons, Reduction of the performance of a noise screen due to screen-induced windspeed gradients. Numerical computations and wind tunnel experiments, J. Acoust. Soc. Am., 105:2287–2293 (1999). 30 Y.W.Lam and S.C.Roberts, A simple method for accurate prediction of finite barrier insertion loss, J. Acoust. Soc. Am., 93:1445–1452 (1993). 31 A.L’Espérance, The insertion loss of finite length barriers on the ground, J. Acoust. Soc. Am., 86:179–183 (1989). 32 R.Pirinchieva, Model study of the sound propagation behind barriers of finite length, J. Acoust. Soc. Am., 87:2109–2113 (1990). 33 H.Medwin, Shadowing by finite noise barriers, J. Acoust. Soc. Am., 69:1060–1064 (1981). 34 A.Muradali and K.R.Fyfe, A study of 2D and 3D barrier insertion loss using improved diffraction-based methods, Appl. Acoust., 53:49–75 (1998). 35 G.R.Watts, Effects of sound leakage through noise barriers on screening performance, 6th International Congress on Sound and Vibration, Copenhagen, Denmark, 2501–2508 (1999). 36 H.Y.Wong and K.M.Li, Prediction models for sound leakage through noise barriers, J. Acoust. Soc. Am., 109:1011–1022 (2001). 37 S.I.Thomasson, Diffraction by a screen above an impedance boundary, J. Acoust. Soc. Am., 63:1768–1781 (1978). 38 K.B.Rasmussen, A note on the calculation of sound propagation over impedance jumps and screens, J. Sound Vib., 84(4):598–602 (1982). 39 A.D.Rawlins, Diffraction of sound by a rigid screen with an absorbent edge, J. Sound Vib., 47:523–541 (1976). 40 T.Isei, Absorptive noise barrier on finite impedance ground, J. Acoust. Soc. Jpn. (E), 1:3–9 (1980). 41 K.Fujiwara, Noise control by barriers, Appl Acoust., 10(2):147–159 (1977). See also part II of this paper K.Fujiwara, Y.Ando and Z.Maekawa, Noise control by barriers—part 2: noise reduction by an absorptive barrier, Appl. Acoust., 10(3): 167–179 (1977). 42 A.L’Espérance, J.Nicolas and G.A.Daigle, Insertion loss of absorbent barriers on ground, J. Acoust. Soc. Am., 86:1060–1064 (1989).
Predicting the performace of outdoor noise barriers
309
43 V.E.Ostashev and G.H.Goedecke, Interference of direct and ground-reflected waves in a turbulent atmosphere, Proceedings of the eigth LRSPS, Penn State, 313–325 (1998). 44 S.I.Hayek, Mathematical modeling of absorbent highway noise barriers, Appl. Acoust., 31:77–100 (1990). 45 W.E.Scholes, A.C.Salvidge and J.W.Sargent, Field performance of a noise barrier, J. Sound Vib., 16:627–642 (1971). 46 E.M.Salomons, Diffraction by a screen in downwind sound propagation: a parabolicequation approach, J. Acoust. Soc. Am., 95:3109–3117 (1994). 47 K.B.Rasmussen, Sound propagation over screened ground under upwind conditions, J. Acoust. Soc. Am., 100:3581–3586 (1996). 48 R.G.Kouyoumjian and P.H.Pathak, A uniform geometrical theory of diffraction for an edge in a perfectly conducting surface, Proc. IEEE (Communications and radar), J. Sound Vib., 62:1448–1461 (1974). 49 A.Muradali and K.R.Fyfe, Accurate barrier modeling in the presence of atmosphere effects, Appl Acoust., 56:157–182 (1999). 50 K.M.Li and Q.Wang, A BEM approach to assess the acoustic performance of noise barriers in the refracting atmosphere, J. Sound Vib., 211:663–681 (1998). 51 S.Taherzadeh, K.M.Li and K.Attenborough, A hybrid BIE/FFP scheme for predicting barrier efficiency outdoors, J. Acoust. Soc. Am., 110:918–924 (2001). 52 G.A.Daigle, Diffraction of sound by a noise barrier in the presence of atmospheric turbulence, J. Acoust. Soc. Am., 71:847–854 (1982). 53 J.Forssen and M.Ogren, Thick barrier noise-reduction in the presence of atmospheric turbulence: measurements and numerical modeling, Appl. Acoust., 63:173–187 (2002). 54 J.Forssén, Calculation of noise barrier performance in a turbulent atmosphere by using substitute-sources above the barrier, Acust. Acta Acust., 86:269–275 (2000). 55 J.Forssén, Calculation of noise barrier performance in a three-dimensional turbulent atmosphere using the substitute-sources method, Acust. Acta Acust., 88:181–189 (2002). 56 E.Premat and Y.Gabillet, A new boundary-element method for predicting outdoor sound propagation and application to the case of a sound barrier in the presence of downward refraction, J. Acoust. Soc. Am., 108(6):2775–2783 (2000). 57 Y.W.Lam, A boundary element method for the calculation of noise barrier insertion loss in the presence of atmospheric turbulence, Appl Acoust. 65(6):583–603 (2004). 58 K.E.Gilbert, R.Raspet and X.Di, Calculation of turbulence effects in an upward refracting atmosphere, J. Acoust. Soc. Am., 87:2428–2437 (1990). 59 K.B.Rasmussen and M.G.Arranz, The insertion loss of screens under the influence of wind, J. Acoust. Soc. Am., 104(5):2692–2698 (1998). 60 T.Van Renterghem, E.M.Salomons and D.Botteldooren, Efficient FDTD-PE model for sound propagation in situations with complex obstacles and wind profiles, Acust. Acta Acust. (in press). 61 L.S.Wirt, The control of diffracted sound by means of thnadners (shaped noise barriers), Acustica, 42:73–88 (1979). 62 S.S.T.Ho, I.J.Busch-Vishniac and D.T.Blackstock, Noise reduction by a barrier having a random edge profile, J. Acoust. Soc. Am., 101:2669–2676 (1997). 63 W.Shao, H.P.Lee and S.P.Lim, Performance of noise barriers with random edge profiles, Appl. Acoust., 62:1157–1170 (2001). 64 D.N.May and M.M.Osman, (a) The performance of sound absorptive, reflective, and T-profile noise barriers in Toronto, J. Sound Vib., 71:65–71 (1980). (b) Highway noise barriers—new shapes, J. Sound Vib., 71:73–101 (1980). 65 D.A.Hutchins, H.W.Jones and L.T.Russell, (a) Model studies of barrier performance in the presence of ground surfaces. Part I—thin, perfectly reflecting barriers, J. Acoust. Soc. Am., 75:1807–1816 (1984). (b) Model studies of barrier performance in the presence of ground surfaces. Part II—different shapes, J. Acoust. Soc. Am., 75: 1817–1826 (1984).
Predicting outdoor sound
310
66 D.C.Hothersall, D.H.Crombie and S.N.Chandler-Wilde, The performance of T-profile and associated noise barriers, Appl. Acoust., 32:269–287 (1991). 67 B.J.Jin, H.S.Kim, H.J.Kang and J.S.Kim, Sound diffraction by a partially inclined noise barrier, Appl. Acoust., 62:1107–1121 (2001). 68 T.Okubo and K.Fujiwara, Efficiency of a noise barrier on the ground with an acoustically soft cylindrical edge, J. Sound Vib., 216:771–790 (1998). See also T.Okubo and K.Fujiwara, Efficiency of a noise barrier with an acoustically soft cylindrical edge for practical use, J. Acoust. Soc. Am., 105:3326–3335 (1999). 69 C.Wassilieff, Improving the noise reduction of picket barriers, J. Acoust. Soc. Am., 84: 645–650 (1988). 70 R.Lyons and B.M.Gibbs, Investigation of open screen acoustic performance, Appl. Acoust., 49(3):263–282 (1996). 71 E.B.Viveiros, B.M.Gibbs and S.N.Y.Gerges, Measurement of sound insulation of acoustic louvers by an impulse method, Appl. Acoust., 63:1301–1313 (2002). 72 G.R.Watts, D.C.Hothersall and K.V.Horoshenkov, Measured and predicted acoustic performance of vertically louvred noise barriers, Appl. Acoust., 632:1287–1311 (2001). 73 T.Ishizuka and K.Fujiwara, Performance of noise barriers with variable edge shape and acoustical conditions, Appl. Acoust., 65:125–141 (2004). Reprinted with permission from Elsevier. 74 P.A.Morgan, D.C.Hothersall and S.N.Chandler-Wilde, Influence of shape and absorbing surface—a numerical study of railway noise barriers, J. Sound Vib., 217: 405–417 (1998). 75 British Standard BS EN 1793–3, Road traffic noise reducing devices—test methods for determining the acoustic performance. Part 3—normalized traffic noise spectrum (1998). 76 K.V.Horoshenkov, S.Rehman and S.J.Martin, The influence of the noise spectra on the predicted performance of railway noise barriers, CD-ROM Proceedings of the 9th International Congress on Sound and Vibration, Orlando, USA, July (2002). 77 P.A.Morgan, Boundary element modelling and full scale measurement of the acoustic performance of outdoor noise barriers, PhD Thesis, University of Bradford, November (1999). 78 D.Duhamel, Efficient calculation of the three-dimensional sound pressure field around a noise barrier, J. Sound Vib., 197(5):547–571 (1996).
Chapter 10 Predicting effects of vegetation, trees and turbulence 10.1 Effects of vegetation and crops on excess attenuation spectra The only published information on the effect of crops on sound propagation is that collected by Aylor [1] over maize and hemlock. In discussing his data, Aylor concentrated on the extra attenuation of sound at higher frequencies associated with the presence of crops, rather than on their influence on ground effect. In section 10.2 we discuss these data for higher frequency (>1 kHz) attenuation of sound through crops. In this section we demonstrate, on the basis of measurements at fairly short ranges, that the presence of plants appears to disturb the ground effect (<1 kHz). First we consider the observed effects on short-range measurements of excess attenuation using a source-receiver geometry that might be used for ground impedance deduction (see Chapter 4). Compare the excess attenuation spectra measured with source and receiver at 0.1 m height and separated by 1 m over grassland and a cultivated surface shown in Figures 10.1 and 10.2. The grass site was part of a well-kept lawn-like plot. The cultivated area was a seedbed (evesham series clay) with a fairly rough surface containing sparse emerging bean plant seedlings. The spectra in Figure 10.1(b) appear to be more ‘ragged’ than those in Figure 10.1(a). In this case the surface roughness might be contributing to this ‘raggedness’ as well as the plants. Figure 10.3 shows short-range measurements using the same geometry in a wheat field. The wheat plants were 0.55 m high so that source and receiver were below the plant tops. The presence of crops appears to influence the coherence of the ground-reflected sound so that the relatively ‘clean’ destructive interference that is evident, for example in the relative SPL spectrum above grass (Figure 10.1(a)) is disrupted as well as being altered in magnitude and frequency. Next we consider such effects at a little longer range. Figure 10.3 shows relative sound level spectra deduced from measurements at 1, 10 and 20 m range over medium clay soil containing oil seed rape plants which were approximately 1 m high and had recently flowered. The centre of the Electro-Voice loudspeaker source was at 1.65 m height. At 10 and 20 m range, the microphones were placed at 1.2 m height. The excess attenuation at
Predicting outdoor sound
312
Figure 10.1 Excess attenuation spectra obtained with (point) source and receiver at 0.1 m height and separated by 1 m (a) over established grass and (b) over a seed bed containing bean plants. Each graph shows the results of two consecutive measurements.
Figure 10.2 Excess attenuation spectra obtained from two consecutive measurements with (point) source and receiver at 0.1 m height and separated by 1 m in 1 m high wheat. 10 and 20 m has been deduced from the level measured at 1 m range (source and receiver height=1.65 m) after allowing for spherical spreading only. Using a hand-held anemometer, it was observed that the wind speed was <2 m/s during the measurements. This implies that the effects of wind gradients and of any change in wind gradients between measurements can be ignored at the relatively small ranges of interest.
Predicting effects of vegetation, trees and turbulence
313
The variation in the data below 200 Hz is spurious and probably caused by high background noise. The measured main ground effect dip (excess attenuation maximum) occurs between 200 and 600 Hz for both ranges, being slightly greater at 10 m. The
Figure 10.3 Measured sound levels relative to that at 1 m obtained at 10 m (solid line) and 20 m (broken line) from a loudspeaker source over 1 m high oil-seed rape plants at the Silsoe Research Institute, Beds.
Figure 10.4 Predicted excess attenuation spectra at 10 m (solid line) and 20 m (broken line) over a surface with impedance given by the values shown in Figure 10.5.
Predicting outdoor sound
314
measured excess attenuation at frequencies above 1500 Hz at 20 m tends to be greater than that at 10 m. Figure 10.4 shows predictions of the excess attenuation (excluding turbulence and atmospheric absorption) at 10 and 20 m over a surface with the average impedance shown in Figure 10.5 obtained from data taken at the edge of the field where there were no plants. Referring to Figure 10.4, first it should be noted that below 200 Hz, the 20 m data is unreliable because of poor signal-to-noise ratio. However between 200 and 600 Hz,
Figure 10.5 Averaged relative impedance data deduced from complex excess attenuation measurements made at edge of oil seed rape field on 11 th July 1996. The point source and receiver were separated by a horizontal distance of 1 m. Source and receiver heights were respectively 0.2 m and 0.1 m. There were no oil seed rape plants in the area of the measurements. the measured data show that an increase in range from 10 to 20 m results in a slight reduction of the amplitude of the main ground effect dip (excess attenuation maximum) whereas the predictions obtained with the measured (bare soil) impedance show a distinctly contrary effect. Since turbulence has relatively little effect below 500 Hz, at these short ranges, it is likely that scattering by vegetation is the cause of the measured decrease in the main dip. The measured data at 20 m departs from the predicted behaviour also above 2000 Hz. At these frequencies turbulence and air absorption may be factors. However, another possibility is the attenuation caused by the plant foliage. This will be discussed in the next section.
Predicting effects of vegetation, trees and turbulence
315
10.2 Propagation through trees and tall vegetation A typical statement in many noise control texts is that ‘Trees and hedges are not effective noise barriers’ [2]. There is increasing evidence that this is not always true. For example, measurements [3] made with broadband source 2 m high and receiver height 1.5 m through 500 m of coniferous woodland have shown significant extra attenuation compared with CONCAWE predictions (see Chapter 12) particularly in 63 Hz (3.2 dB), 125 Hz (9.7 dB), 2 kHz (21.7 dB) and 4 kHz (24.7 dB) octave bands. Indeed the United States Department of Agriculture National Agroforestry Center [4] has suggested guidelines for the planting of trees and bushes for noise control based on extensive data collected in the 1970s [5]. A mature forest may have three types of influence on penetrating sound [6–8]. First is ground effect. This is particularly significant if there is a thick litter layer of partially decomposing vegetation on the forest floor. This forms a thick highly porous layer with rather low flow resistivity lying, usually, on higher flow resistivity soil, and gives rise to a primary excess attenuation maximum at lower frequencies than observed over typical grassland. This is consistent with the data collected over ranges of 500 m [3] and is similar to the effect, mentioned earlier, over snow. In respect of traffic noise, an unfortunate consequence of the lower-frequency ground effect is that many existing tree belts alongside roads do not offer much additional attenuation compared with the same distances over open grassland. A Danish study, which has been the basis for the foliage correction in ISO-9613 part 2, found relative attenuation of only 3 dB in the A-weighted Leq due to traffic noise for tree belts between 15 and 41 m wide [9]. On the other hand, through 100 m of red pine forest, Heisler et al. [10] have found 8 dB reduction in the A-weighted Leq due to road traffic compared with open grassland. The edge of the forest was 10 m from the edge of the highway and the trees occupied a gradual downward slope from the roadway extending about 325 m in each direction along the highway from the measurement site. In the United Kingdom, an extra reduction of 6 dB in the A-weighted L10 level due to traffic noise through 30 m of dense spruce has been found compared with the same depth of grassland [11]. This study found also that the effectiveness of the vegetation was greatest closest to the road. A relative reduction of 5 dB in the A-weighted L10 level was found after 10 m of vegetation. If (a) there is sufficient coherency between ground-reflected and direct sound through the belt, and (b) there is no leaf litter and the belt is not particularly wide, the lowfrequency destructive interference resulting from the relatively soft ground between the trees is likely to be similar to that over grassland and associated with a constructive interference maximum at important frequencies (near 1 kHz) for traffic noise. On the other hand, for a narrow tree belt to give extra attenuation of traffic noise compared with the same width of grassland, it is important that the extra attenuation through scattering is significant. Physical conditions that will achieve these requirements are discussed later. Price et al. [6] have measured spectra of the difference in high-frequency levels between microphones at 2 m and various distances through three different woodlands (mixed deciduous, spruce monoculture and mixed coniferous) using a two-way loudspeaker source of broadband random noise. They corrected their data for wavefront spreading and air absorption. The mixed deciduous woodland contained alternating bands of mature Norway spruce (Picus abies) and oak. The oak had dense undergrowth consisting of hawthorn (Crataegus monogyna), rose and honey suckle. The spruce monoculture
Predicting outdoor sound
316
contained trees uniformly between 11 and 13 m height, with dead branches only below 4 m. The third woodland consisted of a young mixed coniferous stand containing alternate rows of red cedar, Norway spruce and Corsican pine (Pinus nigra). There was foliage along the whole length of the pine trunks, that is, down to ground level. The wind speed and direction and temperature at two heights were recorded for each measurement. Measurements were carried out only on days with little or no measurable wind (<1.5 m/s) or temperature gradients. Measurements were taken at 1.2 m high receivers positioned 12, 24, 48 and 72 m from the loudspeaker source of broadband sound, with the centre of its low-frequency cone at 1.3 m height, in the mixed deciduous wood; 12, 24, 48 and 96 m range in the spruce monoculture and 12, 24, 26 and 40 m in the mixed conifers. Data were averaged over three receiver positions at a given range (laterally displaced by ±0.5 m from a central location) and each measurement represented a time average over approximately 90 s. Huisman et al. [7, 8] have measured the excess attenuation through woodland consisting of a 29-years-old monoculture of Austrian pines (Pinus nigra subsp. nigra) located in an area (polder) reclaimed from the sea in the Netherlands. A loudspeaker, with its centre at a height of 1 m, was used as the source of swept sine waves, and simultaneous measurements were made of wind and temperature gradients. Receivers were 100 m from the source and at three different heights (1 m, 2.5 m and 4.5 m). Figure 10.6 shows the spectra of measured level difference and excess attenuation respectively (a) for two woodlands with receiver separations of 48 and 96 m and (b) for the pine forest at receivers 1, 2.5 and 4.5 m high placed at a horizontal distance of 100 m. Also shown are corresponding predictions of ground effect. Ground effect alone predicts the frequency and receiver-height dependence of the data up to approximately 1 kHz. At higher frequencies the data have significantly different magnitudes and frequency dependence to those predicted by ground effect alone. This can be attributed (a) to scattering of the sound out of the path between source and
Figure 10.6 (a) Level difference spectral data [6] obtained in mixed conifers with receiver separation of 48 m (boxes) and a spruce monoculture at a separation of 96 m (circles) (b) excess attenuation data [7] obtained at three different receiver heights (boxes=4.5 m,
Predicting effects of vegetation, trees and turbulence
317
circles=2.5 m, diamonds=1 m), 100 m from a loudspeaker source in a pine forest. Corresponding ground effect predictions, shown as continuous and broken lines, have made use of a 2-parameter variable porosity model (see Chapter 3) with parameters of 15 kPa s m−2, −30 m−1 and 7.5 kPa s m−1, 50 m−1 respectively. receiver by trunks and branches and (b) to attenuation of the sound by viscous friction in the foliage. Much of the data shows the foliage attenuation to be dominant. Price et al. [6b] give their results in dB 25 m−1. However, to enable comparison with empirical prediction schemes, the results have been amended to dB m−1 in Figure 10.7(a). These data suggest approximately linear relationships between attenuation and either distance or log(frequency). The attenuation rates measured through the coniferous sites are rather greater than through the mixed deciduous wood even in summer. Above 1500 Hz, all of the measured attenuation rates are significantly greater than predicted for foliage according to ISO9613–2 (see Chapter 12, section 2), shown as the broken line in Figure 10.7(a). Figure 10.7(a) also shows empirical fits (for frequencies >1 kHz) given by Attenuation in dB m−1 through mixed conifers=0.7(log f)−2.03
(10.1)
Attenuation in dB m−1 through mixed oak and spruce (summer) =0.4(log f)−1.2
(10.2)
Attenuation in dB m−1 through spruce monoculture=0.26(log f)−0.75.
(10.3)
Figure 10.7 (a) Measured variation of corrected level difference with frequency above 1 kHz through three woodlands: mature
Predicting outdoor sound
318
mixed deciduous forest in summer (circles), Norway spruce monoculture (diamonds) and a mixed conifers (boxes) [6]. Also shown are empirical best-fit equations (solid and broken lines) and the predicted foliage attenuation according to ISO9613–2 (broken line), (b) Measured excess attenuation through 100 m of pine forest for three different receiver heights; 4.5 m (boxes), 2.5 m (circles), 1 m (diamonds) and mean values (crosses). The continuous line represents a straight line fit to a restricted portion (2 kHz500 Hz)
(10.5)
Attenuation in dB m−1 through reeds=2.3(log f)−12.2 (f>2 kHz).
(10.6)
Note that the attenuation measured at 250 Hz through the corn is likely to be influenced by ground effect, whereas that measured at 4000 Hz was influenced by background noise. Again these attenuation data imply higher rates of attenuation than predicted by the foliage correction in ISO9613–2 (see Chapter 11), shown as joined diamonds in Figure 10.8. Analytical modelling of propagation through trees and tall vegetation has been of interest to several authors. Bullen and Fricke [13] developed a diffusion model for sound intensity which involves adjustable parameters for scattering and absorption cross-
Predicting effects of vegetation, trees and turbulence
319
sections. Embleton [14] was first to suggest the use of Twersky’s multiple-scattering theory [15] for propagation through an idealized array of identical parallel impedancecovered cylinders to explain attenuation through forests. The propagation constant (kb) through the array of cylinders may be deduced from
(10.7) where N is the average number of cylinders per unit area normal to their axes, k=2πf/c0, g and g′ are forward and backward scattering amplitudes given, respectively, by
Figure 10.8 Measured variation of attenuation with frequency through corn (circles) and reeds (boxes) [1] and linear fits (solid and broken lines respectively). Also shown (joined diamonds) is the attenuation due to foliage predicted by ISO 9613–2. An are scattering coefficients given by
An=[iJn(ka)+ZJ′(ka)]/[iHn(ka)+ZH′(ka)] (10.8)
Predicting outdoor sound
320
where Z is the surface normal impedance of the cylinder of radius a and Jn and Hn are Bessel and Hankel functions of the first kind and order n: primes indicate derivatives. Price et al. [6] modelled each of the three woodlands that they investigated as an array of large cylinders (trunks) with finite impedance plus an array of small rigid cylinders (branches and foliage) over an impedance ground. As a first approximation Price et al. simply added the attenuations calculated for the large cylinders, the small cylinders and the ground. Their calculations are in qualitative agreement with their measurements but they found it necessary to adjust several parameters to obtain quantitative agreement. The theory due to Twersky, used by Embleton et al. describes the energy of the squared mean rather than the quadratic mean of the transmitted of the transmitted sound field energy The latter is the value of interest since it characterizes the global attenuation [16]. Twersky’s approach neglects the incoherent scattering between cylinders and thus introduces an error which is of importance at high frequency. Laboratory experiments with wooden dowel rods as scatterers [6b] have indicated that the multiple-scattering results (equations (10.15) and (10.16)) tend to over-predict the attenuation and that an empirical reduction in the known density by 60% is required to obtain agreement with data. It has been shown that, after the empirical correction and parameter adjustment, scattering theory (e.g. equation (10.15)) for the sum of two independent cylinder arrays predicts attenuation rates comparable to the measured values. However, these predictions give rise to a non-linear behaviour with log(frequency), similar to that shown in Figure 10.7(b), whereas the data such as those in Figure 10.7(a) are fitted fairly well by linear relationships. Such linear relationships with log(frequency) and with concentration are predicted and measured for sound attenuation through aerosols containing wide particle size distributions [17]. Huisman et al. [7, 8] used a stochastic particle-bounce approach to model attenuation and reverberation through an array of parallel cylinders. In conjunction with a ground effect model and an assumption about the dependence of the proportion of incoherent scattering on distance and frequency, good agreement was obtained with data from a pine forest. Another important result of this work was that even at 100 m through trees, the sound field is mainly formed by the direct and ground-reflected fields and the contribution of the reverberant field is minimal. This argues against modelling sound propagation through trees as a diffusion phenomenon. Past work considering the scattering mechanism (a) has been restricted to infinitely long cylindrical scatterers with ‘best-fit’ dimensions; (b) has represented surface absorption as an ‘effective’ impedance, which is a relatively crude way of describing scattering losses; (c) has assumed that scattering and ground effects are simply additive and (d) has largely ignored meteorological effects. Attenuation rates through trees, tall crops and other vegetation remain somewhat uncertain both as a result of lack of data and deficiencies in propagation modelling. Improvement in multiple-scattering models of attenuation through leaves or needles might result from more sophisticated treatment of the boundary conditions or by allowing for scattering by shapes other than infinite cylinders. Attenborough and Walker [18] have formulated a model for viscous and thermal scattering in an array of parallel semi-infinite cylinders with radii much smaller than a wavelength. In the case of corn and wheat plants, there are a large number of long ribbon-like leaves that scatter sound. A ribbon may be modelled as an elliptic cylinder with a minor axis of length approaching zero.
Predicting effects of vegetation, trees and turbulence
321
Another possibility is to treat leaves as oblate spheroids with a minor axis approaching zero. A further possibility is to treat the foliage as a suspension in the visco-inertial regime for scattering by sound with wavelengths significantly larger than the maximum dimensions of the ‘particles’ and amenable to a coupled-phase approach [19]. Several researchers have considered the possibility that resonance induced in the leaves and branches may affect sound propagation [20–22]. However, there are few data to suggest that the resonance mechanism is as important as the others discussed previously.
10.3 Meteorological effects on sound transmission through trees Compared with open grassland, Huisman [8] has predicted an extra attenuation of 10 dB(A) for road traffic noise through 100 m of pine forest. He has remarked also that whereas downward-refracting conditions lead to higher sound levels over grassland, the levels in woodland are comparatively unaffected. This suggests that extra attenuation obtained through use of trees should be relatively robust to changing meteorology. Defrance et al. [23] have presented results from both numerical calculations and outdoor measurements and have compared them for different meteorological situations. Their numerical method is based on a Green’s Fast Parabolic Equation (GFPE) method. A 2-D GFPE code has been developed [24] and adapted to road traffic noise situations [25] where road line sources are modelled as series of equivalent point sources of height 0.5 m. To allow for the non-uniform wind conditions due to the forest, GFPE calculations were made for each equivalent point source by projecting the wind profile on the sourcereceiver direction (see Figure 10.9). For each equivalent source, the acoustic field was initialized by an analytical expression [26] on a vertical axis containing the source point, and then propagated step by step to the receiver. The experimental values were obtained through a pine forest with an average tree height of 11.83 m, an average circumference of 53.1 cm and a density of 0.1078 trunks m−2. For different range-dependent sound speed profiles (downwardrefracting, homogeneous or upward-refracting situations), the acoustic attenuation between highway source and receivers at 150 m distance, that is on the other side of the 100 m wide forest, was compared with that obtained in the absence of the trees. During the measurement period, the mean flow was of 2200 vehicles per day, for each of the two lanes, with 5% of heavy trucks. The mean speed of light vehicles was 85 km h−1. The data showed a reduction in A-weighted Leq due to the trees of 3 dB during downwardrefracting conditions, 2 dB during homogeneous conditions and 1 dB during upwardrefracting conditions.
Predicting outdoor sound
322
Figure 10.9 Range-dependent sound speed profiles used in simulations by Defrance et al. [23]. The rectangle shows the region occupied by trees. Reprinted with permission from ICSV 9 Procs, Orlando, 2002.
Figure 10.10 Predicted acoustical efficiency of a 100 m wide and 10.5 m high pine forest relative to the situation without forest, in dB(A), in the case of: (a) typical day
Predicting effects of vegetation, trees and turbulence
323
temperature profile (unfavourable to propagation), (b) typical night temperature profile (favourable) and (c) typical downwardrefracting situation with a positive gradient wind speed profile (favourable) [23]. Reprinted with permission from ICSV 9 Procs, Orlando, 2002. The numerical predictions shown in Figure 10.10 suggest that in downward-refracting conditions, the extra attenuation due to the forest is between 2 and 6 dB(A) with the receiver at least 100 m away from the road. In upward-refracting conditions, the adapted GFPE model predicts that the forest may increase the received sound levels somewhat at large distances. But this prediction is not important in practice since the levels predicted at sufficiently large distances during upward refraction are relatively low anyway. In homogeneous conditions, it is predicted that sound propagation through the forest is not affected significantly by meteorology but only by the scattering by trunks and foliage. Similar work has been carried out recently [27], again using a numerical prediction scheme in this case based on the GFPE, with allowance for a large wind speed gradient through foliage and assuming effective wave numbers deduced from multiple-scattering theory for scattering effects of trunks, branches and foliage. Again the model predicts that the wind speed gradient in the foliage tends to refract sound towards the ground and has a significant effect particularly during upwind conditions. However, neither this model nor the one due to Barriere et al. includes turbulence effects or forest edge effects. Defrance et al. [23] have concluded that a forest strip of at least 100 m width appears to be a useful natural acoustic barrier. It should be noted, however that both the data and numerical simulations were compared to sound levels without the trees present, that is over ground from which the trees had been removed. This means that the ground effect both with and without trees would have been similar. As discussed previously, this is unlikely to be true when comparing the sound attenuating properties of forest and grassland.
10.4 Combined effects of vegetation, barriers and meteorology As discussed in Chapter 9, a significant problem for conventional noise barriers outdoors is their interaction with meteorological conditions. The presence of the barrier disturbs the airflow during wind. The altered wind profile in the vicinity of a barrier will result in a worse performance, since wind speed gradients and intensity of turbulence become larger near the barrier. This results in an increased refraction of sound for downwind sound propagation, which will cause the shadow region behind a barrier to become smaller [28]. Besides this additional refraction caused by the screen, turbulence, including screen-induced turbulence, will also result in increased noise levels behind the barrier [29, 30]. However, the scattering by turbulence will mainly be observed in the deep shadow zone, where sound pressure levels are low. At large distances on the other hand, the superposition of scattered waves on diffracted waves will result in fluctuations
Predicting outdoor sound
324
of phase and amplitude, smoothing out interference patterns. For thin rectangular barriers and broadband traffic noise, these turbulence effects can be small in comparison with the screen-induced refraction, at some limited distances behind the noise barrier [31]. The effect of a row of trees (in leaf) behind a noise barrier in wind has been investigated by Van Renterghem and Botteldooren [32]. They compared measurements at a location with and without a row of trees behind a noise barrier continuously from the middle of the summer until fall. They found that for downwind locations and for an orthogonal incident wind, the efficiency of the noise barrier with trees was better than that of the noise barrier without trees. The improvement increases with increasing wind speed (Figure 10.11).
Figure 10.11 Measured average net efficiency (A-weighted level reduction) of a row of trees behind a noise barrier as a function of wind speed. The effect of the wind direction orthogonal to the noise barrier is shown, for both downwind and upwind sound propagation. The best-fit straight lines to these data are shown. The error bars indicate the standard error of mean for each wind speed class [32]. Reprinted with permission from S.Hirzel & Verlag GmbH & Co.
Predicting effects of vegetation, trees and turbulence
325
The improvement by the trees is only slightly affected if the wind direction is not perfectly orthogonal to the barrier. Upwind sound propagation is affected only to a small degree by the presence of trees. Diffraction by the canopy of trees does not result in an increased total A-weighted sound pressure level due to the typical low-frequency spectrum of traffic noise. The contribution of wind-induced vegetation noise to the recorded noise levels can be neglected for highways with typical dense traffic.
10.5 Turbulence and its effects 10.5.1 Turbulence mechanisms There are two types of atmospheric instability responsible for the generation of turbulent kinetic energy: shear and buoyancy. Shear instabilities are associated with mechanical turbulence. High wind conditions and a small temperature difference between the air and ground are the primary causes of mechanical turbulence. Buoyancy or convective turbulence is associated with thermal instabilities. Such turbulence prevails when the ground is much warmer than the overlying air, as, for example, on a sunny day. The irregularities in the temperature and wind fields are directly related to the scattering of sound waves in the atmosphere. Sound propagating through a turbulent atmosphere will fluctuate both in amplitude and phase as a result of fluctuations in the refractive index caused by fluctuations in temperature and wind velocity. When predicting outdoor sound, it is usual to refer to these fluctuations in wind velocity and temperature rather than the cause of the turbulence. The amplitude of fluctuations in sound level caused by turbulence initially increase with increasing distance of propagation, sound frequency and strength of turbulence but reach a limiting value fairly quickly. This means that the fluctuation in overall sound levels from distant sources (e.g. line-of-sight from an aircraft at a few km) may have a standard deviation of no more than about 6 dB [33]. Turbulence can be visualized as a continuous distribution of eddies (see Figure 1.1) in time and space. The largest eddies can extend to the height of the boundary layer, that is, up to 1–2 km on a sunny afternoon. However, the outer scale of usual interest in sound propagation is of the order of metres. In the size range of interest, sometimes called the inertial subrange, the kinetic energy in the larger eddies is transferred continuously to smaller ones. As the eddy size becomes smaller, virtually all of the energy is dissipated into heat. The length scale, at which viscous dissipation processes begin to dominate for atmospheric turbulence, is about 1.4 mm. The size of eddies of most importance to sound propagation, for example in the shadow zone, may be estimated by considering Bragg diffraction [34]. For a sound with wavelength λ being scattered through angle θ, (see Figure 10.12), the important scattering structures have a spatial periodicity D satisfying λ=2D sin(θ/2). (10.9) At a frequency of 500 Hz and a scattering angle of 10°, this predicts a size of 4 m. When acoustic waves propagate nearly horizontally, the (overall) variance in the
Predicting outdoor sound
326
Figure 10.12 Bragg reflection condition for acoustic scatterin from turbulence. effective index of refraction temperature by [35]
is related approximately to those in velocity and
(10.10) where T, u′ and ν′ are the fluctuations in temperature, horizontal wind speed parallel to the mean wind and horizontal wind speed perpendicular to the mean wind respectively. is the angle between the wind and the wavefront normal. Use of similarity theory (see Chapter 1) gives [36]
(10.11) where u* and T* are the friction velocity and scaling temperature (=−Q/u*, Q being the surface temperature flux) respectively. Typically, during the daytime, the velocity term in the effective index of refraction variance always dominates over the temperature term. This is true, even on sunny days, when turbulence is generated by buoyancy rather than shear. Strong buoyant instabilities produce vigorous motion of the air. Situations where temperature fluctuations have a more significant effect on acoustic scattering than velocity fluctuations occur most often during clear still nights. Although the second term (the covariance term) in (10.11) could be at least as important as the temperature term [35], it is often ignored for the purpose of predicting acoustic propagation. Estimations of the fluctuations in terms of u* and T* and the Obukhov length L (see Chapter 1) are given by [37], for L>0 (stable conditions, for example at night)
Predicting effects of vegetation, trees and turbulence
327
for L<0 (unstable conditions, for example daytime)
For line-of-sight propagation, the mean-squared fluctuation in the phase of plane sound waves (sometimes called the strength parameter) is given by [38]
where X is the range and L is the inertial length scale of the turbulence. Alternatively, the variance in the log-amplitude fluctuations in a plane sound wave propagating through turbulence is given by [39]
where and are integral length scales and variances of temperature and velocity fluctuations respectively. 10.5.2 Models for turbulence spectra There are several models for the size distribution of turbulent eddies. In the Gaussian of the index of refraction is model of turbulence statistics, the energy spectrum given by
(10.12) where L is a single scale length (integral or outer length scale) proportional to the correlation length (inner length scale) ℓG, that is
Predicting outdoor sound
328
The Gaussian model has some utility in theoretical models of sound propagation through turbulence since it allows many results to be obtained in simple analytical form. However, as shown in the following discussion, it provides a poor overall description of the spectrum of atmospheric turbulence [38]. In the von Karman spectrum, known to work reasonably well for high Reynolds Number turbulence, the spectrum of the variance in index of refraction is given by
(10.13) where Figure 10.13 compares the spectral function given by the von Karman spectrum for and ℓK=1 m with two spectral functions calculated assuming a and ℓG=0.93 m Gaussian turbulence spectrum, respectively for and ℓG=0.1 m. The variance and inner length scale for the first Gaussian spectrum have been chosen to match the von Karman spectrum exactly for the low wavenumbers (larger eddy sizes). It offers a reasonable representation also near to the spectral peak. Past the spectral peak and at high wavenumbers, the first Gaussian spectrum decays far too rapidly. The second Gaussian spectrum clearly matches the von Karman spectrum over a narrow range of smaller eddy sizes. If this happens to be the wavenumber range of interest in scattering from turbulence, then the Gaussian spectrum may be satisfactory. Most recent calculations of turbulence effects on outdoor sound have relied on estimated or best-fit values rather than measured values of turbulence parameters. Under these circumstances, there is no reason to assume spectral models other than the Gaussian one. Typically, the high wavenumber part of the spectrum is the main contributor to turbulence effects on sound propagation. This explains why the assumption of a Gaussian spectrum results in best-fit parameter values that are rather less than those that are measured.
Predicting effects of vegetation, trees and turbulence
329
Figure 10.13 A von Karman spectrum of turbulence and two Gaussian spectra chosen to match it at low wavenumbers and over a narrow range of high wavenumbers respectively. 10.5.3 Clifford and Lataitis’ approach for calculating the influence of turbulence on ground effect According to the classical Weyl-Van der Pol formula (see Chapter 2 (2.40)), the sound pressure field propagating from a point source above an impedance flat boundary is given by
(10.14) where k is the wavenumber, R1 and R2 are the direct and image path lengths respectively and Q is the complex spherical reflection coefficient. The mean-squared pressure at a receiver in a turbulent but acoustically neutral (no refraction) atmosphere may be written as [40, 41]
Predicting outdoor sound
330
(10.15) where θ is the phase of the reflection coefficient, (Q=|Q|eiθ), and T is the coherence factor determined by the turbulence effect. Hence the Sound Pressure Level, Lp, is given by
(10.16) For a Gaussian turbulence spectrum, the coherence factor, T, is given by [40]
(10.17) where σ2 is the variance of the phase fluctuation along a path and ρ is the phase covariance [41] between adjacent paths (e.g. direct and reflected).
(10.18) of the index of refraction, and L0 is the outer scale of turbulence. The coefficient A is given by: A=0.5 R>kL02 (10.19a) 2
or A=1.0 R
(10.20) where h is the maximum transverse path separation and erf (x) is the Error function defined by
Predicting effects of vegetation, trees and turbulence
331
(10.21) For a sound field consisting only of direct and reflected paths (which will be true at short ranges) in the absence of refraction, the parameter h is given by
(10.22) where hs and hr are the source and receiver heights respectively. Daigle [41] has found that half this value yields better agreement with data. When h→0, then ρ→1 and T→1. This will be the case near grazing incidence. For h→large, then T→maximum. This will be the case for greatly elevated source and/or receiver. When L0→∞, then T→1. If L0→0, then ρ→0 but T→1. The procedure for calculating the effects of turbulence on ground effect may be summarized as follows: 1 The outer scale of turbulence, L0, and the variance of the index of refraction, be determined from measurements using
may
where is the variance of the wind velocity, is the variance of the temperature fluctuations, α is the wind vector direction and C0 and T0 are the ambient sound speed and temperature respectively. Typical values are between 2×10⁻⁶ and 10−4 [38, 41]. A typical value of L0 is the source height. 2 Determine the phase covariance, ρ, from equations (10.20) to (10.22). 3 Evaluate the turbulence coherence factor, T, from equations (10.17) and (10.18). 4 Evaluate the mean-squared pressure and the sound pressure level from equations (10.15) and (10.16) respectively. Figure 10.14 shows example results of computations of excess attenuation using equations (10.15)–(10.22). Note that increasing turbulence reduces the depth of the main ground effect dip.
Predicting outdoor sound
332
10.5.4 Ostashev’s extensions of Clifford and Lataitis approach The method for incorporating turbulence effects in ground effect outlined in 10.5.3 is valid only for temperature fluctuations. Ostashev and Goedecke [42] have derived a more general version of the expression for the turbulence coherence factor, T, than that given by equations (10.18) to (10.22) for a Gaussian spectrum. Hence where is the extinction coefficient of the mean sound field due to is that due temperature fluctuations with the Gaussian spectrum and to wind velocity fluctuations.
(10.23)
Figure 10.14 Excess attenuation vs. frequency for a source and receiver above an impedance ground in acoustically neutral atmosphere for Source and receiver three values of heights are 1.8 and 1.5 m respectively, and the
Predicting effects of vegetation, trees and turbulence
333
separation is 600 m. The two-parameter impedance model (equation 3.33) has been used with values of 30,000.0 Nsm−4 and 0.0 m−1. Also Ostashev and Goedecke have derived the corresponding expression for a von Karman turbulence spectrum. 10.5.5 Inclusion of atmospheric turbulence in the fast field program The FFP formulation does not include the effect of turbulence. In a turbulent medium the complex sound field fluctuates in amplitude and phase. The time-averaged pressure squared is given in terms of the complex pressure and its complex conjugate
(10.24) The dot above a variable or parameter signifies its complex conjugate. The turbulence effect is described by equations (10.15) to (10.22) which assume a Gaussian spectrum of turbulence. The parameter h represents the maximum transverse separation between a pair of paths and depends on values of the wavenumber K for each wave component. An approximate formula for h between waves corresponding to values of Kn=nδK and Km=mδK is given by [43, 44]
(10.25)
where n′ is the integer corresponding to k0(=ω/c)=n′δK. In integral form the averaged pressure is given by
(10.26)
is now the average effect of the decorrelation in phase and amplitude The function between the wavenumber components K and Evaluating this time-averaged pressure is much more costly than the unperturbed pressure P. The computation of this expression becomes somewhat easier if one breaks the integral into its coherent and incoherent components
Predicting outdoor sound
334
The first integral is exp(−σ2) times the unperturbed mean pressure squared. The unperturbed pressure can be evaluated efficiently by the conventional FFP. This represents the coherent component reduced by the scattered energy. The second integral is the contribution of the scattered energy from one wavenumber to another. Evaluating this double integral is slightly faster since (T−exp(−σ2)) is only Moreover, once the integrals are approximated by discrete sums, the large for summation needs to be performed up to a value of K=k0. Therefore, this component must be evaluated as an n′×n′ double summation where n′ corresponds to the value of K nearest to k0. This is where the main computational effort is spent and the simplifying features of the FFT approximation are no longer available. One further complicating feature is that in order to obtain a converging sum, one needs to evaluate p(z, K) at many more points than was necessary in the conventional FFP (up to eight times more). and its conjugate are evaluated and output The complex kernel function, from an FFP. The first integral is evaluated by the FFP also. The second integral is evaluated by a simple double loop up to the value of n′. 10.5.6 Comparisons with experimental data An example comparison of predictions of the FFP including turbulence with single tone data obtained as a function of range in upward-refracting conditions is shown in Figure 10.15. The classical data shown were obtained upwind, that is during a strong negative wind speed gradient [12]. The source and the receiver heights were 3.66 m and 1.52 m respectively. A logarithmic wind speed profile has been deduced by Gilbert et al. [45] from the meteorological data. It is given by
(10.28) The agreement between the predictions from the FFP including turbulence and the data, while not perfect, represents a large improvement over the results of calculations without turbulence (shown by the solid line) and is similar to that with predictions given by Parabolic Equation method [45]. In the FFP computations a total of 400 layers were assumed with a ceiling of 100 m. A second comparison is with data obtained during tests using a fixed jet engine source (centre of exit nozzle at 2.16 m above ground) at a grass-covered airfield near Hucknall, Notts, UK. During these measurements there was a negative temperature gradient but no
Predicting effects of vegetation, trees and turbulence
335
discernible wind speed gradient. Figure 10.16(a) shows that the temperature profile can be approximated by a two-segment ‘linear’ profile T=22.0−0.1z z≤16.5 m T=20.55−0.0122z z>16.5 m.
Figure 10.15 A comparison of the FFP modified to include turbulence (joined circles) with data at 424 Hz (joined diamonds) out to 1.5 km range under upwind conditions (data from [46, figure 2]).
(10.29)
Predicting outdoor sound
336
Figure 10.16 (a) Measured and assumed temperature profiles for Hucknall data (b) measured wind speed profile in the direction of the line of microphones. Figure 10.16(b) shows that the measured wind speed had a large spread of values with height with a mean value ~4 ms−1. The lack of a clear wind gradient suggests a strongly turbulent atmosphere. For the corresponding predictions, the wind speed was assumed to be constant with height. Figure 10.17 compares the measured level difference between 6.4 m high microphones 152.4 m and 762 m from the Avon engine source. The lines represent four different 26second averages of measured data. The diamonds represent predictions of the FFP including effects of turbulence and the crosses represent predictions without turbulence. The agreement is reasonable. Turbulence appears to play a significant role at frequencies higher than 100 Hz. 10.5.7 Scattering by turbulence Apart from its degradation of ground effect, turbulence is important in the reduction of the deep shadows that would otherwise form behind barriers or during propagation in upward refraction conditions. The scattering of sound behind a noise barrier can be calculated by using the standard cross-section for scattering by atmospheric turbulence derived for application in remote (acoustic) sounding of the atmosphere.
Predicting effects of vegetation, trees and turbulence
337
Figure 10.17 Measured and predicted level difference spectra between horizontally separated positions at a height of 6.4 m and distances of 152.4 m and 762 m from a jet engine source at a height of 2.16 m. The diamonds are predictions of the FFP with turbulence at third octave centre frequency values (63 Hz–2 kHz) and lines represent four different 26 second averages of measured data. A Gaussian spectrum of turbulence was assumed with values of the variance of index and the outer scale of of refraction turbulence (L0) equal to 8.0×10⁻⁶ and 1.1 m respectively. The crosses represent FFP predictions without turbulence. The scattering cross-section σs (in reciprocal metres) as a function of scattering angle θs is given by
(10.30) where k0 is the initial wavenumber, is the structure parameter for refractive index fluctuations and is the structure parameter for velocity fluctuations [46].
Predicting outdoor sound
338
10.5.8 Measurement of turbulence The measurement of the effective refractive index variance requires measurement of wind velocity and temperature fluctuations. Three different instruments may be used to measure wind speed fluctuations. These are the cup anemometer, the hot wire anemometer and the sonic anemometer. Typically the cup anemometer has a response of the order of a second, whereas the sonic anemometer can give values every 0.2 s and the hot wire anemometer can give values every 0.01 s or faster. Temperature variation is monitored by means of thermometers (thermistors). The log-amplitude pressure variance of a spherical sound wave is given by
(10.31) is the effective structurewhere X is the source-receiver separation (range) and and temperature function parameter that combines the results of velocity fluctuations into a single parameter. Normally the effective structure-function parameter is assumed to have the form
(10.32)
where T0 is the average temperature, c0 is the average sound speed and av=4 [47] or av=22/3 [48]. Typically, the contribution of temperature fluctuations to is small so that
can be determined from cup and/or hot wire anemometer readings. One method of doing this uses readings from two sensors placed along the mean wind direction [49]. Hence
where the sensor spacing ∆r=U∆t, t is time and U is the mean wind speed.
Predicting effects of vegetation, trees and turbulence
339
References 1 D.E.Aylor, Sound transmission through vegetation in relation to leaf area density, leaf width and breadth of canopy, J.Acoust. Soc. Am., 51(1):411–414 (1972). 2 Sound control for homes pp. 9 (BRE/CIRIA 1993) BRE238, HMSO. 3 G.A.Parry, J.R.Pyke and C.Robinson, The excess attenuation of environmental noise sources through densely planted forest, Proc. Inst. Acoust, 15(3):1057–1065 (1993). 4 See ‘Leaf the Noise Out’ Inside Agroforestry, Spring 1998. 5 D.I.Cook and D.F.Van Haverbeke, Tree covered land forms for noise control, Univ. Nebr. Agric. Exp. Stat. Res. Bull, 263:47 (1974). 6 (a) M.A.Price, K.Attenborough and N.W.Heap, Sound attenuation through trees: measurements and models, J. Acoust. Soc. Am., 84(5): 1836–1844 (1988) and (b) ibid. Sound propagation results from three British woodlands, in Sound Propagation in Forested Areas and Shelterbelts, ed. M.Martens, University of Nijmegen, March 1986. 7 W.H.T.Huisman and K.Attenborough, Reverberation and attenuation in a pine forest, J. Acoust. Soc. Am., 90(5):2664–2667 (1991). 8 W.H.T.Huisman, Sound propagation over vegetation-covered ground, PhD Thesis, University of Nijmegen, The Netherlands (1990). 9 J.Kragh, Road traffic noise attenuation by belts of trees and bushes, Danish Acoustical Laboratory Report no. 31 (1982). 10 G.M.Heisler, O.H.McDaniel, K.K.Hodgdon, J.J.Portelli and S.B.Glesson, Highway noise abatement in two forests, Proc. NOISE-CON 87, PSU, USA. 11 L.R.Huddart, The use of vegetation for traffic noise screening, TRRL Research Report 238 (1990). 12 F.M.Weiner and D.N.Keast, Experimental study of the propagation of sound over ground, J. Acoust. Soc. Am., 31(6):724–733 (1959). 13 R.Bullen and F.Fricke, Sound propagation through vegetation, J. Sound Vib., 80(1): 11–23 (1982). 14 T.F.W.Embleton, Scattering by an array of cylinders as a function of surface impedance, J. Acoust. Soc. Am., 40(3):667–670 (1966). 15 V.F.Twersky, On scattering of waves by random distributions. I. Free-space scatterer formalism. J. Math. Phys., 3:700–715 (1962). 16 J.Defrance, N.Barrière and E.Premat, Forest as a meteorological screen for traffic noise, Proc. Ninth ICSV, Orlando (2002). 17 Q.Wang, K.Attenborough and S.R.Woodhead, Particle irregularity and aggregation effects in airborne suspensions at audio- and low ultrasonic frequencies, J. Sound Vib., 236(5):781–800 (2000). 18 K.Attenborough and L.A.Walker, Scattering theory for sound absorption in fibrous media J. Acoust. Soc. Am., 51(1):192–196 (1971). 19 O.Umnova, K.Attenborough and K.M.Li, Cell model calculations of dynamic drag parameters in packings of spheres, J. Acoust. Soc. Am., 107(3):3113–3119 (2000). 20 S.H.Burns, The absorption of sound by pine trees, J. Acoust. Soc. Am., 65:658–661 (1979). 21 T.Watanabe and S.Yamada, Sound attenuation through absorption by vegetation, J. Acoust. Soc. Jpn., 17:175–182 (1996). 22 M.J.M.Martens and A.Michelsen, Absorption of acoustic energy by plant leaves, J. Acoust. Soc. Am., 69:303–306 (1981). 23 J.Defrance, N.Barriere and E.Premat, Forest as a meteorological screen for traffic noise. Proc. Ninth ICSV, Orlando (2002).
Predicting outdoor sound
340
24 N.Barrière and Y.Gabillet, Sound propagation over a barrier with realistic wind gradients. Comparison of wind tunnel experiments with GFPE computations, Acust. Acta Acust., 85:325–334 (1999). 25 N.Barrière, Theoretical and experimental study of traffic noise propagation through forest, PhD Thesis, Ecole Centrale de Lyon (1999). 26 E.M.Salomons, Improved Green’s function parabolic equation method for atmospheric sound propagation, J. Acoust. Soc. Am., 104:100–111 (1998). 27 M.E.Swearingen and M.White, Sound propagation through a forest: a predictive model. Proc. Eleventh LRSPS, Vermont (2004). 28 E.M.Salomons, Reduction of the performance of a noise screen due to screen-induced windspeed gradients. Numerical computations and wind tunnel experiments, J. Acoust. Soc. Am., 105:2287–2293 (1999). 29 G.A.Daigle, J.E.Piercy and T.F.W.Embleton, Effects of atmospheric turbulence on the interference of sound waves near a hard boundary, J. Acoust. Soc. Am., 64:622–630 (1978). 30 J.Forssen, Calculation of sound reduction by a screen in a turbulent atmosphere using the parabolic equation method, Acust. Acta Acust., 84:599–606 (1998). 31 E.M.Salomons and K.B.Rasmussen, Numerical computations of sound propagation over a noise screen based on an analytic approximation of the wind speed field, Appl. Acoust., 60:327–341 (2000). 32 T.Van Renterghem and D.Botteldooren, Effect of a row of trees behind noise barriers in wind, Acustica-Acta Acustica, 88:869–878 (2002). 33 L.Sutherland and G.A.Daigle, Atmospheric sound propagation, in Encyclopaedia of Acoustics, ed. M.J.Crocker, Ch. 32, Wiley, New York (1997). 34 M.R.Stinson, D.J.Havelock and G.A.Daigle, Simulation of scattering by turbulence into a shadow zone region using the GF-PE method, 283–307 Proc. sixth LRSPS Ottawa, NRCC, 1996. 35 D.K.Wilson, A brief tutorial on atmospheric boundary-layer turbulence for acousticians, 111–122, Proc. Seventh LRSPS, Ecole Centrale, Lyon, 1996. 36 D.K.Wilson and D.W.Thomson, Acoustic propagation through anisotropic surface layer turbulence, J. Acoust. Soc. Am., 96:1080–1095 (1994). 37 A.L’ Esperance, G.A.Daigle and Y.Gabillet, Estimation of linear sound speed gradients associated to general meteorological conditions, Proc. Sixth LRSPS Ottawa, NRCC, (1996) p. 202. 38 D.K.Wilson, On the application of turbulence spectral/correlation models to sound propagation in the atmosphere, Proc. eigth LRSPS, Penn State University (1998) pp. 296–312. 39 V.E.Ostashev and D.K.Wilson, Relative contributions from temperature and wind velocity fluctuations to the statistical moments of a sound field in a turbulent atmosphere, Acust. Acta Acust., 86:260–268 (2000). 40 S.F.Clifford and R.T.Lataitis, Turbulence effects on acoustic wave propagation over a smooth surface, J. Acoust. Soc. Am., 73:1545–1550 (1983). 41 G.A.Daigle, Effects of atmospheric turbulence on the interference of sound waves above an impedance boundary, J. Acoust. Soc. Am., 65:45–49 (1979). 42 V.E.Ostashev and G.H.Goedecke, Interference of direct and ground-reflected waves in a turbulent atmosphere, Proc. of the eigth LRSPS, Penn State (1998) pp. 313–325. 43 L’Esperance, P.Herzog, G.A.Daigle and J.R.Nicholas, Heuristic model for outdoor sound propagation based on an extension of the geometrical ray theory in the case of a linear sound speed profile, Appl. Acoust., 37:111–139 (1992). 44 R.Raspet and W.Wu, Calculation of average turbulence effects on sound propagation based on the fast field program formulation, J. Acoust. Soc. Am., 97:147–153 (1995). 45 K.E.Gilbert, R.Raspet and X.Di, Calculation of turbulence effects in an upward refracting atmosphere, J. Acoust. Soc. Am., 87(6):2428–2437 (1990).
Predicting effects of vegetation, trees and turbulence
341
46 G.A.Daigle, Diffraction of sound by a noise barrier in the presence of atmospheric turbulence, J. Acoust. Soc. Am., 71:847–854 (1982). 47 V.I.Tartarskii, The Effects of the Turbulent Atmosphere on Wave Propagation, Keter, Jerusalem (1971). 48 V.E.Ostashev, Sound propagation and scattering in media with random inhomogeneities of sound speed, density and medium velocity, Waves in Random Media., 4:403–428 (1994). 49 D.K.Wilson, D.I.Havelock, M.Heyd, M.J.Smith, J.M.Noble and H.J.Auvermann, Experimental determination of the effective structure-function parameter for atmospheric turbulence, J. Acoust. Soc. Am., 105(2):912–914 (1999).
Chapter 11 Analytical approximations including ground effect, refraction and turbulence 11.1 Ray tracing Most community noise problems require information about the attenuation of A-weighted noise. Full wave numerical models, such as the Fast Field Program (FFP) and the Parabolic Equation method (PE) have been developed to compute the sound field in a complex outdoor environment. However, evaluation of A-weighted mean square pressure by these numerical methods demands considerable computational resources. For some applications, it may be sufficient to assume that the atmosphere is vertically stratified so that an effective sound speed gradient can be used to replace wind and temperature gradients. With this assumption a ray-trace approach is convenient and, for some situations, it is adequate. In this section we investigate the analytical basis for ray tracing and in the following section we compare ray-trace and full-wave predictions. Ray tracing assumes an effective sound speed profile due to wind and temperature gradients and sums the contributions from all rays that are computed to pass through a chosen receiver. Such rays between source and receiver are known as eigenrays. For sources close to the ground, it is necessary to take into account any ground reflections. Rather than use plane wave reflection coefficients to describe these ground reflections, a better approximation is to use spherical wave reflection coefficients (see Chapter 2). Such an approach has resulted in a heuristic modification of the Weyl-Van der Pol formula (2.40) [1, 2]. It has been shown [3, 4] that if the rays have not passed through turning points and there is a single reflection at the ground, the resulting formulation represents the first term of an asymptotic solution of the full wave equation and is valid at short ranges. Furthermore, not only has it been demonstrated numerically that the ray-trace solution agrees reasonably well with other numerical schemes (see section 11.4), but there are also experimental data [e.g. 5] that agree tolerably well with ray-trace predictions based on a linear sound speed profile. Li [5] has demonstrated that the sound field due to a monopole source above a porous ground in the presence of temperature and wind gradients can be written in a recognizable form similar to the Weyl-Van der Pol formula (2.40). The theory may be summarized as follows: in a moving stratified medium, the index of refraction m(z) is defined as
(11.1)
Analytical approximations including ground effect
343
where n(z) is the index of refraction in an otherwise homogeneous medium, u and ψw are the magnitude and direction of wind, µ(z) and ε are the polar and azimuthal angles of a wavefront normal, c(z) is the speed of sound and M(z)=u/c is the Mach number. We note that the azimuthal angle is constant for a given wavefront normal but the polar angle varies as a function of height in a moving stratified medium. Using the index of refraction in a moving medium, we can derive the modified Snell’s Law for a wavefront normal as
m sin µ=sin µ0=constant, (11.2) where µ0, is a reference polar angle of a ray at, z=0 say. In other words, we can determine the wavefront normal of a particular ray by specifying a polar angle at a given height and its corresponding azimuthal angle. As pointed out elsewhere [6], the trajectory of the wavefront normal should be distinguished from the sound ray that travels from the source to the receiver. In a moving medium, the wavefront normal is not coincident with the sound ray. To aid theoretical and numerical analyses, the acoustical path length, RL(µ, ε), and the radius of curvature, Rr(µ, ε) are defined respectively by
(11.3) and
(11.4)
where the subscript s denotes the variables to be evaluated at the source height, zs.z< and z> are, respectively, the lesser and the larger of the source and receiver height. In addition, the Doppler factor D(z) is given by D(z)=[1+M cos(ε−ψw) sin µ]−1. (11.5) Before proceeding further, two typographical errors in [5] should be noted. Equation (55) tan α dz and (58) in [5] should be in [5] should be
Predicting outdoor sound
344
Suppose that the polar and azimuthal angles of the wavefront normal of the direct wave are θ and ψ respectively, whereas they are and for the reflected wave. Then, the sound field, above a locally reacting ground surface, can be determined by
(11.6) where k0 is the reference wave number, Rp is the plane wave reflection coefficient, F(w) is the boundary loss factor and w is known as the numerical distance. These parameters can be determined according to
(11.7a)
(11.7b)
(11.7c)
where β is the normalized specific admittance. In (11.6), and, are the acoustical path lengths for the direct and reflected waves respectively. The and are the effective radii of curvature of the quantities corresponding rays. The receiver position is given in the cylindrical polar coordinate system with r as the range and z the height of the receiver. Without loss of generality, the azimuthal angle of the receiver is set at zero. This analysis is based on the method of Fourier transformation and the well-known WKB approximation in which the sound field can be expressed in terms of an integral representation (Chapter 2). By evaluating the integral asymptotically, we can confirm the validity of the heuristic approximation used in previous analysis [7] which includes the ground wave term explicitly (the second term of the curly bracket) in (11.6). This equation is valid for a relatively short separation between the source and receiver. This implies that in an upward-refracting medium, the analysis is invalid in the shadow zone and in close proximity to the shadow boundary. Also, in a downward-refracting medium, the analysis is only satisfactory for a close range such that the reflected wave suffers only a single bounce. Also the receiver must not be close to a caustic (i.e. a ray crossing) where the effective radius of curvature of a ray vanishes. Li [1] has allowed for multiple bounces in a temperature-stratified but downwardrefracting medium. The asymptotic solution for the total field above an impedance ground is
Analytical approximations including ground effect
345
(11.8) This solution is simply the sum of contributions from all possible eigenrays linking the source and receiver. When calculating it is crucial to include all possible branches of the ray traces. The phase shifts, χ1 and χ2, result where the direct and reflected rays graze a caustic. There will be a phase reduction of π/2 each time the ray touches a caustic [8]. The method developed by Thompson [9] from the theory derived by Blokhintzev [10] and its derivative [11] is commonly used as the basis for the ray-tracing algorithm in a moving stratified medium. These earlier methods often require the setting up of a pair of first-order differential equations which can be solved either by numerical integration or by the construction of a finite-step wavefront, that is by the Euler method. The search for an eigenray usually involves some form of hit-and-miss approach: one launches a ray in a given direction at the source and then determines whether the launched ray hits the ‘target’ at the receiver location. This technique is described as ‘blind-shooting’. To reduce computational time, the area of the target is often restricted. The numerical accuracy is controlled by the size of the target as well as the step size in tracing the ray path: the smaller the step length and the smaller the target, the greater the computational time. A bracketing scheme has been devised that avoids the need for ‘blind-shooting’ [12]. for the The stationary points for RL(µ, ε) in (11.3), ((θ, ψ) for the direct wave and reflected wave) are determined. Then the eigenray can be determined by solving the following pair of non-linear equations for µ and ε:
(11.9) and
(11.10) To determine an eigenray, it is sufficient just to specify the polar angle at a given height and the azimuthal angle of a wavefront normal because the polar angle at other heights can be found by using the modified Snell’s law cf. (11.2) The small ratio between wind and sound speed (M≈0.03) in the normal atmospheric environment, means that the azimuthal angle of the wavefront normal is very close to the azimuthal angle of the receiver, and, therefore, ε=0 may be used as the first approximation. We can determine µ(z) from (11.2) and (11.10) for a given range r. A second approximation for ε can be found by using µ(z) and (11.9) to give
Predicting outdoor sound
346
(11.11)
The integration in (11.11) can be carried out numerically. The process for determining ε and µ(z) can be repeated iteratively in order to achieve the required accuracy. For most practical situations, ε is very small and one only needs two or three iterations. A better method than ‘blind-shooting’ for finding µ(z) for a given ε can be found. For convenience, we restrict our analysis to a monotonically increasing function of m(z). Although this implies a monotonically increasing function of c(z), the method should apply equally for other more intricate profiles that may include regions where dc(z)/dz is zero and can be extended readily and straightforwardly to take account of the wind effects. As mentioned earlier, it is sufficient just to specify µ0[≡µ(0)], say, as me unknown variable in (11.10). The polar angle at other heights can be determined through the use of (11.2). Determination of µ0 involves the evaluation of the integral given in (11.10). There is an integrable singularity at the turning point where the polar angle is π/2 (or the slope of the wavefront normal is zero). Substituting (11.9) into (11.10), we obtain (11.12)
Using partial integration, to remove the integrable singularity of (11.22) and make the subsequent numerical analysis somewhat simpler, (11.12) can be recast as
(11.13) where
(11.14) and the primes denote the derivatives with respect to z. This analysis is valid as long as the derivative of the moving medium index of refraction, m, does not vanish at any point along the ray path. Physically, this situation corresponds to the case of an infinitely narrow sound channel where a ray will be trapped. In general, numerical integration is required to calculate I(µ0) in (11.13). On the other hand, the computation of definite integrals may be regarded as an initial value problem. By differentiating both sides of (11.14) with respect to z, we transform it into a first-order differential equation:
Analytical approximations including ground effect
347
(11.15) with the initial condition of I=0 at z=z<. We wish to compute the function I at z=z> with due consideration of tracing all branches for a complete ray path. It is adequate just to calculate the integral from z< to the turning point, from z> to the turning point and from the ground surface to the turning point. An appropriate number of these portions are then added together to trace all rays in all possible ways. A typical approach, sometimes known as the Euler method, involves the use of a finite step size (∆z). The increment of I can be computed by multiplying the right side of (11.15) by ∆z for each step. However, the Euler method is not recommended for practical use as other more sophisticated numerical methods provide a more accurate and stable solution [13]. Since a high degree of accuracy is required in computing I, a fourth order Runge-Kutta or the so-called adaptive Bulirch-Stoer technique is used. To find all solutions for (11.13), we introduce the eigenray error function,
(11.16) The eigenrays are then determined by minimizing |E(µ0)| for a given source/receiver geometry and, wind and temperature profiles. The error function E(µ0) is sampled at a range of polar angles specified by the user. This allows the determination of zero crossings which, in turn, provides information about a pair of bracketing polar angles. The spacing of the samples ∆µ0 is also set by the user. A smaller ∆µ0 and a large range of polar angles increase the probability that all eigenrays will be found at the expense of higher computational time. The Brent root finding algorithm [13] is used to find the eigenray solution when zero crossings are found. Often an initial examination of the wind velocity and sound speed profiles will provide some useful insight in the choice of upper and lower bounds of the polar angles. For example, suppose that a ray launches upward at some angle µu that has its turning point at height z> (see Figure 11.1). In this case, it is clear that any ray launched upwards at a polar angle greater than µu cannot reach a receiver situated at a height of z>. Hence µu provides an upper bound for the sampling range for the reflected rays. On the other hand, the choice of the sampling range may also be decided on a trial-and-error basis.
Predicting outdoor sound
348
Figure 11.1 Plot of the inverse of the ray amplitude for wavefront positions along a ray trajectory from the ground up to the turning point. The solid line represents the geometrical path length calculated according to (11.4) and the circles represent values of the expression where J is given by (11.18). We also note that in a downward-refracting medium, a ray launched at an angle (π−µ0) has the same characteristic parameters as the ray launched upwards with the polar angle µ0 so the down-going rays can be located at the same ‘time’. Once the polar angle of the wavefront normal has been determined, its value is substituted into (11.11) and that allows ε to be found by the simple iteration procedure detailed earlier. Although the principle described here can be generalized to other more intricate profiles, such developments are beyond the scope of the present text. On finding the polar and azimuthal angles of all eigenrays, it is straightforward to by direct numerical integration. These parameters are used, in compute and the turn, to compute the total sound field given by (11.8). The determination of reduction in phases (χ1 and χ2) can be facilitated by noting
(11.17a)
Analytical approximations including ground effect
349
(11.17b) and
(11.17c) The equation of the caustic can be found by setting the Jacobian factor J given by
(11.18)
to zero [1] and it is then possible to determine χ1 and χ2 by examining whether the ray grazes the caustic. Ray tracing may be used to calculate excess attenuation including turbulence (see where Chapter 10), defined by
(11.19)
where Ri represent the Jacobian function divided by the stratification factor, Q= Rp+(1−Rp)F(w) and Γ is a turbulence parameter allowing for the destruction of coherence between the rays. Γ=exp(−ασ2(1−ρ)) (11.20) is the variance of phase fluctuation along a path, where (for equal source and receiver heights) is the covariance between paired rays, is the fluctuation of the refractive index, L0 is the outer scale of turbulence, h is the maximum separation between paired rays, α=1 if otherwise and R is the distance between source and the receiver.
Predicting outdoor sound
350
In previous ray-tracing methods [14], h may be computed from predictions of the complete ray paths. Here we follow the method of Raspet and Wu [15] and define it as one-half of the vertical distance between the turning points of the two ray paths. Since, the locations of the turning points are calculated in the routine anyway, no extra computation is necessary. Figure 11.2 demonstrates the result of including turbulence in this manner for source and receiver at 1.5 and 1.8 m heights respectively, horizontal separation 1000 m, a linear varying between zero and 10−6. sound speed gradient of 10−1 s−1 and Figure 11.3 compares predictions of transmission loss against range at a frequency of 1 kHz obtained from the ray-trace procedure with results of FFP
Figure 11.2 Predicted effect of turbulence on excess attenuation spectra under downwind conditions with varying degrees of turbulence. Source and receiver heights are 1.5 and 1.8 m respectively and the horizontal separation is 1000 m. The assumed linear sound speed gradient is 10−4 s−1 and the ground impedance is calculated using the two-parameter model ((3.13) with 300 kPa s m−2, 20.0 m−1). The the dashed line solid line indicates the dash-dot line corresponds to and the dotted line corresponds to corresponds to
Analytical approximations including ground effect
351
Figure 11.3 Comparison between ray-trace and FFP calculations as a function of range out to 5 km at 1000 Hz under downward refraction conditions. The source and receiver heights and the ground impedance values are assumed to have the same values as for Figure 11.2. The sound speed gradient is assumed to be 0.1 s−1. calculations in the presence of a downward-refracting linear sound speed gradient of 0.1 s−1. To obtain the FFP results, 16,384 integration points and 1000 layers each 0.5 m thick were used. Typically, this calculation requires 5 hours on a 3 GHz PC. The FFP calculation results have been plotted at 100 point intervals since finer interference structure than that shown will be destroyed by turbulence and has no practical significance. The ray-trace predictions, which are accomplished in a matter of seconds on the same computer and allow for up to 4 ground reflections, are in good agreement with the ‘smoothed’ structure predicted by the FFP out to 4 km range. Beyond 4 km it appears that there are additional ray arrivals that are not accounted for in the ray-trace predictions. The remarkable agreement between ray-trace and full wave calculations at long range has been shown to be the result of the finite ground impedance which removes the rays for which the ray-tracing approximations do not hold [16].
Predicting outdoor sound
352
11.2 Linear sound speed gradients and weak refraction There are distinct advantages in assuming a linear effective sound speed profile in ray tracing since this assumption leads to circular ray paths and analytically tractable solutions. With this assumption, the effective sound speed, c, can be written,
c(z)=c0(1+ζz) (11.21) where ζ is the normalized sound velocity gradient ((dc/dz)/c0) and z is the height above ground. If it assumed also that the source-receiver distance and the effective sound speed gradient are sufficiently small so that there is only a single ‘ray bounce’, that is ground reflection, between source and receiver: it is possible to use a simple adaptation of the Weyl-Van der Pol formula (2.40) replacing the geometrical ray paths defining the direct and reflected path lengths by curved ones. Consequently, the sound field is approximated by p={exp(ik0ξ1)+Q exp(ik0ξ2)}/4πd (11.22a) where Q is the appropriate spherical wave reflection coefficient, d is the horizontal separation between the source and receiver, ξ1 and ξ2 are, respectively, the acoustical path lengths of the direct and reflected waves. These acoustical path lengths can be determined by [17, 18]
(11.22b) and
(11.22c) and θ(z) are the polar angles (measured from the positive z-axis) of the direct where and reflected waves and the path length difference, ∆r, is given by ∆r=ξ2−ξ1. (11.22d)
Analytical approximations including ground effect
353
The subscripts > and < denote the corresponding parameters evaluated at z> and z< respectively, z>=max(zs, zr) and z<≡min(zs, zr). Hidaka et al. [19] have used the travel time along the curved ray to characterize the acoustical path length. It is straightforward to show that (11.22b) and (11.22c) can be reduced to their equations. Additionally, it is possible to show, in the limit of ς→0 (i.e. a homogeneous medium), that the acoustical path lengths can be reduced to
and
which are the corresponding geometrical path lengths of the direct and reflected waves. and θ(z), we need to find the corresponding polar To allow for the computation of and θ0) at z=0. Formulas for finding and θ0 in terms of sound velocity angles ( and gradient are given elsewhere [1]. Once the polar angles are determined at θ(z) at other heights can be found by using Snell’s Law:
where or θ. After substituting these angles into (11.22b) and (11.22c) and, in turn, into (11.22a), we can calculate the sound field in the presence of a linear sound velocity gradient. In downward refraction, additional rays will cause a discontinuity in the predicted sound level because of the inherent approximation used in the ray-trace model. It is possible to determine the critical range, rc where there are two additional rays in the raytrace solution. Although tedious, it is straightforward to show that the critical range, for ς>0, is given by
(11.23a)
Figure 11.4 shows that if we confine predictions to a horizontal separation of less than 1 km and a normalized sound speed gradient of less than 0.0001 m−1 (corresponding, for example, to a wind speed gradient of less than 0.1 s−1) then, for source and receiver at 1 m height, it is reasonable to assume a single ground bounce in the ray-trace model. The critical range for the single bounce assumption increases as the source and receiver heights increase.
Predicting outdoor sound
354
The ray-trace solution for upward-refracting conditions is incorrect when the receiver is in the shadow and penumbra zones. The shadow boundary can be
Figure 11.4 Maximum ranges for which single-bounce assumption is valid for linear sound speed gradient based on (11.23a) assuming equal source and receiver heights: 1 m (solid line); 3.5 m (broken line) and 10 m (dot-dash line). determined from geometrical considerations. For a given source and receiver heights, the critical range, is determined as
(11.23b) where
Figure 11.5 shows that for source and receiver heights of 1 m and a normalized sound speed gradient of 0.0001 m−1, the distance to the shadow zone boundary is about 300 m. As expected the distance to the shadow zone boundary is predicted to increase as the source and receiver heights are increased.
Analytical approximations including ground effect
355
Conditions of weak refraction may be said to exist where, under downward-refracting conditions, the ground-reflected ray undergoes only a single bounce and, under upwardrefracting conditions, the receiver is within the illuminated zone. Chapter 10 described how turbulence can be included in (11.2a) to give a heuristic ray-tracing scheme that includes ground effect, refraction and turbulence.
Figure 11.5 Distances to shadow zone boundaries for varying linear sound speed gradients based on (11.3b) assuming equal source and receiver heights: 1 m (solid line); 3.5 m (broken line) and 10 m (dot-dash line).
11.3 Approximations for A-weighted levels and ground effect optimization in the presence of weak refraction and turbulence 11.3.1 Ground effect optimization Typically empirical schemes for predicting assume that all porous ground surfaces may give identical excess attenuation within the accuracy of the scheme. However, as described in Chapter 4, porous ground surfaces display a wide range of porosity and the flow resistivity can vary over nearly three orders of magnitude. The question arises of whether ground effect optimization is possible for a particular source spectrum and source-receiver geometry. Makaraewicz [20] derived an approximation for ground effect at relatively long range which could be used to calculate the effective flow resistivity that maximizes ground effect for a given point source-receiver geometry. He used exponential functions to represent A-weighting and air absorption, and the Delany-Bazley single-parameter model of ground impedance (see Chapter 3). Li et al. [1] pointed out sign errors in this work,
Predicting outdoor sound
356
used a two-parameter impedance model (see Chapter 3) and deduced alternative closedform results for ground effect and optimum parameters. Makarewicz [21] subsequently extended this model to take account of different source spectra and atmospheric turbulence. Attenborough and Li [22] have revised this work to allow for a more general range of ground impedance and the effects of roughness, at scales small compared with the sound wavelengths of interest, on the coherent sound field. For a given source-receiver geometry, this enables prediction of ground types that will achieve maximum excess attenuation and estimation of the magnitudes of the optimized excess attenuation. They made use of an approximation for propagation in a linear sound velocity gradient to explore the extent to which the optimized ground effect is affected by atmospheric refraction. In the following sections, we review the general basis for the approximations including an approximate method for including weak refraction effects. Subsequently we derive expressions for excess attenuation and optimum ground parameters. Numerical explorations of their sensitivities to source-receiver geometry and refraction are made. Finally we offer some conclusions based on these predictions. 11.3.2 Integral expressions for A-weighted mean square sound pressure The basis for this and previous work is the classical analytic approximation (2.40), sometimes called the Weyl-Van der Pol formula, for the sound field due to a point source above an impedance plane (see Chapter 2). After further approximation for near-grazing incidence, inclusion of exponential factors to allow for A-weighting, source spectrum, air absorption and turbulence and integration over frequency (f), an expression for the Aweighted mean square sound pressure may be deduced. Note that in this chapter the time convention exp(iωt) is assumed rather than exp(−iωt) as has been used previously. Hence
(11.24) where
(11.25a)
(11.25b)
Analytical approximations including ground effect
357
(11.25c)
W0=1.4676×10⁻⁶; µA=δ+µ, δ is an A-weighting parameter (=6.1413×10⁻⁴), m, µ and P(0) relate to the source power spectrum such that the total A-weighted power of the source is (Γ is the gamma function) and the A-weighted power spectrum peaks at fm=m/µA Hz. The air absorption parameter α(f)=a1f+a2f2 where a1 and a2 are constants with is a turbulence parameter depending on mean square refractive index the largest turbulence scale (L0 m) and transverse correlation (ρ), ε is a constant (=1/2 or 1), ∆r m is the path length difference between direct and ground reflected rays, d m is the range and k0 m−1 is the wavenumber for sound in air. In the presence of a linear sound speed profile, and subject to certain constraints, equation (11.25) remains valid as long as ∆r in 11.25(c) and the angle of specular reflection θ at the ground are calculated for curved ray paths (see section 11.1). Q1 and Q2 are the real and imaginary parts of the spherical wave reflection coefficient. Assuming that A-weighting reduces any contributions from frequencies less than 250 Hz where Z=R−iX, is the normal surface to insignificance, that d≥10, that impedance of the ground, θ is the angle of specular reflection, and using harmonic timedependence exp(iωt), where ω=2πf, the spherical wave reflection coefficient may be approximated considerably. Hence
(11.26a)
(11.26b) and
(11.26c) Note that (11.26a) to (11.26c) correct sign errors in the corresponding equations in Makarewicz [20, 22] and misprints in [21]. It is interesting to observe that when X>R, the terms in (R2−X2) serve to increase Q1 and Q2, and hence the integrands in (11.25b) and (11.26c). An example simulation of an A-weighted source power spectrum is illustrated in Figure 11.6.
Predicting outdoor sound
358
The crosses correspond to m=2.55, P(0)=108 and µA=4.03×10⁻³, giving a peak sound power level at 633 Hz and the open boxes represent A-weighted octave band power levels deduced from the measured sound level spectrum at 152.4 m from a fixed Avon engine at a disused airfield during low wind, low turbulence conditions by correcting for spherical spreading, ground effect, air absorption and turbulence. In principle it should be possible to fit m, P(0) and µA, analytically, given fm, the peak A-weighted sound power level and PA. However, in this instance the values are the result of trial-and-error bestfitting. 11.3.3 Two approximate models for ground impedance From Chapter 3, it is convenient to select two impedance models. These are given by (3.33) and (3.60) but are repeated here with a change in time convention. Hence, for a variable porosity with depth, or a non-hard backed layer
(11.27) and b=c0/8πγ and αe=(n′+2)α/Ω, or αe=4/de. where In general, this impedance implies X>R (as long as αe is positive).
Figure 11.6 Example simulation of an Aweighted octave band power spectrum (×) compared with that deduced from measurements (□) obtained at 1.2 m height
Analytical approximations including ground effect
359
with a fixed Rolls Royce Avon jet engine mounted at 2.16 m height over grassland. The simulation uses m=2.55, P(0)=108 and µA=4.03×10⁻³ [22]. Reprinted with permission from Elsevier. Alternatively, for a rough porous surface,
(11.28) where c0D/2π may be treated as an effective roughness volume per unit area. 11.3.4 Effects of weak refraction Apart from turbulence, Makerewicz [20, 22] ignored meteorological effects in deriving a closed-form expression for an A-weighted mean square sound pressure. As discussed in previous chapters, variations in temperature and wind with height cause the speed of sound to vary with height and lead to refraction effects. Without inclusion of refraction, the applicability of the model is limited. In the present context, numerical methods are not appropriate because the direct and reflected sound waves are not separated out explicitly as two terms and the evaluation of A-weighted mean square pressure by these numerical methods demands considerable computational resources. For engineering applications, it is far more convenient to use the ray-trace approach. We shall use the raytrace approach in deriving the expression for the A-weighted mean square sound pressure. Using (11.26) and following the methods detailed elsewhere [1], we can derive the A-weighted mean square sound pressure in the presence of weak effective sound speed gradients. The expression will be given in the next section where all other factors are included in the analysis. 11.3.5 Approximations for excess attenuation 11.3.5.1 Variable porosity or thin layer ground Substitution of (11.7) into (11.5) leads to integrals of the form
Where
g=µA+2a1d, h=(2a2+γt)d and l=0 or 2π∆r/c0.
Predicting outdoor sound
360
These may be evaluated in closed form by means of products of gamma and parabolic cylinder functions [23]. If d is sufficiently large and a2 and γt are sufficiently small, then and so that for l=0, G1(k)→C(k)≈Γ(k+ 1)/(µA+2a1d)−(k+1), (11.29a)
for l≠0, G1(k)≈C(k)−1/2C(k+1)l2−(2a2+γt)dC(k+2), (11.29b) and
G2(k)≈C(k+1)l−(2a2+γt)dC(k+3)l. (11.29c) Finally, use of these and further approximations leads to
(11.30a) where S=B0d+B1l2−B2l cos θ0+B3 cos2 θ0+B4l (11.30b)
(11.30c)
(11.30d)
(11.30e)
(11.30f)
Analytical approximations including ground effect
361
(11.30g) The ground parameters that minimize S and hence give maximum excess attenuation for a given geometry are given by
(11.31a) and
(11.31b) where
(11.31c) A2=4bl cos θ0, (11.31d)
(11.31e)
(11.31f) and
(11.31g)
Predicting outdoor sound
362
11.3.5.2 Rough ground A similar procedure starting with the approximate rough porous surface impedance given by (11.28) yields (11.31a)–(11.31d) together with
(11.32a)
(11.32b)
(11.32c)
The rough ground parameters that minimize S are given by
(11.33a)
and
(11.33b) where
(11.33c)
(11.33d)
Analytical approximations including ground effect
363
(11.33e) and
(11.33f) If the atmosphere is homogeneous, then l≈4πhrhs/c0d and cos θ0≈(hs+hr)/d
(11.33g) and
(11.33h)
11.3.5.3 Smooth high-flow-resistivity ground Completing the picture, the optimum effective flow resistivity for a semi-infinite smooth rigid-porous high-flow-resistivity surface, homogeneous atmosphere, is given by
such
that
under
an
(11.33i)
where S is given by (11.29b) together with (11.29c)–(11.29g), or (11.29c) and (11.29d), with (11.21), the excess attenuation may be calculated for optimum or other parameter values from
EA=10 log(S). (11.34)
Predicting outdoor sound
364
11.3.6 Numerical examples and discussion 11.3.6.1 Comparison with data: Avon jet engine source With µA=4.03×10⁻³, P(0)=108 and m=2.55, the exponentially modelled A-weighted source spectrum peaks at 633 Hz and simulates Avon jet engine noise. The A-weighted sound levels predicted by the approximate theory over a variable porosity ground characterized by σe=30 kPa s m−2 and αe=16 m−1 are compared with measurements obtained under zero wind, low turbulence conditions, in Figure 11.7. Other parameter values used in the L0=1 m, ρ=0, ε=0.5, a1=5×10⁻⁷, a2=2×10⁻¹². predictions are 11.3.6.2 Sensitivity to spectrum, source height and distance With the variable porosity ground model, assuming a range of 500 m and using the same air absorption, turbulence and spectrum parameter values as used for Figures 11.6 and 11.7, the optimum parameters are predicted to be σem=58.8 kPa s m−2 and
Figure 11.7 Comparison of predicted (solid line) and measured sound level (points) as a function of range from a fixed Avon jet engine (hs=2.16 m, hr=1.2 m) under zero wind low turbulence conditions. The predictions use
Analytical approximations including ground effect
365
(11.20) with an A-weighted spectrum simulated by m=2.55 and µA=4.03×10⁻³, air absorption given by a1=5×10⁻⁷, a2=2×10⁻¹², turbulence represented by and no refraction. The data correspond to averages of 220 second samples.
Figure 11.8 Predicted variation of excess attenuation at 500 m with variable porosity ground impedance parameters (11.27) for a source at 2.16 m height, receiver at 1.2 m height, an A-weighted spectrum simulated by
Predicting outdoor sound
366
m=2.55 and µA=4.03×10⁻³, air absorption given by a1=5×10⁻⁷, a2=2×10⁻¹², turbulence and no represented by refraction: (a) variation with effective flow resistivity assuming a rate of change of porosity of 7.7 m−1 and (b) variation with rate of change of porosity, assuming an effective flow resistivity of 58.8 kPa s m−2 [22]. Reprinted with permission from Elsevier. αem=7.74 m−1. However, for the given A-weighted spectrum and source height, Figure 11.8 shows that the predicted excess attenuation is rather insensitive to variation in either of the ground parameters below certain values, that is σem<103 kPa s m−2 and αem<400 m−1. Two decades of variation in flow resistivity or large variations in αe below these values produce only 1 dB(A) change in predicted excess attenuation. Uncultivated grassland [24] with an effective flow resistivity of approximately 30 kPa s m−2 and αe of approximately 15 m−1 is predicted to give a ground effect fairly near to the optimum. Such a surface is predicted to give a distinctly greater excess attenuation than acoustically harder surfaces; specifically the excess attenuation is predicted to be approximately 19 dB(A) different from that predicted for an acoustically hard surface (+3 dB(A)). Similar results are predicted, if the approximate rough porous surface impedance model (11.28) is used. For example, the optimum rough ground parameters, for the same source-receiver geometry and spectrum as assumed for Figure 11.6, are predicted to be an effective flow resistivity of 107 kPa s m−2 and a roughness volume per unit area of 0.0077 m. This represents ploughed or sub-soiled ground with roughness equivalent to closepacked hemi-spherical bosses of radius 0.08 m. Again, as shown in Figure 11.9, the excess attenuation is predicted to be relatively insensitive to effective flow resistivity below a value of 103 kPa s m−2. However, increasing roughness beyond the optimum is predicted to have a significantly detrimental effect on A-weighted excess attenuation. The optimum parameters for impedance model (11.27) are predicted to be very sensitive to source height and spectrum. This is illustrated in Figures 11.10 and 11.11 for an Avon engine spectrum. The corresponding optimum excess attenuation is predicted to be very sensitive to turbulence. This is demonstrated in Figures 11.12 and 11.13. The predictions for both ground types are similar. Clearly the most useful optimizations of the excess attenuation of A-weighted noise due to ground effect are predicted to occur for low source heights and low peak frequencies in the A-weighted source spectrum. It should be noted that the predictions for low flow resistivities will be somewhat suspect since high-flow-resistivity impedance models have been assumed. Considerable increase in predicted excess attenuation over that for typical grassland is predicted to be possible for low source heights if the flow resistivity is low and either the porosity is near constant with depth or the roughness is fairly large. This suggests, for low source heights, that there is potential noise reduction from plowing or disking ground since either reduces flow resistivity while increasing roughness.
Analytical approximations including ground effect
367
11.3.6.3 Variation with distance The optimum ground parameters are predicted to depend on distance from the source. For weak turbulence and a low source characterized by an A-weighted spectrum peaking at 750 Hz, Figure 11.14 illustrates the prediction that acoustically softer parameters are optimum as distance from source increases. However, the dependence is relatively slight and the predicted excess attenuation over ground with constant parameters average within the optimum range is similar to the optimized excess attenuation. This is illustrated in Figure 11.15.
Figure 11.9 Sensitivity of excess attenuation spectrum to ground parameters (rough porous ground impedance approximation (11.28)) for
Predicting outdoor sound
368
source with A-weighted spectrum peak frequency of 633 Hz at 2.16 m height, receiver at 1.2 m height and range 500 m (a) variation with effective flow resistivity assuming optimum roughness parameter value of 1.41×10⁻⁴ (b) with roughness, assuming optimum effective flow resistivity of 107 kPa s m−2 [22]. Reprinted with permission from Elsevier. 11.3.6.4 Effects of refraction For weak turbulence, low source height and low-frequency (300 Hz) spectrum peak, Figures 11.16–11.19 show that the predicted optimum ground parameters correspond to increasingly hard ground under increasing downward refraction conditions and increasingly soft ground under increasing upward refraction conditions.
Figure 11.10 Variation of predicted optimum variable porosity or thin layer parameters with source height for hr=1.2 m, d=500 m,
Analytical approximations including ground effect
369
mA=4.03×10⁻³, m=2.55 (Avon engine spectrum) and β=5×10⁻⁷ [22]. Reprinted with permission from Elsevier. The predicted optimum excess attenuations decrease as downward refraction increases and increase as upward refraction increases. The dependence is relatively slight for the given conditions, so that the predicted optimum ground effect is fairly robust to weak refraction.
Figure 11.11 Variation of predicted optimum variable porosity or thin layer parameters with A-weighted spectrum peak frequency. hs=2.16 m, hr=1.2 m, µA= 4.03×10⁻³, β=5×10⁻⁷ [22]. Reprinted with permission from Elsevier.
Predicting outdoor sound
370
11.3.7 Concluding remarks By means of approximations of the classical theory for a point source above an impedance surface and approximate effective impedance models, it is possible to derive closed-form relationships between excess attenuation ground effect, parameters relating to the A-weighted source power spectrum and the ground and source and receiver heights. Although the resulting predictions are approximate, they suggest practical
Figure 11.12 Variation of predicted optimum excess attenuation with source height for variable porosity or thin layer ground with source height: hr=1.2 m, d= 200, m=2.55, µA=4.03×10⁻³, β=5×10⁻⁷. Dotted and solid lines represents predictions with strong and and 10−8 weak turbulence respectively) [22]. Reprinted with permission from Elsevier.
Analytical approximations including ground effect
371
Figure 11.13 Predicted variation of optimum excess attenuation with A-weighted spectrum peak frequency for hs=2.16 m, hr=1.2 m, d=500 m, µA=4.03×10⁻³ and for two values of (solid), (broken) turbulence: [22]. Reprinted with permission from Elsevier.
Figure 11.14 Predicted optimum ground parameters as a function of distance for an Aweighted spectrum characterized by m=1.5, µA=2×10⁻³. Source height 0.1 m, receiver height 1.2 m [22]. Reprinted with permission from Elsevier.
Predicting outdoor sound
372
Figure 11.15 Predicted optimized ground effect (solid line) for source characterized by m=2, µA=2×10⁻³, source height 0.1 m, receiver height 1.2 m, compared with ground effect predicted over optimized ground type (σe=3 kPa s m−2, αe=3 m−1, dotted line) and over Hucknall type ground (σe=30 kPa s m−2, αe=16 m−1, broken line). Air absorption is represented by a1=0.5×10⁻⁶ and a2=2×10⁻¹²; turbulence by [22]. Reprinted with permission from Elsevier. possibilities for optimizing excess attenuation by means of controlling the ground characteristics. The greatest opportunities for such optimization are predicted for sources with low-frequency A-weighted spectral peaks and at ranges of less than 200 m under weak turbulence conditions and require rather acoustically soft ground. The resulting predictions are fairly robust to weak atmospheric refraction. The optimum
Analytical approximations including ground effect
373
Figure 11.16 Variation of optimum variable porosity ground parameters with downward refracting sound velocity gradient for m=1.5, µA=5×10⁻³; source at 0.1 m height, receiver at 1.2 m, range 200 m [22]. Reprinted with permission from Elsevier.
Figure 11.17 Variation of optimum excess attenuations with downward refracting sound velocity gradient for m=1.5, µA=5×10⁻³; source at 0.1 m height, receiver at 1.2 m, range 200 m [22]. Reprinted with permission from Elsevier.
Predicting outdoor sound
374
attenuation is predicted to be much higher for sources close to the ground. Since it may not be practicable to lower source heights for many noise sources, an alternative strategy is to raise the ground, perhaps through landscaping. This possibility needs further investigation.
Figure 11.18 Predicted effect of upward refraction on optimum variable porosity ground parameters. Assumed geometry and spectrum are as assumed for Figures 11.16 and 11.17.
Figure 11.19 Predicted effect of upward refraction on optimum excess attenuation. Assumed geometry and spectrum are as for Figures 11.16 and 11.17.
Analytical approximations including ground effect
375
11.4 A semi-empirical model for A-weighted sound levels at long range As discussed in Chapter 6, Makarewicz and Kokowski [25] have presented a simple semi-empirical form for carrying out calculations of the variation in A-weighted levels from a stationary source for ranges up to 150 m taking into account wavefront spreading and ground effect only. Their result for propagation from a point source is repeated here for convenience. If source and receiver heights are denoted by hs and hr respectively and r is their horizontal separation,
(11.35) Here E is an adjustable parameter intended to include the effect of the presence of the ground on radiation of sound energy from the source (2≥E≥1), LWA is the A-weighted sound power level of the source and γg is an adjustable ground parameter. The lower the impedance of the ground, the larger is the value of γg. Turbulence effects have been included in equation (11.35) by introducing an additional factor exp(−γt) multiplying γg [26], where γt is another adjustable parameter. Air absorption may be included [27] by an additional attenuation given by 10 log(1+χd) where χ represents a temperature and humidity dependent equivalent absorption coefficient (=14×10−4 at 10°C and 70% RH). By these means, the formulation in (11.35) may be extended to longer ranges. These modifications have been used for the predictions compared with data in Figure 11.20(b). The value of E has not been included explicitly but assumed to be incorporated in the A-weighted source power deduced from close range data.
Figure 11.20 A-weighted sound levels during acoustically neutral conditions measured 1.2 m above grass at Hucknall (open boxes and circles) and deduced from Parkin and Scholes’ data at Hatfield (crosses) compared with predictions (a) of the exponential simulation
Predicting outdoor sound
376
model [10] (solid and broken lines) and (b) of Makarewicz model including turbulence [21] (solid and broken lines using fitted ground parameters γg=7×10⁻⁴ and 3×10⁻⁴ and fitted turbulence parameters γt=10−7 and 10−6 respectively. Assuming a linear sound speed gradient, refraction effects may be included [27] by adding a term
(11.36)
to (11.35), where γ1 is intended to include effects of both turbulence and refraction. In Figure 11.21, this latter modification has been used to compare with data obtained under downward-refraction conditions at Hucknall. Additional data for A-weighted levels as a function of range have been generated from corrected level difference measurements by Parkin and Scholes under low wind and isothermal conditions at a different airfield [29]. These ‘data’ and the corresponding predictions are shown in Figure 11.20(a) also. By means of the formulations (11.35) and (11.33), differences in the measured attenuation rates at the two airfields under acoustically neutral conditions are predicted to be the result of differences in turbulence rather than the result of differences in ground parameters. The ISO octave band method predictions (see Chapter 12) are also in good agreement with these data, giving a slight underestimate of the measured attenuation.
Figure 11.21 Data for A-weighted levels under downwind conditions (wind speed up to 6 m s−1 at 6.4 m), obtained with receivers 6.4 m
Analytical approximations including ground effect
377
above grassland at Hucknall, compared with predictions (solid line) using (11.33) augmented by the refraction term (11.36). The values of LWA and γg obtained for acoustically neutral conditions (Figure 11.20(b)) have been used and γ1=−3.25×10⁻⁵. The broken line represents the corresponding predictions for acoustically neutral conditions. The dash-dot line is the result of applying the ISO octave band method (see Chapter 12).
Figure 11.22 Data for A-weighted levels under downwind conditions (wind speed up to 6 ms−1 at 6.4 m), obtained with receivers 6.4 m above grassland at Hucknall, compared with predictions using (11.37) with LEWA=164 dB, γg=7×10⁻⁴ and γt=8×10⁻³ (solid line) or 4×10⁻² (broken line). Golębiewski and Makarewicz [29] have suggested that the effect of turbulence, and hence γt, should be regarded as sound path height dependent. Indeed (11.35) and (11.36) may be rewritten in the form
(11.37)
Predicting outdoor sound
378
where LEWA, γg and γt are adjustable parameters and χ depends on temperature and humidity. Figure 11.22 shows that having fixed LEWA and γg, at values of 164 dB and 7×10⁻⁴ respectively, the Hucknall downwind data are bracketed by 8×10⁻³≤γt≤4×10⁻².
References 1 K.M.Li, K.Attenborough and N.W.Heap, Comment on near-grazing propagation above a soft ground, J. Acoust. Soc. Am., 88(2):1170–1172 (1990). 2 A.L’Espérance, P.Herzog, G.A.Daigle and J.R.Nicolas, Heuristic model for outdoor sound propagation based on an extension of the geometrical ray theory in the case of a linear sound speed profile, Appl. Acoust., 37:111–139 (1992). 3 K.M.Li, On the validity of the heuristic ray-trace based modification to the Weyl Van der Pol formula, J. Acoust. Soc. Am., 93:1727–1735 (1993). 4 K.M.Li, Propagation of sound above an impedance plane in a downward refracting atmosphere, J. Acoust. Soc. Am., 99:746–754 (1996). 5 K.M.Li, A high-frequency approximation of sound propagation in a stratified moving atmosphere above a porous ground surface, J. Acoust. Soc. Am., 95:1840–1852 (1994). 6 V.E.Ostashev, Ray acoustics of moving media, Izv. Atmos. Oceanic Phys., 25(9): 661–673 (1989). 7 M.M.Boone and E.A.Vermaas, A new ray-tracing algorithm for abritrary inhomogenous and moving media, including caustics, J. Acoust. Soc. Am., 90:2109–2117 (1991). 8 L.M.Brekhovskikh, Waves in Layered Media, Academic Press, New York, second edn. (1980), pp. 389–395. 9 R.J.Thompson, Ray theory for an inhomogeneous moving medium, J. Acoust. Soc. Am., 51:1675–1682 (1972). 10 D.I.Blokhintzev, NACA Tech. Memo. 1399 (1956). 11 F.Walkden and M.West, Prediction of enhancement factor for small explosive sources in a stratified moving atmosphere, J. Acoust. Soc. Am., 84:321–326 (1988). 12 K.M.Li, S.Taherzadeh and K.Attenborough, Some practical considerations for predicting outdoor sound propagation in the presence of wind and temperature gradients, Appl. Acoust., 54(1):27–44 (1997). 13 W.H.Press, B.P.Flannery, S.A.Teukolsky and W.T.Vetterling, Numerical Recipes in FORTRAN 77, Cambridge U.P., second edn. (1992), Ch. 16 for the Bulirsch-Stoer method and Ch. 9 for the Brent method. 14 A.L’Espérance, P.Herzog, G.A.Daigle and J.R.Nicholas, Heuristic model for outdoor sound propagation based on an extension of the geometrical ray theory in the case of a linear sound speed profile, Appl. Acoust., 37(1):111–139 (1992). 15 R.Raspet and W.Wu, Calculation of average turbulence effects on sound propagation based on the fast field program formulation, J. Acoust. Soc. Am., 97(1):147–153 (1995). 16 R.Raspet, A.L’Espérance and G.A.Daigle, The effect of realistic ground impedance on the accuracy of ray tracing, J. Acoust.Soc. Am., 97(1):154–158 (1995). 17 K.M.Li, K.Attenborough and N.W.Heap, Source height determination by ground effect inversion in the presence of a sound velocity gradient, J. Sound Vib., 145:111–128 (1991). 18 I.Rudnick, Propagation of sound in open air, in Handbook of Noise Control, edited by C.M.Harris, McGraw Hill, New York (1957), Ch. 3, pp. 3:1–3:17. 19 T.Hidaka, K.Kageyama and S.Masuda, Sound propagation in the rest atmosphere with linear sound velocity profile, J. Acoust. Soc. Jpn. (E), 6:117–125 (1985). 20 R.Makarewicz, Near-grazing propagation above a soft ground, J. Acoust. Soc. Am., 82: 1706–1711 (1987).
Analytical approximations including ground effect
379
21 R.Makarewicz, Comment on ‘near-grazing propagation above a soft ground’, J. Acoust. Soc. Am., 88(2):1172–1175 (1990). 22 K.Attenborough and K.M.Li, Ground effect for A-weighted noise in the presence of turbulence and refraction, J. Acoust. Soc. Am., 102(2):1013–1022 (1997). 23 I.S.Gradshteyn and I.M.Ryzhik, Tables of Integrals, Series and Products, Academic, New York (1980), 496, 3.953.1 and 3.535.2. 24 ESDU Data Item No.940355, The correction of measured noise spectra for the effects of ground reflection, ESDU International plc, London (1994). 25 R.Makarewicz and P.Kokowski, Simplified model of ground effect, J. Acoust. Soc. Am., 101:372–376 (1997). 26 R.Makarewicz, A simple model of outdoor noise propagation, Appl. Acoust., 54: 131–140 (1998). 27 R.Makarewicz, Industrial noise from a point source, J. Sound Vib., 220(2):193–201 (1999). 28 P.H.Parkin and W.E.Scholes, The horizontal propagation of sound from a jet close to the ground at Radlett, J. Sound Vib., 1:1–13 (1965). 29 R.Golębiewski and R.Makarewicz, Engineering formulas for ground effects on broadband noise, Appl Acoust., 63:993–1001 (2002).
Chapter 12 Prediction schemes 12.1 Introduction Since outdoor sound propagation involves such a complicated combination of dependencies on source characteristics, source-receiver geometry, intervening terrain and meteorology, empirical and semi-empirical schemes for predicting outdoor noise are rather popular. Frequently, they are ‘customized’ for a particular source type. Consequently, there are separate prediction schemes for road traffic, rail traffic, industry and aircraft. In this chapter we review some of the ‘customized’ schemes, with special emphasis on those that apply in the United Kingdom. A recent EC programme (HARMONOISE [1]) has worked towards a single method of predicting propagation which is to be used together with specific source level predictors. A brief review of the HARMONOISE scheme is given in section 12.7. First, schemes for predicting industrial noise are discussed.
12.2 ISO 9613–2 12.2.1 Description ISO 9613–2 [2] is empirically based and follows closely the structure of the Nordic scheme for outdoor industrial noise prediction [3]. This section describes the essential features of the method, details various general criticisms and compares the standard’s ground effect predictions with data from 1992 tests using a fixed jet engine. The aim of the ISO standard is to enable calculation of octave band Leq levels (and hence LAeq) of environmental noise at distant locations up to the order of 1 km from various types of ground-based sound sources with known power spectra under ‘average’ meteorological conditions favourable to propagation. Such conditions are defined as those that occur downwind of the source (wind direction within ±45° of the line between source and receiver and wind speeds up to 5 m s−1) or under a temperature inversion. By restricting attention to moderate downwind conditions or temperature inversions the ISO working group (WG24) hoped to limit the effects of variations in meteorological conditions as well as to provide a basis for predicting worst-case (i.e. highest) noise exposures. If only the A-weighted sound power of the source is known, rather than the octave band power levels, then the standard recommends use of the 500 Hz attenuation values. However it offers an empirical broadband A-weighted level formula for the ground effect (see (12.8)).
Prediction schemes
381
The standard is intended to bridge the gap between standards specifying methods for determining the sound power levels emitted by various noise sources, such as machinery and specified equipment (ISO 3740 series), or industrial plants (ISO 8297), and the ISO 1996 series of standards which specify the description of noise outdoors in community environments. ISO 9613–2 allows for source directivity and size, geometrical wavefront spreading, air absorption, ground effect, reflection from surfaces and screening by obstacles. The ground effect calculation includes ‘hard’ and ‘soft’ interfaces. Reflection from obstacles includes vertical edges of buildings and a detailed correction for façade reflection. The screening calculations include thin, thick or multiple-edge barriers and include a correction for performance degradation associated with meteorological effects. An informative Annex concerns various other attenuating environments such as trees (described in terms of their foliage only) and arrays of buildings. All of these contributions are assumed to be arithmetically additive except for those due to ground effect and screening by horizontal barriers. A distinction is drawn in the standard between short-term predictions, say for a given day, and long-term predictions, corresponding to averages over a month or a year, and a correction for making this distinction is included. Although this standard is outlined here, this cannot substitute for a detailed reference to the original. 12.2.2 Basic equations The average octave band SPL(Leq) downwind direction at a receiver location is calculated for each point source and its image sources, and for eight octave bands with nominal midband or centre frequencies from 63 to 8 kHz. The following equation is used to determine the eight octave band levels:
LfT(DW)=LW+D−A (12.1) where LW is the octave band sound power level (dB) produced by the point source relative to a reference sound power of 10−12 Watts. D is the directivity correction (dB) that describes the extent to which the Leq from the point source deviates in various directions from the level due to an omni-directional point sound source producing sound power level LW. For an omni-directional point source radiating into free space D=0. A dB is the total octave band attenuation during propagation from the point source to the receiver which is calculated as the sum of five contributions, that is, A=Adiv+Aatm+Aground+Ascreen+Amisc (12.2) where Adiv is the attenuation due to geometrical divergence; Aatm is the attenuation due to air absorption; Aground is the attenuation due to the ground effect; Ascreen is the attenuation due to screening and Amisc is the attenuation due to other miscellaneous effects (treated in
Predicting outdoor sound
382
the Annex). The calculations of the above terms are detailed for the eight octave bands in various sections of the standard. The total A-weighted downwind sound pressure (dB) for n sources of noise is calculated according to
(12.3)
where Af(j) is the j-th weight in the A-weighted network. On the basis of this, the long-term average A-weighted sound pressure level (e.g. over several months) is predicted by LAT(LT)=LAT(DW)−Cmeteo (12.4) where Cmeteo is the meteorological correction (see (12.13)). 12.2.2.1 Geometrical divergence For a point source of a spherical wave the geometrical divergence is predicted by
(12.5) where d is the distance to the receiver and d0=1 m is the reference distance. 12.2.2.2 Atmospheric absorption The attenuation (dB) due to atmospheric absorption during propagation through a distance d(m) is given by
(12.6) where the frequency-dependent atmospheric attenuation coefficient α(dB) is predicted using expressions detailed in ISO 9613–1.
Prediction schemes
383
12.2.2.3 The ground effect ISO 9613–2 specifies three distinct regions for ground attenuation, resulting from the interference between sound reflected from the ground surface and the sound propagating directly between the source and receiver (see Figure 12.1). The source region occupies a distance 30hs
Figure 12.1 The calculation of ground effect according to ISO 9613–2. and receiver regions. If dp<(30hr+30hs), the source and receiver regions will overlap, and there is no middle region. The acoustic properties of each ground region are specified by a ground factor, G. Three categories of reflecting surface are specified – hard ground (G=0): paving, water, ice, concrete and other surfaces with low porosity – porous ground (G=1): grassland, trees, vegetation, farm land – mixed ground (0
Aground=As+Ar+Am (12.7) where As, Ar and Am are the source, receiver and middle region components of the attenuation with corresponding ground factors Gs, Gr and Gm. These values are defined using the expressions provided in table 2 and figure 2 of ISO 9613–2. Alternatively, for some specific conditions when much of the ground is porous and the sound is not a pure tone, the ground attenuation (dB) can be calculated by the formula
(12.8)
Predicting outdoor sound
384
where hm is the mean height of the propagation path above the ground (see figure 3 in ISO 9613–2). In this case the directivity correction is given by
(12.9) which accounts for the increase in sound power level of the source due to reflections from the ground near the source. 12.2.2.4 Screening According to the standard, the effect of an object which obstructs the propagation of sound should be taken into account if − the surface density is greater than 10 kg m−2 − the object has a solid surface without large cracks or gaps − the horizontal dimension of the object normal to the source-receiver line is larger than the acoustic wavelength λ at the nominal mid-band frequency for the octave band of interest. Diffraction over the top edge and around a vertical edge of a screen can be important. In this case the screening correction (dB) for the top edge is calculated by Ascreen=Dz−Aground>0 (12.10) and for the vertical edge by
Ascreen=Dz (12.11) where the screening attenuation in the octave band is
(12.12) The symbols in expression (12.12) are defined by – C2=20 (including the effect of ground reflections) – C3=1 for single diffraction and
Prediction schemes
385
– C3={1+(5λ/e)2}/{1/3+(5λ/e)2} for double diffraction, where e is the width of the obstacle, – z is the difference between the path lengths of the direct and diffracted sound (m) – KW is the correction factor for meteorological effects for z>0 and KW=1 for z<0. To calculate the screening attenuation it is assumed that only one significant sound propagation path exists from the sound source to the receiver. The calculated screening attenuation is limited to a maximum of 20 dB for single diffraction and to 25 dB for double diffraction. 12.2.2.5 Meteorological correction Calculation of a long-term average A-weighted sound pressure level requires allowance for the effect of a variety of meteorological conditions, including those that are favourable and unfavourable for sound propagation. The standard predicts levels only under downwind or inversion conditions. This stipulation limits the meteorological variability and enables worst case prediction. The standard suggests a factor by which predicted short-term downwind levels may be corrected to long-term predictions by means of a reduction (by less than 5 dB) for the fraction of the period likely to experience downwind conditions calculated on a total energy basis. This is accounted for by the meteorological correction term (see (12.4)) which value is predicted from
(12.13) where C0 (dB) is a constant which depends on the local meteorological statistics. Typical values are 0≤C0≤5. The ISO 9613–2 method claims ±3 dB accuracy at ranges up to 1 km for average sound propagation heights of less than 5 m. Even greater accuracy is claimed for higher source heights and ranges of less than 100 m. However it is important to note that this accuracy is claimed for the prediction of overall A-weighted levels. It is accepted that errors in individual octave bands may be larger. Nevertheless, the claimed accuracy is comparable to that validated for road traffic noise prediction schemes and greater than that validated for comparable existing industrial noise schemes such as the CONCAWE method [4]. The draft of the standard made reference to an Appendix intended to demonstrate the existence of a substantial validating database. However, the published version does not contain this Appendix. 12.2.3 General critique The scheme does not offer much improvement in scope or accuracy over existing customized schemes for predicting noise from roads and railways in the United Kingdom
Predicting outdoor sound
386
[5, 6] except in its explicit account of meteorological effects. However, it has filled an unoccupied niche as an international standard method for the prediction of outdoor industrial noise and it represents a considerable advance on methods such as that proposed in BS5228 for predicting construction noise. BS4142:1990 states that ‘When predicting the noise level from a planned new source give due consideration to the possible effects of weather conditions and ground conditions on the sound propagation in the planned location’ without giving guidance on how this is to be done. A method like that in ISO 9613–2 should be invaluable when predicting noise as part of the planning process. When the first draft of ISO 9613–2 was circulated for comment in the United Kingdom, it was accompanied by the statement that ‘This draft standard is unlikely to be implemented as a British Standard because the relevant UK committee does not consider that there is a need for it in the UK.’ This stance arose from the declared first mission for the relevant ISO working group (WG 24) which was to develop an internationally accepted method for predicting atmospheric absorption. The resulting atmospheric absorption calculation method, rather similar to the ANSI method, has been published as ISO 9613–1. The standard received many general and specific criticisms at draft stage. A general criticism is that it offers another empirical method at a time when there are an increasing number of validated theoretical models for outdoor sound propagation that could be used [7]. A problem with all empirical schemes is that they are valid only for the data set on which they are based. The ISO standard recognizes this limitation explicitly and states that its use should be confined to ‘situations where there exists a substantial data-base of measurements for verification’. The ISO standard claims also that its database is extensive. However, as discussed later, at least in one respect this statement is a controversial one. During the ‘draft for comment’ stage of the standard, two countries noted that in their opinion, the method proposed in the standard is worse than other existing methods. Another general criticism relates to the inconsistent complexity of the standard. For example the proposed frequency-dependent ground effect correction is rather more complicated than that proposed for other attenuation mechanisms treated within the standard, for example attenuation through housing. The standard claims to be ‘applicable in practice to a great variety of noise sources and environments’ and it is intended to be applied to a variety of fixed industrial sources and to relatively slow-moving (negligible Doppler effect) sources, including road and rail traffic and construction equipment. Specific exclusions are aircraft in flight and blast noise from mining, military or similar operations. However the Nordic scheme on which the standard is based has been validated only against data collected around fixed industrial premises (an asphalt mixing plant, a plant for feedstuff and an oil refinery) [8]. Transportation or construction noise sources were not included in the validation exercises. Moreover there are validated schemes already in use for road and rail traffic [5, 6]. An extensive critique [9] has indicated several aspects of the standard that make it unsuitable for railway noise. For example the standard assumes that any source may be described by an array of directional point sources whereas a finite line of dipole sources has been found more appropriate for noise from trains. Several potential sources of outdoor noise nuisance such a open air music festivals, Theme Parks, sporting stadiums
Prediction schemes
387
and clay pigeon shooting are not excluded specifically, yet, clearly, are not covered by the methods proposed within ISO 9613–2. 12.2.4 Accuracy of ISO 9613–2 ground effect The ISO method gives empirical formulae for calculating ground effect in each of the octave bands from 63 to 8000 Hz and for each of the regions near source, receiver and in the middle of the propagation path. A consequence of these formulae is that the presence of ground adds 4.5 dB to the level in the 63 Hz octave band irrespective of source and receiver heights, range and ground cover. The predictions for the 2000 Hz octave band and above are zero where the ground is completely soft. As in other schemes [5, 6], distinction is made only between acoustically hard and acoustically soft ground. According to ISO 9613–2, any ground of low porosity is to be considered acoustically hard and any grass-, tree-, or potentially vegetation-covered ground is to be considered acoustically soft. Data from trials using a fixed jet engine source [10] have been used to compare with ISO 9613–2 predictions from a source at 2.16 m height to a receiver at 1.2 m height above continuous soft ground. The data used for comparison with these prediction formulae were acquired using a Rolls Royce Avon single-stream jet engine mounted on a stand such that the centre of the exit nozzle was 2.16 m above the ground. Microphone arrays were deployed over grass along a line at 22.5° to the engine exhaust centre line and at 7.5° to the peak jet noise direction. The source-to-receiver direction was 57° West of South. Each microphone array consisted of microphones at 1.2 m and 6.4 m above the ground and arrays were positioned at 152.4 m, 457.2 m, 762 m and 1158 m from the source. Temperature, wind speed and direction were measured at 0.025 m and 6.4 m heights at a weather station approximately 500 m from the source. Within each trial run, the data were averaged over 30 s. From comparison of ISO octave band predictions, assuming continuous soft ground cover, air absorption for 10°C and 70% RH, with data for the horizontal level difference between receivers at 152.4 and 1158 m range for the zero wind and downwind conditions, it is clear that the ISO scheme predicts maximum level differences in a lower octave band than found in the measured data, even under downwind conditions. The poor comparison with zero wind octave band data has been noted previously by Lam [11]. The standard itself points out that errors in individual octave bands may be larger than the ±3 dB accuracy claimed for overall A-weighted level predictions. To obtain A-weighted level predictions from the ISO scheme for comparison with values obtained from the fixed jet engine data at Hucknall, a notional source power spectrum level is needed. This has been obtained from measured no wind/ low turbulence data measured at 152.4 m at Hucknall (Table 12.1) after correcting for theoretically predicted effects of ground effect and turbulence [12]. The resulting A-weighted predictions for receivers at 1.2 m height are shown as a function of range in Figure 12.2. It is clear that as long as octave band calculations are made, the ISO scheme predicts an A-weighted attenuation similar to that measured for downwind conditions. It should be noted that the ISO scheme includes also a simple equation for predicting A-weighted ground effect for broadband sources. For the jet engine source, this predicts much less
Predicting outdoor sound
388
attenuation than the octave band method (see also section 12.4.2). Also shown in Figure 12.2 are predictions of various formulaic fits. Publication of ISO 9613–2 responded to the need for a standard method of predicting noise from fixed noise sources outdoors and represented a step towards Table 12.1 Meteorological data corresponding to sound level data in Figure 12.2 Run 453 Block No. 3 4 5 6
Direction Temperature Temperature Wind Turbulence Wind variable speed at speed at relative to at ground (°C) at 6.4 m (°C) 6.4 m line of mics. (squared wind ground (°) speed ratio) (m s−1) height (m s−1) 4.09 4.09 4.33 3.89
6.44 6.11 5.93 6.07
10.0 20.5 17.8 10.8
15.0 14.9 14.9 14.9
15.0 15.0 15.0 15.0
Figure 12.2 Comparison of measured downwind levels at Hucknall (run 453, blocks 3–6 (see Table 12.1): ×, +, ◊, ○, □) with: (a) ISO 9613–2, normalised at the 152.4 m downwind level (thick solid line); (b) neutral LA(152.4)+2–26 log(r/152.4) (dotted); (c) spherical spreading plus 0.5 dB per 100 m from 152.4 m downwind LA (dash-dot) and measured no wind, low turbulence data (run
0.1202 0.1606 0.1729 0.1028
Prediction schemes
389
454, block 20:○) with; (d) spherical spreading plus 1.35 dB per 100 m from 152.4 m neutral LA (dash); (e) LA (152.4 neutral) −35 log(r/152.4) (thin solid). such a standard. Nevertheless, there are several deficiencies and controversial aspects in the ISO scheme, concerning its empirical basis, its scope, its applicability and the chosen reference meteorological condition. Comparison with data obtained with a fixed jet engine source reveals that while the scheme gives incorrect predictions of ground effect in individual octave bands, it enables reasonable estimates of A-weighted downwind levels over grassland, as long as octave band calculations are used as the basis. The ESDU scheme [12] makes use of a full wave calculation for ground effect (see Chapter 2) and is capable of predicting narrow-band levels. If only A-weighted levels are of interest, then it is possible to make use of several approximations [13] and to use the resulting expressions to investigate possibilities for optimizing ground effect.
12.3 CONCAWE 12.3.1 Introduction Like the ISO scheme, the CONCAWE scheme [14] is essentially empirical and was derived for use by the petrochemical industry. Although it was derived for a specific application it contains generic material which could permit its wider use for predicting outdoor noise from fixed sources including industrial and construction plant. In some ways the CONCAWE scheme does not contain as many provisions as the ISO scheme. For example, the CONCAWE scheme does not provide for screening by vertical edges, and while acknowledging the possibility, does not contain specific provision for attenuation during propagation through buildings. In two ways it is more sophisticated than the ISO scheme. First, the CONCAWE scheme permits predictions for a wide range of meteorological conditions rather than being confined to ‘moderate downwind’. Second, it enables calculation of the reduction of ground effect in octave bands due to the presence of a (horizontal edge) barrier, rather than assuming simply, like the ISO scheme, that the ground effect is lost if a barrier is present. Here we provide a survey of important elements of the scheme and comment on its applicability in the light of current knowledge. As a source of information about the CONCAWE scheme, this contribution is not intended to substitute for a thorough reading of the source report and the details in the background references that it cites. 12.3.2 Basis and provisions of scheme The scheme is based on a survey of literature that was available prior to 1980, field data collected at ranges up to 1300 m around three complex sources ranging from a small process site to a major petroleum and petrochemical industry complex and a series of measurements using octave band filtered white noise from source heights between 3 and
Predicting outdoor sound
390
9 m and ranges between 100 and 1000 m over flat grassland. The component sources for the three sites were between 0 and 25 m above ground level. The scheme allows for spherical spreading and corrections for atmospheric absorption, ground effect (including propagation path height influence), barrier effect and meteorological (refraction) effects. The corresponding calculations are in octave bands and require an octave band source power spectrum. Meteorological conditions are described in terms of six categories defined in terms of the Pasquill classification system used when predicting air quality and vector wind speed between source and receiver. The Pasquill stability classifications are based on incoming solar radiation, time of day and wind speed. There are six classes: A– F. Class A represents a very unstable atmosphere with strong vertical air transport and mixing. Class F represents a very stable atmosphere, with weak vertical air transport. Class D represents a meteorologically neutral atmosphere with a logarithmic wind speed profile and a zero temperature profile. Note that this is not the same as an acoustically neutral atmosphere since it includes a wind velocity gradient. In a stable atmosphere, the temperature increases with height and the wind-speed gradients are larger than is usual for a meteorologically neutral atmosphere. In an unstable atmosphere, the temperature decreases with height and wind-speed gradients are smaller than usual for a meteorologically neutral atmosphere. Usually, the atmosphere is unstable (classes A, B, C and D) by day and stable (classes D, E and F) by night. Acoustically neutral conditions are assumed to correspond to CONCAWE meteorological category 4 and strong downwind conditions to meteorological category 6. The meteorological corrections take the form of polynomials of order 3 in terms of log(horizontal separation of source and receiver), that is they are of the form a1+a2 log(d)+a3(log(d))2+a4(log(d))3 (12.14) where ai i=1−4 are positive or negative constants having different values for each octave band centre frequency and each meteorological category. The basic octave band ground effect corrections for acoustically neutral and various vector wind conditions are derived from the classical data obtained by Parkin and Scholes [15, 16] for a fixed jet engine source at a height of 1.85 m and for ranges to 1097 m over a grass-covered airfield. To extrapolate from these data involving a single source height to a scheme applicable to any source height, the CONCAWE scheme assumes that the ground effect diminishes non-linearly as the grazing angle increases and is zero at a grazing angle of 5°. The validation experiments with filtered octave band white noise were restricted to grazing angles up to 2° and so were unable to verify this assumption about the variation of ground effect with source height. As in the ISO scheme, CONCAWE allows for the simultaneous presence of acoustically hard and acoustically soft ground along the propagation paths. However it suggests that only the distance travelled over the soft ground is used when calculating the ground effect correction in octave bands, rather than defining proportions of source, middle and receiver ground regions as required by the ISO scheme. Since separate corrections for wind and ground are given in the CONCAWE scheme, it is tempting to think of them as separate effects. However, the presence of wind- and temperature-gradients influence propagation by altering the ground effect, so it is more
Prediction schemes
391
accurate to regard the combination of the ground and wind corrections as the excess attenuation due to ground in the presence of wind. In the CONCAWE scheme, the calculation of barrier effects is based on the widely accepted and extensively used formula due to Maekawa (9.28) [17]. For a barrier of negligible thickness, the formula gives a relationship between the barrier induced attenuation, the wavelength of the sound and the difference between the length of the path from source to receiver diffracted around the top of the barrier and that travelling directly from source to receiver. To predict propagation in the presence of a barrier close to the source, the CONCAWE scheme applies a correction (reduction) to the ground effect term based on a change in the effective source height to coincide with the top of the barrier. Although the scheme does not give an explicit method, it recommends use of a ray-tracing method [18] for calculating meteorological influences on barrier performance. This method, particularly important for downwind receivers, involves calculation of the ray path curvature (assumed circular) from the sound speed gradient. The barrier effect is calculated subsequently by using the curvature to define the locations of a virtual source and receiver corresponding to positions where an equal barrier effect would be produced under no-wind conditions. The 95% confidence limits for predictions using the scheme based on comparison with validation measurements vary between 6.9 dB(A) for meteorological category 3 (slight upwind) and 4.5 dB(A) for meteorological category 6 (strong downwind). The limits in individual octave bands are consistently higher for the 250 Hz octave band where ground effects may be expected to be important and in the 4 kHz octave band where signal-tonoise ratio is often a problem. 12.3.3 Some criticisms of CONCAWE Since some of the largest discrepancies between measurement and prediction and variations between measurements are to be found in octave bands where ground effects are dominant, it seems that progress could be made by allowing for more classes of ground condition than simply acoustically hard or soft. This would mirror more closely the number of classes used to describe meteorological conditions. The meteorological categories in CONCAWE are based, in part, on the observed wind speed. However there is no indication, within the part of the scheme in which the meteorological categories are defined, of the height at which this wind speed is to be measured. This is a vital omission since the wind’s influence on propagation depends on wind speed gradient rather than wind speed alone. It is reported elsewhere in the report proposing the scheme [14] that wind speeds for the Parkin and Scholes measurements and the measurements carried out to validate the CONCAWE scheme were obtained at 11 m (33 feet) height. If a linear wind speed profile is assumed, this implies a positive gradient of greater than 0.27 s−1 for meteorological category 6. Use of the recommended method for calculating downwind effects on barrier performance requires knowledge of the wind speed gradient. If the input gradient exceeds the implied value for meteorological category 6 to a significant extent, then calculations may lead to anomalous results for barrier effect whereby the total attenuation during downwind conditions with a barrier present is predicted to be less than that without a barrier.
Predicting outdoor sound
392
A high degree of turbulence can have an important influence on ground effect at long ranges, even under otherwise acoustically neutral conditions, since it destroys the coherence and hence possibility of interference between direct and ground-reflected sound. Destruction of coherence between various sound paths by turbulence together with scattering into the shadow zone will influence barrier performance also. Consequently it is important to define the turbulence values implied by each of the meteorological categories. Probably because the effect of turbulence was not realized at the time that Parkin and Scholes took their data, it was not monitored by them. Neither was it deduced, in terms of the variation statistics, from the continuous monitoring of wind speed fluctuations during the validating measurements for the CONCAWE scheme. Nevertheless the CONCAWE scheme represents important background to any study of outdoor sound prediction. Its provisions for differing meteorological conditions and for interactions between barrier, ground and meteorological effects represent more sophisticated treatments than those in ISO 9613–2. The CONCAWE report acknowledges that for its intended use by the petrochemical industry, improvements could follow from better allowance for the variation in ground effect with source height, consideration of partial barrier effects and a more definitive allowance for in-plant screening. Additional directions for improvement with regard to specification of meteorological and ground conditions have been pointed out here.
12.4 Calculation of road traffic noise (CRTN) Semi-empirical modelling is, perhaps, the most practical tool for the prediction of broadband traffic noise levels in urban environments. This tool is extensively used by acoustical consultants, land planners and highways engineers. The prediction technique is largely based on measured data to evaluate specific parametric variations and is supported by theoretical analysis. One of the original implementations of semi-empirical modelling tools was carried out by Delany et al. [19] for the United Kingdom’s Department of the Environment to enable calculation of entitlement to sound insulation treatment for residential properties. The method also provides guidance on the prediction of noise in connection with the design and location of highways and other aspects of environmental planning. Delany provided a flow chart for predicting noise from single roads (see Figure 12.3). This algorithm should be regarded as a typical scheme used in the majority of semi-empirical methods for noise level assessment and depends upon the flow-rate, the speed of traffic, the composition of traffic, the gradient of the road and parameters related to the propagation from the source to the receiver. In the development of this particular method, data from over 2000 field measurements were collected together to form a databank and used to derive
Prediction schemes
393
Figure 12.3 Delany’s flow-chart for prediction of traffic noise level from a single road. semi-empirical equations which are the foundation of the current United Kingdom’s standard prediction method of Calculation of Road Traffic Noise [5]. In the Calculation of Road Traffic Noise (CRTN) all the levels are expressed in terms of the A-weighted sound level exceeded for 10% of the time, that is the hourly or 18-hour L10 index. The value of hourly L10 index is the noise level exceeded for just 10% of the time over a
Predicting outdoor sound
394
period of one hour. The 10-hour L10 index is the arithmetic average of the values of hourly L10 for each of the 18 one-hour periods between 06:00 and 24:00 hours.
Figure 12.4 An illustration of shortest slant distance between a reception point and an effective source line representing a flow of traffic (Figure 1 from CRTN). The source of traffic noise (the source line) is taken to be a line 0.5 m above the carriageway level and 3.5 m from the nearside carriageway edge (see Figure 12.4). The method of predicting traffic noise at a reception point consists of five main parts: – divide the road scheme into one or more segments such that the variation of noise within the segment is small; – calculate the basic level at a reference distance of 10 m away from the nearside carriageway edge for each segment; – assess for each segment the noise level at the reception point taking into account distance attenuation and screening of the source line; – correct the noise level at the reception point to take into account site layout features including reflection from buildings and façades, and the size of the source segment; – combine the contributions from all segments to give the predicted noise level at the reception point for the whole road scheme. These steps in the procedure are shown as a flow chart in Figure 12.3.
Prediction schemes
395
If the noise levels vary significantly along the length of the road, then the road is divided into a small number of separate segments so that within any one segment the noise level variation is less than 2 dBA. Each segment is treated as a separate noise source and its contribution is determined accordingly. The final stage of the calculation process, to arrive at the predicted noise level, requires the combination of noise levels contributions from all the source segments, which comprise the total road scheme. For a single road segment road scheme there is no adjustment to be made. For road schemes consisting of more than one segment, the predicted level at the reception point is to be calculated by combining the basic hourly or 18-hour levels predicted for N segments, L10,i, using
(12.15)
where
L10,i=Li+∆pV,i+∆G,i+∆TD,i+∆D,i+∆GC,i+Ai+∆OF,i+∆S,i. (12.16) The following corrections are required for each segment: – ∆pV,i correction for mean traffic speed; – ∆G,i correction for road gradient; – ∆TD,i correction for road surface texture; – ∆D,i correction for distance; – ∆GC,i correction for ground cover; – Ai barrier correction; – ∆OF,i correction for opposite façade; – ∆S,i correction for size of segment. The basic A-weighted hourly noise level hourly is predicted at 10 m from the nearside carriageway according to the following equation
Li(hourly)=42.2+10 log10 q, (12.17) where q is the hourly traffic flow (vehicles/hour). Alternatively the basic A-weighted noise level in terms of total 18-hour flow is Li-(18-hour)=29.1+10 log10 Q, (12.18)
Predicting outdoor sound
396
where Q is the 18-hour flow. Here it is assumed that the basic velocity V is 75 km h−1, the percentage of heavy vehicles p is 0 and the gradient G is 0%. It is also assumed that the source line is 3.5 m from the nearside edge of the road for carriageways separated by less than 5 m. If the two carriageways are separated by more than 5 m, or where the heights of the outer edges of the two carriageways differ by more than 1 m, the noise level produced by each of the two carriageways must be evaluated separately and then combined using expression (12.15). For the far carriageway, the source line is assumed to be 3.5 m in from the far kerb and the effective edge of the carriageway used in the distance correction is 3.5 m nearer than this, that is 7 m in from the edge of the farside carriageways. 12.4.1 Correction for mean traffic speed, percentage of heavy vehicles and gradient The correction for percentage of heavy vehicles and traffic speed are determined using the following expressions
(12.19) In this expression the percentage of heavy vehicles is p=100f/q=100F/Q, where f and F are the hourly and 18-hour flows of heavy vehicles, respectively. Equation (12.19) is applied to the basic hourly or 18-hour levels. The value of V to be used in (12.19) depends upon whether the road is level or on a gradient. For level roads the traffic speed, V, to be used in the calculation (12.19) is the value for the appropriate class of road. For roads with a gradient, traffic speeds must be reduced by ∆V km h−1 evaluated according to the gradient and the percentage of heavy vehicles from
(12.20) where G is the gradient expressed as a percentage. Once the speed of traffic is known, then the adjustment to the A-weighted level for the extra noise from traffic on a gradient is calculated from ∆G=0.3 G. (12.21)
Prediction schemes
397
12.4.2 Correction for type of road surface The A-weighted noise level depends upon the amount of texture on the road surface. For roads which are impervious to surface water and where, in expression (12.19) V≥75 km h−1, a correction to the basic noise level is applied. The corrections for concrete surfaces and bituminous surfaces are given, respectively, by ∆TD=10 log10(90TD+30)−20, (12.22) and ∆TD=10 log10(20TD+60)−20 (12.23) where TD is the texture depth measured by the sand-patch test. If V<75 km h−1, then for impervious bituminous road surfaces ∆TD=−1 dBA and, for pervious road surfaces, ∆TD=−3.5. 12.4.3 Distance correction For the reception points located at distances d≥4 m from the edge of the nearside carriageway, the distance correction is given by
(12.24) where d′ is the shortest slant distance between the effective source and the receiver. Now it is necessary to decide whether the source line of the road segment is obstructed or unobstructed. In some cases, the source line can be partially obscured by intervening obstacles to the degree of screening may be slight. For these cases it is necessary to calculate the noise levels assuming both obstructed and unobstructed propagation taking the lower of the two resulting levels. 12.4.4 Ground cover correction If the ground surface between the edge of the nearside carriageway of the road or road segment and the reception point is totally or partially of an absorbing nature (e.g. grass land, cultivated fields or plantations) an additional correction to the A-weighted level for
Predicting outdoor sound
398
ground cover is required. This correction is progressive with distance and particularly affects the reception points close to the ground. The correction for ground absorption as a function of horizontal distance from edge of nearside carriageway dm, the average height and the proportion of absorbent ground, I, is given by of propagation,
(12.25)
(12.26)
(12.27) Expressions (12.25) to (12.27) are valid for d≥4 m. In these expressions the value of is taken to be the average height above the intervening ground of the propagation paths between the segment source line and the reception point and it is suggested to assume that the intervening ground is primarily flat (see Figure 12.1). If the ground cover is perfectly reflecting, then I=0, so no ground cover correction is applied. If the ground can be split into clear areas of reflecting and absorbing cover, then segmentation is required to separate areas where the ground cover can be defined as either absorbing or non-absorbing, so that the 2 dB(A) variation within a segment is not reached. In certain cases, where the intervening ground cover is a mixture of absorbing and non-absorbing areas and cannot be separated, then the ground cover correction should be calculated in accordance with expressions (12.25) to (12.27), but with the value of I as shown in Table 12.2. 12.4.5 Screening correction The screening effect of intervening obstructions such as buildings, walls, purpose-built noise barriers and so on needs to be taken into account. The degree of screening depends on the relative positions of the effective source position S, the reception point R and the point B where the diffracting edge along the top of the obstruction cuts the vertical plane (see Figure 12.5), that is normal to the road surface, containing both S and R. The region between the obstruction and the reception point is divided into the illuminated zone and shadow zone by the extended line SB as shown in Figure 12.5. The degree of screening is calculated from the path difference, δ m, of the diffracted ray path SBR and the direct ray path SR δ=SB+BR−SR=SB+BR−d′. (12.28)
Prediction schemes
399
The path difference is used to calculate the potential barrier correction to A-weighted SPL (12.29) where x=log10 δ, the coefficients Ai and the value n for the shadow and for the illuminated zones are given in Table 12.3 together with the ranges of validity. Table 12.2 Values for I (CRTN) Percentage of absorbent ground cover within the segment
I
<10 10–39 40–59 60–89 ≥90
0 0.25 0.5 0.75 1.0
Figure 12.5 On the calculation of the barrier correction (from CRTN).
Predicting outdoor sound
400
Note Path difference is calculated in the vertical plane, normal to the road surface, containing both R and S. Table 12.3 Values of the coefficients in expression (12.29) (from CRTN) Coefficients Shadow zone (3≤x≤+1.2) Illuminated zone (−4≤x≤0) A0 A1 A2 A3 A4 A5 A6 A7
−15.4 −8.26 −2.787 −0.831 −0.198 0.1539 0.12248 0.02175
0 0.109 −0.815 0.479 0.3284 0.04385
The method suggests that outside these ranges of validity, the barrier correction is A=−5 dB for x<−3 and 0 dB for x>1.2 if the receiver is in the shadow zone. If the receiver is outside the shadow zone, then A=−5 dB for x<−4 and A=0 dB for x>0. Predicted values of A>20 dB(A) should be considered as unrealistic. If the barrier is not parallel to the source line, then the potential barrier correction will vary along the barrier length. In this case it may be necessary to divide the barrier into a number of smaller segments within each of which the variation in the barrier correction is less than 2 dB(A). If barriers are installed, then the ground cover correction is ignored since the ground rays are obstructed. 12.4.6 Site layout The effects of reflections from buildings and other rigid surfaces result in the increase in the noise level and need to be considered. If the receiver is 1 m in front of a façade, then a correction of 2.5 dB(A) is added to the basic noise level. Calculations of noise levels along side roads lined with houses but away from the façades also require the same addition of the 2.5 dB(A). If there is a continuous line of houses along the opposite side of the road, then a correction for the reflections is required. The correction only applies if the height of the reflecting surface is at least 1.5 m above the road surface. The correction to the Aweighted level for the reflection from the opposite façade is
(12.30) where θ′ is the sum of the angles subtended by the reflecting façades on the opposite side of the road facing the reception point, and θ′ is the total angle subtended by the source
Prediction schemes
401
line at the reception point (see Figure 12.6). This correction is required in addition to the 2.5 dB(A) façade correction detailed earlier.
Figure 12.6 On the calculation of the reflection correction from the opposite façades and size of segment correction (from CRTN). 12.4.7 Size of segment The noise level at the reception point from the segment of the road scheme depends upon the angle θ (degrees) subtended by the segment boundaries at the reception point (see Figure 12.6). This angle is often referred to as the angle of view. The correction for angle of view is obtained using the expression
(12.31)
12.4.8 Multiple roads including road junctions Calculations of noise levels from multiple roads are achieved by combining the contributions from each individual length of road using the appropriate mean speed and ignoring any speed change at the junction. The overall predicted noise level is then obtained using expression (12.1).
Predicting outdoor sound
402
12.5 Calculation of railway noise (CRN) A similar empirical scheme for predicting railway noise is associated with the Noise Insulation (Railways and Other Guided Transport Systems) Regulations 1993. There are several features of this scheme however that differ from those in CRTN. It aims to predict either LAeq,18h (daytime) or LAeq,6h (night-time) rather than the L10 index. Secondly it works mainly with the sound exposure level, SEL, (or LAE) for each train which is converted, after allowances for distance, ground effect, reflections, gradient, source enhancements (e.g. by bridges), angle of view, screening and the number of trains, into the required LAeq. Apart from diesel locomotives, which are assumed to have a higher source height, the railway vehicle source is considered to be at the rail head, that is the top of the rail which is taken as zero height. The reference SEL for a train depends on its speed and is predicted by SEL=31.2+20 log(V)+10 log(N), (12.32a) where V is the speed and N is the number of vehicles in the train. The distance correction is given by
(12.32b) The railway noise scheme also has an explicit allowance for air absorption given by ∆d=−0.008d−0.2. (12.32c) The ground effect correction for propagation over acoustically soft ground is given by
(12.32d)
where d is the horizontal distance between near side rail and the reception point, ds is the slant distance from source to reception point (which must be at least 10 m) and is the mean propagation height.
Prediction schemes
403
Figure 12.7 shows predictions of attenuation rates with (horizontal) distance between source and receiver at 1.2 m height, due to ground effect and air absorption alone (i.e. excluding wavefront spreading which is different for the different sources) with reference to the values at 25 m (this is the reference distance for CRN). The CRTN and CRN curves have been calculated assuming source heights of 0.5 m and 0 m respectively and give roughly comparable results. The air absorption term (0.002d+0.2), causes the linear behaviour of the CRN predictions at longer ranges. The ISO prediction curves are based on use of the formula for ground effect on A-weighted levels from broadband sources (see (12.8)) and the air absorption value for 500 Hz assuming 20°C and 70% RH (α=2.8 dB km−1). It is noticeable that the ISO scheme predicts rather lower attenuation rates than the other two schemes beyond 50 m.
Figure 12.7 Comparison of attenuation rates due to ground effect and air absorption according to CRTN (solid line), CRN (broken line) and the ISO 9613–2 prediction scheme for roads (joined squares) and rail (joined circles).
Predicting outdoor sound
404
12.6 NORD2000 The NORD2000 scheme [20], financed by the Environmental Protection Agencies of the five Nordic countries, was started in 1996 and was finished in 2000. It allows for prediction of noise from all types of sources in 1/3 octave bands with centre frequencies from 25 to 10,000 Hz including any terrain profile, any combination of ground surfaces and any ‘regular’ weather condition. The goal was to achieve acceptable accuracy within 3000 m. The scheme includes allowances for air absorption, based on ISO 9613–1, ground effect, evaluated from geometrical ray theory and spherical wave reflection coefficient (Chapter 2), screening evaluated from diffraction theory combined with geometrical theory and reflections from obstacles by adding a mirror source and using a Fresnel zone approach. The effect of atmospheric refraction is calculated using a heuristic model based on the geometrical ray theory (Chapter 11). The model takes account of six categories of ground (Table 12.4) and effects of simple topography.
12.7 HARMONOISE Methods for predicting outdoor noise are undergoing considerable assessment and change in Europe as a result of a recent EC Directive [21] and the associated requirements for noise mapping. A European project HARMONOISE [1] Table 12.4 Categories of ground included in the NORD2000 model Categories
Examples
A. Very soft B. Soft forest floor C. Uncompacted, loose ground D. Normal uncompacted ground E. Compacted field and gravel F. Compacted dense ground G. Hard surfaces
Snow or moss like Short, dense heather-like or thick moss Turf, grass, loose soil Forest floor, pasture field Compacted lawns, park area Gravel road, parking lot Dense asphalt, concrete, water
has developed a comprehensive source-independent scheme for outdoor sound prediction. The approach has been to develop a state-of-the-art numerical reference model and to use it to validate a simpler engineering model which can be implemented in commercial software. As in NORD2000, various relatively simple formulae, predicting the effect of topography, for example, have been derived and tested against the more sophisticated numerical predictions of the reference model. For example, over mixed impedance ground, the engineering model uses a Fresnel zone approach (see Chapter 8). The reference model is a hybrid scheme which includes options for the source region and for outside the source region. Outside the source region, a Parabolic Equation (PE) model is used. Essentially, the PE method replaces the Helmholtz wave equation, which is a second order partial differential equation, by a first-order partial differential equation.
Prediction schemes
405
Sound propagation in the direction outward from the source is calculated by means of a finite-difference approximation based on a discretization of the atmosphere around the source in the form of a grid. The grid spacing is frequency-dependent and is of the order of one-tenth of a wavelength, both horizontally and vertically. Full details of the PE method and its several variants may be found elsewhere [22]. The effects of atmospheric refraction are taken into account by an effective sound speed approximation (see Chapters 1 and 8). The PE method can include screening and reflection by simple rectangular noise barriers through the Kirchhoff approximation (see Chapter 9). The discontinuous change of effective sound speed upon reflection may be taken into account. At the top of the grid an artificial sound-absorbing layer is used to eliminate spurious reflections. In situations with a flat ground surface without obstacles, the effective sound speed is a function of height only and log-lin profiles (see Chapter 1) are used. In situations with obstacles or hills, the effective sound speed varies with height and range, and a computational fluid dynamics (CFD) calculation of flow over an obstacle may be necessary. The sound-absorbing properties of the surface of the obstacle may be taken into account approximately by including a constant (real) reflection factor in the amplitude upon reflection. If PE cannot be applied and if refraction may be neglected, such as close to the source, ray-tracing calculations (RAY, see Chapter 11) or calculations based on the Boundary Element Method (BEM, see Chapters 8 and 9) are used. The BEM can handle arbitrary complex geometries, but is restricted to 2-D modelling due to computational limitations. Ray tracing is 3-D, but is restricted to relatively simple geometries. The choice between PE and RAY or BEM corresponds to a choice between accurate modelling of atmospheric refraction and accurate modelling of a complex geometry. Both options imply an approximation: either the atmosphere in the source region is approximated by a non-refracting atmosphere, or the complex geometry is approximated by a simpler geometry. Which option is best depends on the situation. The effects of atmospheric turbulence in the shadow zone (see Chapter 10) are taken into account in an approximate way, since sound levels in shadow regions are generally low and low levels have a limited effect on long-term average levels. An upper limit of 15 dB is applied to the excess attenuation. It is mentioned that more accurate values of the upper limit for specific situations may be determined by performing sound propagation calculations for a set of random realizations of the turbulent atmosphere, using appropriate values of turbulence parameters. The reduction in the coherence between the sound paths due to turbulence is taken into account in an approximate way also. Contributions from different propagation planes are summed incoherently. If necessary, it is suggested that it is possible to use partial coherent summation to account for the effect of atmospheric turbulence, if the required turbulence parameters are known. The effect of air absorption on sound propagation is calculated using the formulae in ISO 9613–1 (see Chapter 1). The HARMONOISE reference model allows for 10 categories of ground (including mineral wool since it is used as an outdoor barrier covering) and uses 4 of the acoustical ground impedance models described in Chapter 3. The engineering model calculates in one-third octave bands or octave bands for each sound source and combines these predictions into an equivalent continuous sound level (Lden) including different weightings for day, evening and night. Engineering model predictions have been tested against data. At two flat motorway sites the differences between data, collected at 4 m high microphones, and engineering model predictions
Predicting outdoor sound
406
have been found to be less than 1.5 dB at 1 km range and less than 0.6 dB at 550 m range respectively [23].
12.8 Performance of railway noise prediction schemes in high-rise cities In many cities it is not uncommon to find residential and commercial tower blocks of over 40 stories, with a height of over 100 m. Railway noise can be a particularly acute problem near such high-rise buildings. The lack of available land means that tall buildings can be located very close to railway viaducts and the resulting noise levels in the adjacent residential areas are significant. Although there are many prediction models for railway noise [24, 25], they do not offer, specifically, a method for predicting railway noise in high-rise cities nor for predicting railway noise from an elevated viaduct. Van Leeuwen [24] has identified the inherent differences between the various models. These differences include the assumption of source positions, the levels of noise emitted by pass-by trains, the characteristics of sound radiation and the correction factors adopted to account for the effect of reflection. Consequently, the predicted noise levels are different for different prediction models. Field measurements have been carried out on a residential building to assess the noise levels caused by trains passing on a nearby viaduct and the experimental results have been compared with different schemes for predicting noise from trains [26]. The schemes included the Calculation of Railway Noise (CRN) (see section 12.4.2), the Nordic Prediction Method for Train Noise (NMT) [27], MITHRA (a commercial software package developed by CSTB in France) [28] and ISO 9613–2. MITHRA has been developed to model the propagation of sound in outdoor environments and is based on a fast algorithm identifying all possible paths that link noise sources with receivers in a complex urban site. Not only are the direct, diffracted and reflected ray paths included in the predictions, but the combined effects of diffraction and reflection are included also. The software allows use of any of three methods for predicting the propagation of sound outdoors: CSTB 92, ISO 9613–2 and NMPB 95. However, only the first two methods have been used in the comparisons reported here. The CRN methodology divides the railway line into one or more segments such that the variation of noise within the track segment is less than 2 dB(A). For each segment, the reference sound exposure level A-weighted SELref in dB is calculated for each type of train on each track. On the other hand, the NMT calculations are carried out in octave bands from 63 to 4000 Hz. Based on measurements of the noise of octave band emissions for different types of trains, the sound power generated per meter of track can be determined if the speed of the train and the volume of traffic are known. The source line is then divided into elements in the direction along the track. Each element has a length of no more than 50% of the distance between the track and the reception point. The CSTB (MITHRA) software does not allow specifically for trains on an elevated railway viaduct. For the calculations based on MITHRA, the railway track is assumed to be on a reflective embankment instead of a viaduct. The measurement locations on the selected residential building close to a viaduct are shown in Figure 12.8.
Prediction schemes
407
The viaduct is flanked on both sides by residential buildings and built with dual tracks in the vicinity of a road flyover with a single traffic lane in each direction. The viaduct and the flyover are above a busy trunk road with five lanes in both directions. The measurements were made with trains running on the far side track located at a nominal distance of about 26 m from the selected residential building. Simultaneous measurements were made with eleven microphones protruding 1 m from the façade of the building. Four additional microphones were mounted on an extension pole erected on the floor of the rooftop as indicated in Figure 12.8. Some parts of the viaduct at the measurement site are shielded by nearby buildings.
Figure 12.8 Schematic of measurement locations for railway noise study. To simplify the experimental process and the subsequent numerical analysis, each measurement was started when the train came into sight and stopped when it was out of sight of the selected residential building. The nominal speed of the train as it travelled through the section was about 50 km h−1, and the duration of the measurement for each pass-by train was about 17 seconds. The noise data were recorded through a 16-channel digital data recorder and subsequently analyzed in the laboratory with the aid of postprocessing software. Since the section of the viaduct selected for this study was in the vicinity of a busy trunk road, the measurements were influenced by traffic noise, even though the measurements were made after midnight. In the measurement periods, the noise from the traffic on the road was monitored closely before and after the noise from a passing train was measured. Motor vehicles on the flyover and the trunk road below were counted during the measurement period. The vehicles were classified into two types according to the CRTN procedure (see section 12.4), that is, heavy vehicles weighing more than 2.8 tonnes and light vehicles weighing less than 2.8 tonnes. Control measurements were carried out to record the traffic noise under similar traffic conditions to those used for the
Predicting outdoor sound
408
railway noise data when there were no passing trains. The class and number of motor vehicles on each road were recorded during the ‘standard’ 17-second measurement period. By assuming that contributions from road traffic noise at the receiver points were unchanged under similar road traffic conditions, the net noise from a passing train was determined by logarithmically subtracting the traffic noise levels obtained in the control measurements from the overall noise levels when the train passed the observation station. Hence the net levels of noise from a passing train were given by
(12.33) where LAeq,m is the measured overall noise level and LAeq,t is the measured level of traffic noise in the control measurements. All noise levels were expressed in terms of Aweighted sound pressure level. As remarked earlier, the measurements took place after midnight in the early morning hours. At that time there were reduced volumes of traffic and the noise from road traffic was greatly diminished. Consequently, the measurements were taken during the periods when they were least affected by noise from road traffic. Moreover, the activity levels and hence interfering noises from occupants of the building were minimized. Three typical sets of the A-weighted railway noise levels are shown in Figure 12.9. In Figure 12.9, we also show the results of two typical control measurements of road traffic noise that were obtained for representative traffic flow conditions. The symbol M represents the measurement for train noise mixed with road traffic noise and the symbol T denotes the control noise measurement in the absence of the train noise where the volume of road traffic flows was comparable to that observed during the period of the measurement of train noise. Different sets of noise measurements were conducted in the absence of passing trains but only two typical sets, which are marked as T1 and T2, are shown in Figure 12.9.
Figure 12.9 Results of measurements of train noise mixed with road traffic noise and control measurements of road traffic noise. M1, M2 and M3 represent mixed noise measurements.
Prediction schemes
409
T1 and T2 represent two control measurements of road traffic noise. On the other hand, only three typical measurement results with a pass-by train (marked as M1, M2 and M3) are shown for comparison of the respective A-weighted equivalent noise levels, LAeq,17s. The difference between the LAeq due to a passing train and road vehicles is about 7 dB for the measurement points above the rooftop of the building (see Figure 12.8). However, the LAeq due to the passing trains and the road traffic below the track level of the viaduct are very similar. The differences vary from 0 to 2 dB because these receiver locations were exposed directly to the road traffic noise during the measurements. It was found that the influence of traffic noise is not significant for receivers located in the illuminated zone. However, the measured noise levels at the lower heights were affected adversely by the road traffic noise because the receiver was located in the shadow zone. The A-weighted equivalent noise levels due to a passing train have been obtained from the data by logarithmically subtracting the road traffic noise from the overall noise levels using (12.33). The LAeq at different receiver positions due to a passing train after the adjustment are shown in Figure 12.10. For comparison with predictions, the octave band sound power level per unit length is required for the calculation of the overall Leq. Although the NMT and MITHRA software provide typical sound power levels in octave bands for different trains, neither scheme offers an appropriate source model for the railway stock that were used in the measurements. As a result, the standard procedures proposed by the NMT method have been used to obtain the octave band sound power levels from the measured data. First, the train (source line) was divided into a number of smaller elements in the direction along the track. Each smaller element could then be treated as a line of infinitesimal point sources. The sound pressure levels generated by all point sources were replaced by an equivalent point source located at the geometric centres of the respective elements. The
Figure 12.10 A-weighted train noise levels after the logarithmic subtraction of measurements M1, M2 and M3 from the measurements T1 and T2.
Predicting outdoor sound
410
measured noise levels at a representative location were used to deduce the octave band sound power levels per unit length. The highest measurement point (27.5 m above the ground level) was chosen as the representative location for the calculation since it was (i) directly exposed to the train noise without the possible screening effect due to the parapet of the viaduct and (ii) it was relatively free from any reflecting surfaces. Air absorption was not considered due to the relatively short distance, 30 m or less, between the equivalent sources and receiver. The deduced octave band sound power levels were used as an input for the NMT, CSTB 92 and ISO 9613–2 calculation methods. ISO 9613–2, provides an algorithm to take into account of the meteorological effect on sound propagation outdoors. However, meteorological effects were considered to be unimportant in a confined urban space. The reference sound exposure level (SEL) is required as an input data for the calculation of noise levels of a passing train according to the CRN method. To ensure a comparable sound power level of the source between different prediction schemes, the SEL of the passing trains was determined from the measured data rather than by using the standard figures provided by the CRN method. Again, the highest measurement point was selected as the reference position for the determination of the reference SEL. The correction factors for the distance attenuation and the angle of view, determined according to the CRN method, were used. Only one track segment was needed. The A-weighted equivalent noise levels of a passing train deduced from measurements at different heights above the ground level are shown in Figure 12.11. The noise level value at each receiver location was obtained by taking an arithmetic average of three sets of A-weighted equivalent noise levels measured
Figure 12.11 Comparisons between the Aweighted equivalent train noise levels deduced from measurements and predictions using the CRN, NMT, CSTB 92 and ISO 9613–2 schemes.
Prediction schemes
411
at the same position but at different times. The measured noise levels increase progressively from the minimum level at the lowest point located at about 8.8 m above the ground level. Since the average speed of the passing trains is about 50 km h−1, the noise radiating from pass-by trains is mainly dominated by the noise from the wheels/rail interaction. It should be noted that the direct ray path is shielded from the parapet of the viaduct for receivers located below 15.8 m. Indeed the measured noise level increases steadily between the heights of 8.8 and 15.8 m above the ground level. The noise levels increase because the screening due to the parapet of the viaduct becomes less effective when the receiver approaches the boundary of the shadow zone. After the shadow boundary, the measured noise levels remain relatively unchanged at heights between 17.2 and 20 m above the ground level. At these heights, the measurement points were exposed directly to the source and the change in the propagation distances from the source to the measurement points was relatively small, given that the horizontal distance between the viaduct and the building was about 26 m. Between 20 and 22 m above the ground level, the measured noise level drops abruptly as the corresponding receiver points were located above the rooftop of the building. The noticeable drop in the noise level at these heights is largely due to the fact that the measurement points were above the reflecting elements of the building façade. Above a height of 22 m, the measured noise levels on the rooftop increase marginally by up to 1 dB(A) as the heights of the receiver points increase. The data obtained above the rooftop of the building suggest that the source exhibits a directivity pattern in the vertical plane. Chew [29–31] found similar results, that is an increase of noise levels up to 7 dB(A) when the polar angle of the receiver in the vertical plane increased from 8° to 30°, when he measured A-weighted equivalent noise levels due to a train running at grade on a viaduct from a building. Figure 12.11 also shows the predicted levels obtained from the various schemes. The numerical results predicted by the CRN method give the best quantitative agreement with the measurements as a function of the height above ground in an urban environment. The discrepancies between the predicted noise levels and measured data in the shadow zone are probably due to the fact that the measured data are mainly dominated by the road traffic noise. According to the CRN calculations, the noise levels over the rooftop are predicted to decrease with increased height above the ground. This differs from the measurement results because the CRN method does not take the directivity of train noise into account. The predictions by the CRN and NMT methods are in reasonable agreement with the general trend of the noise levels. However, the results predicted by the NMT method are about 2 to 3 dB higher than those predicted by the CRN method for the receiver positions that are 1 m away from the façades of buildings and there is almost no difference for receiver positions located above the roof. The predictions from the NMT and CRN methods at the highest receiver position are exactly the same as the data because this point was selected as the reference for calculating the octave band sound power levels and the SEL of the passing trains. The relatively large discrepancies between the predictions in front of the building’s façade are the consequence of two contributing factors. First, there is a difference between the assumed source heights above the railhead in the two prediction models which result in different predictions of screening effect at the same receiver position. The CRN method assumes that the source is located at the railhead while the NMT method assumes the source to be between 0.3 and 2 m above the
Predicting outdoor sound
412
railhead depending on the frequency. Second, there are differences in the assumed façade correction factors (2.5 dB in CRN but 3 dB in NMT). The predictions given by the methods of CSTB 92 and ISO 9613–2 overestimate the A-weighted equivalent noise levels by up to 8 dB for measurement points below the track level. Moreover, none of the methods are able to predict the increase in the measured noise levels in the shadow zone. Although MITHRA provides an optional algorithm for specifying the vertical directivity of a passing train, the noise source was assumed omnidirectional in the calculations to enable the comparisons with the other prediction methods. In summary, the CRN method was found to give the best agreement with the measured results. The NMT scheme was found to predict the general trend of the data, except in the shadow zone, but it overestimated the measured noise levels. The CSTB 92 and ISO 9613–2 prediction schemes were found to be comparatively less satisfactory.
References 1 HARMONOISE contract funded by the European Commission IST-2000–28419, http://www.harmonoise.org/ (2000). 2 ISO 9613–2 Acoustics—Attenuation of sound during propagation outdoors—part 2: a general method calculation (1996). 3 J.Kragh, B.Anderson and J.Jakobsen, Environmental Noise from Industrial Plants, General prediction Method, Report No. 32, Danish Acoustical Institute, Lyngby, Denmark (1982). 4 K.J.Marsh, The CONCAWE model for calculating the propagation of noise from open-air industrial plants, Appl. Acoust., 15:411–428 (1982). 5 Calculation of Road Traffic Noise, Department of Transport and Welsh Office, HMSO (1988). 6 Calculation of Railway Noise, TRL (draft circulated for public comment). 7 K.Attenborough, H.E.Bass, X.Di, R.Raspet, G.R.Becker, A.Güdesen, A.Chrestman, G.A.Daigle, A.l’Espérance, Y.Gabillet, K.E.Gilbert, Y.L.Li, M.J.White, P.Naz, J.M.Noble and H.J.A.M.van Hoof, Benchmark cases for outdoor sound propagation models, J. Acoust. Soc. Am., 97(1):173–191 (1995). 8 J.Jakobsen, Testing the joint Nordic system for prediction and measurement of enviornmental noise from industry, Proc. Internoise, 83:1–4 (1983). 9 Ashdown Environmental Limited, Task Instruction 511/106 Working Notes for Union Railways 1995 (unpublished). 10 K.Attenborough, K.M.Li and S.Taherzadeh, Propagation from a broad-band source over grassland: comparison of data and models, Proc. Internoise, 95:319–321, INCE (1995). 11 Y.W.Lam, On the modelling of the effect of ground terrain profile in environmental noise calculations, Appl. Acoust., 42:99–123 (1994). 12 ESDU Data Item No. 940355, The Correction of Measured Noise Spectra for the Effects of Ground Reflection, ESDU International plc, London (1994). 13 K.Attenborough and K.M.Li, Ground effect for A-weighted noise in the presence of turbulence and refraction, J. Acoust. Soc. Am., 102(2):1013–1022 (1997). 14 The propagation of noise from petroleum and petrochemical complexes to neighbouring communities, CONCAWE Report no. 4/81, Den Haag (1981). 15 P.Parkin and W.E.Scholes, The horizontal propagation of sound from a jet close to the ground at Radlett, J. Sound Vib., 1(1): 1–13 (1965). 16 P.Parkin and W.E.Scholes, The horizontal propagation of sound from a jet close to the ground at Hatfield, J. Sound Vib., 2(4): 353–374 (1965).
Prediction schemes
413
17 Z.Maekawa, Noise Reduction by Screens, Mem. Faculty of Eng., Kobe University 11, 29.53, 1965. 18 R.De Jong and E.Stusnik, Scale model studies of the effects of wind on acoustic barrier performance, Noise Control Eng., 6(3):101 (1976). 19 M.E.Delany, D.G.Harland, R.A.Wood and W.E.Scholes, Prediction of noise levels L10 due to road traffic, J. Sound. Vib., 48:305–325 (1976). 20 J.Kragh and B.Plovsing, Nord2000. Comprehensive Outdoor Sound Propagation Model. Part I-II. DELTA Acoustics & Vibration Report, 1849–1851/00, 2000 (revised 31 December 2001). 21 Directive of the European parliament and of the council relating to the assessment and management of noise 2002/EC/49, 25 June 2002. 22 E.Salomons, Computational Atmospheric Acoustics, Kluwer, The Netherlands (2001). 23 G.R.Watts, Harmonoise models for predicting road traffic noise, Acoust. Bull., Institute of Acoustics (UK), 30:19–25 (2005). 24 H.J.A.van Leeuwen, Railway noise prediction models: a comparison, J. Sound Vib., 231(3):975–987 (2000). 25 Victor V Krylov, Ed., Noise and Vibration from High-speed Trains, London, Thomas Telford (2001). 26 W.K.Lui, K.M.Li and P.L.Ng, A comparative study of different numerical models for predicting train noise in high-rise cities, Appl. Acoust., 67:432–449 (2006). 27 Copenhagen [Denmark]: Nordic Council of Ministers, Railroad Traffic Noise: the Nordic Prediction Method (1996). 28 01dB-Stell MVI Technologies Group, Mithra Environmental Prediction Software version 5.0: User Manual (1998). 29 C.H.Chew, Directivity of train noise in the vertical plane, Bldg. Acoust., 16:41–56 (2000). 30 C.H.Chew, Vertical directivity pattern of train noise, Appl. Acoust., 55(3):243–250 (1998). 31 C.H.Chew, Vertical directivity of train noise, Appl. Acoust., 51(2):157–168 (1997).
Chapter 13 Predicting sound in an urban environment 13.1 Introduction This chapter is devoted to methods of calculation of the acoustic field in urban areas and the acoustical effects of reflecting, shielding and absorbing treatments. Several extensions of the CRTN method described in Chapter 12 (section 12.4) will be discussed together with some theoretical and numerical techniques for predicting the effects of absorbing building façades, road surface and tunnels on road traffic noise. Sections 13.2 and 13.3 present extensions of a semi-empirical method for predicting the effects of high-rise building façades on the levels of traffic noise. Section 13.4 details a semi-empirical method for the prediction of sound propagation from a point source along a straight city street. A method for predicting sound propagation in tunnels is presented in section 13.5. Section 13.6 is concerned with modelling the shielding effect of balconies against traffic noise. Theoretical methods for 2-D and 3-D sound propagation in city street canyons are detailed in sections 13.7 and 13.8 respectively. Finally, section 13.9 details the ‘radiosity’ prediction method for road traffic noise affected by diffusely reflecting building façades and the ‘incoherent image source’ method for predicting effects of façade reflection. First we present a brief review of research related to urban noise propagation. Accurate prediction of sound propagation in realistic outdoor environments is a difficult task and has been the topic of extensive research, some of which has been described in previous chapters. A more detailed review of urban noise propagation can be found elsewhere [1, Chapter 2]. The most important factors which affect the levels of traffic noise in an urban area are: (i) the traffic intensity; (ii) shielding, diffusion and reflections by nearby building façades and (iii) ground reflections. An early prediction of traffic noise in urban situations under free flow and light traffic conditions was based on the measurements made on a 1:100 scale model [2]. The resulting computer model enabled the prediction of several noise indices for a wide range of urban and traffic conditions. In 1983, Hothersall and Simpson [3] proposed a new method with improved corrections for the estimation of the effects of reflecting façades on noise levels. The façades were supposed to lie parallel to the road and the expressions were derived by using geometrical reflection theory and the equations for distance and angle of view effects given in CRTN [4]. Two years later the method was further developed by Tang and Kuok [5], who evaluated the vertical distribution of road traffic noise levels (LA10) due to the reflections from hard road surfaces and vertical façades. The measurements were conducted in Singapore city in the presence of high-rise apartments with reflecting façades and more or less uniform appearance and layout. Seven sites along major thoroughfares with similar surroundings were chosen for other measurements [5].
Predicting sound in an urban environment
415
In 1987, Shuoxian [6] presented a computer model predicting the levels of road traffic noise in an urban built-up area, which was a development of an existing so-called negative exponential model M1 and another headway model M2 [7]. The work detailed a new computer simulation method capable of predicting noise levels from a multi-type random traffic stream on a street having unbroken parallel façades. Computed data was compared with that measured in a residential area of Beijing and good agreement was found both for free field and built-up conditions. In 1989, the work of Tang and Kuok [5] was extended by Chew [8] to predict traffic noise in an open space as well as the façade effect from buildings flanking one side of expressways. It was reported that the models were able to predict LA10 to within ±2 dB(A). The measurements were carried out in Singapore city. The following year Chew published a further study [9] reporting the façade effects of buildings flanking both sides of an expressway using the same method and the concept of the multiple-reflection diffuse-scattering model for noise propagation in streets described by Davis [10]. To estimate noise effects of trunk and access roads in urban areas, Hasebe and Kaneyasu [11] used statistical data from 83 areas in Sapporo, Japan to develop a prediction method to take account of all access roads in the city and determine the acoustic energy density at the observer point from semi-empirical equations. The traffic flow volume, which is variable of the model, was measured by counting the vehicle numbers from aerial photographs of the city. The photographs were taken during weekday mornings and afternoons. Once the input factors were selected as a result of the regression analysis, the analysis was carried out to account for a variety of the experimental conditions. The results obtained from the algorithm were compared with the measured results. Upto 60% of the predictions were within ±3 dB(A) of the measurements. Considering the crudeness of the prediction method and the measurement approach, the agreement was remarkably good. These and other studies have contributed to the development of a range of national and international standards for the prediction of noise from roads, rail and industrial sources including Nord 2000 [12], FHWA [13] and the French national computation method Nouvelle Méthode de Prevision du Bruit (NMPB) [14] and so on. Some of these national schemes are too complex to use directly and are incorporated into prediction software.
13.2 Improved corrections for the reflection of road traffic noise from a building façade According to CRTN [4], the maximum A-weighted correction for the reflection of traffic noise from the opposite building façade is 2.5 dB and reduces with the reduced angle of view. In this model, traffic noise is represented by a continuous incoherent line source. Calculations of A-weighted noise levels along side roads lined with houses require the addition of the 2.5 dB correction and this value is independent of the angle of view and the distance to the receiver. Hothersall and Simpson [3] have proposed more refined expressions for the reflection correction, which incorporate the distances (in m) between the façade and the source, DR, and between the source and receiver, D0. Using (12.10) and (12.17), in the presence of hard ground (i.e. assuming that the proportion of absorbing ground I=0) and provided that the receiver height h is such that it is 1
Predicting outdoor sound
416
(see Figure 13.1), the noise level at the receiver position is a combination of the levels due to the direct propagation and the reflection from the façade, that is LD=L10−11.25+10 log10(θs/D0) (13.1)
Figure 13.1 (a) Plan and (b) section defining the geometry in the presence of reflector on the opposite side of the road to the receiver (at O). And
where L10 is the basic noise level predicted by (12.3) or (12.4), θS is the angle of view and θR is the angle subtended at the reception point by the image of the source line produced by the reflecting façade. The total A-weighted level at the receiver position [3]
Predicting sound in an urban environment
417
is obtained by the energy addition of LD and LR. Here βR is the energy reflection coefficient of the building façade. Finally, the correction associated with the reflection effect ∆LF=LT−LD is [3]
(13.2) where RD=DR/D0 and Tθ=θR/θs. Similarly, making use of (12.12), the correction for sound propagation over absorbing ground (I=1) is given by
(13.3) As T→1 and RD→0, the façade correction predicted by either (13.2) or (13.3) provided that βR=0.8. This value has been suggested as appropriate in CRTN to account for the absorption and scattering at the façade. If the reflecting façade and the receiver are on the same side of the road, then one should use the parameter RD=DS/D0 in (13.2) and (13.3), where DS is the distance from the receiver to the reflector (see Figure 13.2). In this case, care must be taken to use a value of θR which is the angle subtended by the image source segment at the receiver. Expressions (13.2) and (13.3) can be used to determine the importance of the reflections from an individual property or from a row of houses on the predicted traffic noise level for a given source/receiver/reflector configuration. This important result is not included in CRTN [4].
13.3 Improved correction for the multiple reflections between parallel building façades In many urban situations the flow of traffic is confined between two parallel building façades which result in multiple reflections of the emitted traffic noise. The CRTN method does not account for the multiple reflections between the façades.
Predicting outdoor sound
418
Figure 13.2 Plan view of the configuration geometry when the reflector and receiver are on the same side of the road. An alternative semi-empirical method has been proposed by Tang and Kuok [5]. The model assumes that the reflections from the two parallel vertical building façades correspond to the multiple image sources (see Figure 13.3a). Using a more general form of (13.1) one can show that the A-weighted noise level at the reception point on one of the building façades due to direct propagation is LD=L10–11.25+10 log10(θs/d0), (13.4) where d0 is the slope distance between the source and receiver and θS is the angle of view. Similarly, the contribution from the first reflection (acoustic image source) can be expressed as LR1=L10−11.25+10 log10(βRθR/d1) (13.5) where d1 is the distance from the receiver to the first image source, βR is the reflection coefficient of the building façade and θR is the angle subtended at the reception point by the image of the source line produced by the reflecting façade (see Figure 13.3b). Generalizing (13.5) for N-multiple reflections, the total noise level is the combination of the all N-image sources considered in the model, that is
Predicting sound in an urban environment
419
(13.6)
Figure 13.3 Geometry of multiple reflections between two parallel building façades. and Dn=D0+nH for n=2,4,…, N. Using where (13.4) and (13.6) one finds that the correction to the base traffic noise level due to the multiple reflections between two parallel building façades, is
Predicting outdoor sound
420
(13.7)
Figure 13.4 The correction for the reflection between two parallel building façades (D0=DR=15 m, N=5). where Rd=dn/d0 and T=θR/θS. The choice of N depends on the geometry of the problem, the value of βR and the desired accuracy of prediction. In the extreme case, when a single carriageway is confined between two parallel building façades with βR≤0.8, D0=DR, h=0 and D0=DR=3.5 m (13.7) is accurate to within ±0.5 dB for N=5. The accuracy improves progressively with increasing values of D0, DR and h. The result of using (13.7) to calculate the correction for the reflections between two parallel building façades as a function of the receiver height for D0=DR= 15 m and n=5 is shown in Figure 13.4.
13.4 Traffic noise attenuation along a city street The models presented in the previous sections of this chapter are valid if the traffic flow is continuous and represented by an incoherent line source. This section considers the case when the source of noise is a single vehicle from which noise propagates along a street surrounded by high-rise parallel building façades as illustrated in Figure 13.5. In these situations it is useful to predict the sound pressure level as a function of time, or the vehicle position. Steenackers et al. [15] have proposed a simple image source model in which the total acoustic field produced by a noise source of constant acoustic power P is
Predicting sound in an urban environment
421
represented as the energy sum of contributions from all the individual image sources due to the multiple reflections from the building façades (see Figure 13.5).
Figure 13.5 Assumed geometry for predicting the attenuation of noise propagating along a city street (a) and into an adjacent street (b). Assuming that the fraction of the energy absorbed at each reflection can be the sound level at the receiver approximated by the relative decay rate position can be predicted from
(13.8) where P0=10−12 W is the reference sound power and b is the width of the street. The value of the façade reflection coefficient often includes the effects of diffusion and air absorption and can be deduced empirically from the measured reverberation curves. If the building façades are not continuous, but contain gaps of total length l, then, assuming that the gaps are fully absorbing, the equivalent reflection coefficient of façades can be predicted from [16]
(13.9)
Predicting outdoor sound
422
where L is the total length of the street. In Figure 13.6, (13.9) has been used to illustrate schematically the sound pressure level as a function of time for a fixed b
Figure 13.6 Dependence of attenuation in a street canyon on the wall reflection coefficient and the width of the canyon. and for fixed and variable b. This figure shows that for higher values and variable of the slope of the decay curve becomes less pronounced as a result of the increased strength of the reverberant component. The opposite effect can be observed if the width of the street b increases resulting in the reduced density of reflections and, therefore, reduced reverberant component.
13.5 Noise in tunnels In this section we consider the propagation of sound in tunnels with rectangular and semicircular cross-sections (see Figure 13.7). A simple method to predict the propagation of road traffic noise in tunnels and near tunnel openings is to use the model which was published by the Research Committee on Road Traffic Noise of the Acoustical Society of Japan in 1999 [17]. An application of this model is detailed by Takagi et al. [18]. The model is based on the combination of the direct, PD, and reflected, PR, sound power, PT=PD+PR, and can be used as a first-order approximation for the expression of the total acoustic field in the tunnel and near the tunnel mouth. The direct sound power radiated through the tunnel cross-section depends on the sound power of the source, PS, and the solid angle, Ω, shown in Figure 13.7, that is PD=Ps/2πΩ. The reflected sound field due to the effect of multiple reflections between the tunnel walls should depend on the dimensions of the tunnel, the distance between the vehicle and the tunnel opening and on the absorption properties of the wall. This approach can be adopted for modelling noise attenuation in both straight and curved sections of a tunnel.
Predicting sound in an urban environment
423
According to the model, the total acoustic power PT radiated at a distance from the source, d, in a tunnel of a rectangular cross-section is predicted by the following
Figure 13.7 Geometrical definitions for two types of tunnel cross-sections: (a) rectangular and (b) semi-circular. approximate expression [18]
(13.10a)
Since the intensity of sound radiated through the tunnel cross-section area Sr=2wH is I=PT/Sr, then
(13.10b)
Predicting outdoor sound
424
Here is the reference intensity at the reference distance dref, in free field conditions, H is the height of the tunnel and 2w is the width of the tunnel. The absorption parameter, αt is an empirical factor used to account for the acoustical characteristics of the tunnel walls. It vanishes when the tunnel has a perfectly reflecting boundary. Similarly, using the relation provided for the sound power radiated through the semicircular cross-section of a tunnel [18],
(13.11a)
the sound intensity, I=PT/Ss, can be predicted approximately according to the following formula
(13.11b)
where Ss=πH2/2 is the cross-section area of the tunnel. We note that there is a mistake in equation (2) in the reference [18]. The correct form of the original expression for PT is that given by (13.1 1a). The absorption parameter, at, is normally obtained by calibrating the model against experimental data. Alternatively, an empirical formula,
(13.12) can be used to determine the absorption parameter if the energy reflection coefficient of the wall, βR, is known [18]. Formulae (13.1 0b) and (13. 11b) have been used to predict the relative acoustic attenuation, 10 log10(I/Iref) assuming that dref=1 m and that the value of the wall absorption coefficient varies from 0.1 to 0.8. The predictions are presented for noise propagation in a rectangular tunnel in Figure 13.8 (a) and for propagation in a semicircular tunnel in Figure 13.8 (b). The attenuation of sound in a tunnel with rectangular cross-section and highly reflecting walls (βR=0.9) is predicted to become pronounced at distances comparable with the height of the tunnel (see Figure 13.8(a)). The results show a considerable increase in the attenuation at distances d<H (see Figure 13.8(b)). The model predicts also that the sound attenuation in a semi-circular tunnel is negligible at d<10H if the tunnel walls are poorly absorbing. Although the model is simple and easy to use, it suffers from several limitations. In particular, the model is not well suited for predicting the propagation of low-frequency
Predicting sound in an urban environment
425
sound since there will be distinct standing wave patterns which cannot be accounted for by (13.10a) and (13.10b). Another limitation is the range of propagation distances. At longer ranges, air absorption becomes significant, particularly in the higher frequency range. The omission of air absorption from formulae (13.10b) and (13.11b) means that the model tends to underpredict the attenuation for d>200−300 m. Alternative methods exist based mainly on ray or image source models (see for example [19] and [20]). These methods will be detailed in the following sections of this chapter.
Figure 13.8 Attenuation of sound (a) in a rectangular tunnel with H=14.5 m and 2w=12.5 m and (b) in a semi-circular tunnel with H=14.5 m.
Predicting outdoor sound 426 13.6 Prediction of the acoustic effect of a single building façade with balconies
Within a balcony of the building façade exposed to traffic noise, there are likely to be abrupt changes in the predicted noise levels depending on the receiver position. Noise levels inside the balcony will be sensitive to whether the receiver is in the illuminated or shadow zone of the parapet. As balcony parapets are normally close to the receivers inside the balcony, according to ray theory, even a small shift in position may result in the reception point moving into the illuminated zone from the shadow zone. The height of the receiver and orientation of the parapet in relation to the road segment are two most important factors affecting the overall noise levels. In addition, noise levels inside a balcony may be augmented by the presence of reflecting surfaces such as parapets, external building façades, balcony ceilings and floors because all these surfaces are good reflectors of sound. This phenomenon has been investigated by May [21] who suggested that the change in the level of the reverberant sound field in a balcony
can be controlled by providing additional absorption ∆a to the already existing absorption a0. May demonstrated that the reduction in the equivalent continuous sound level within a fully treated balcony can be as high as 10 dB A for low receiver levels (e.g. 0.3 m). This effect is reduced to 3 dBA if the receiver point is elevated to 2.1 m above the balcony floor [21]. Diffraction is another significant factor. The total sound field will include the sound waves diffracted at the edges of the balcony parapets. Although this factor is not considered in the standard CRTN prediction scheme [4], there have been a number of studies into the effect of a balcony on the noise levels in the vicinity of a building façade. These studies include the early work by Mohsen and Oldham [22] and the more recent work by Kropp and Berillon [23]. A simple correction method has been recently proposed by Li et al. [24]. This method can be incorporated directly into the CRTN scheme [4] and can account for the parapet shielding efficiency and the finite absorbing coefficient of the reflecting surfaces within a balcony. In this work a balcony is considered as a cantilever with a front parapet, side railings, full-height sidewall and a ceiling (see Figure 13.9(a)). It is proposed that the reflections from the ceiling, back wall and the floor of the balcony can be modelled by the image receivers lc, lb and ls of the reception point R, in accordance with the geometrical acoustic theory. Due to the close proximity of the reception point and its image receivers, the contribution from the noise reflections can be significant and cannot be ignored in the case if all surfaces in the balcony are perfectly reflective and flat. If the receiver R is located in front of the open balcony door, then one can assume that there should be no façade reflection from the back wall and, therefore, the contribution from the image receiver lb should be omitted. The shielding effect of the balcony parapet can be modelled using the CRTN standard barrier correction factor (see (12.15)) based on the difference between the direct and the diffracted path lengths. This factor should still be applied even if the receiver is in the illuminated zone or when the parapet is transparent and the shielding is mainly due to the presence of the solid balcony floor.
Predicting sound in an urban environment
427
Figure 13.9 (a) Schematic representation of the reception point (R) and image receivers (lc, lb, lf) on a balcony exposed to a source of noise (S) [24]. (b) Separation of a road into individual segments for the prediction of the
Predicting outdoor sound
428
shielding effect from the parapet, (c) Contributions to the total sound field when the receiver (R) is shielded by the balcony parapet. The effective source point and its direct noise level can be found by following CRTN methodology. In the case of a continuous line of traffic, it is suggested that the equivalent line source is split into individual segments as shown in Figure 13.9(b) so that the effects of the front and the side parapets on the balcony can be considered individually and then combined according to (12.1). According to the method [24], the overall noise level LT,i at the receiver R contributed by an i-th sub-segment can then be obtained by combining the contributions of the direct wave and all the reflected waves, that is
(13.13)
where L10,i is the basic noise level for the direct sound, and LR(i,j) is the noise level due to each of the reflections from the balcony ceiling, back wall and the full-height sidewalls assuming that all the surfaces are perfectly reflecting and flat. The basic noise level for the direct sound can be calculated as described in section 12.4.1 [4] and should include the necessary corrections, for example, traffic flow intensity, composition, distance, presence of noise barrier devices, absorbing ground, angle of view and so on. The noise contribution of a reflected ray is set to zero if it cannot be established by the proposed method. The reflected levels LR(i,j) can be assumed of the same magnitude as L10,i if the sound wave is reflected from an acoustically hard surface due to the close proximity of the reception point and its image receiver. If the surface is finished with some sound absorption material, the noise contribution from the image receiver should be corrected by LR(i,j)=L10,i+10 log10(βR,j), (13.14) where βR,i is the energy reflection coefficient of the surface element, j [24]. When a reception point is shielded from the sub-segment source line by a parapet of a balcony, the receiver is located in the shadow zone as shown in Figure 13.9(c). In this case the noise level at the receiver position R will be dominated by the ceiling reflection and by the reflection from the back wall. The noise contribution by the reflection from the floor can, therefore, be considered negligible compared with other contributions. There should also be no contribution from the back wall if the receiver R is located in front of the open balcony door. The basic noise level LR,i corresponding to the reflection from the back and side walls should be taken as the noise level with barrier correction at the receiver position R. Finally, the total noise level at the receiver position R is the logarithmic addition of the individual contributions from all the road segments, that is
Predicting sound in an urban environment
429
(13.15)
Figure 13.10 Predicted and measured variation of the insertion loss as a function of the receiver height. The receiver position is in the centre of a balcony. The insertion loss, defined as the difference in the noise levels with and without the presence of a balcony, has been used to assess the shielding efficiency of a balcony against road traffic noise [24]. The predicted and measured values of the insertion loss for the central position of a receiver in a 2.8 m wide balcony with the average depth of 2 m and surrounded by a 1 m high reflecting parapet are shown in Figure 13.10. According to this figure, the results predicted by the model agree within 0.5 dB with the measured data for the receiver heights hR>1.0 m. A 3 dB reduction in the noise level is achieved at a realistic receiver level of hR=1.5 m. This is a significant change in the noise level, which is not accounted for in the CRTN prediction scheme [4].
Predicting outdoor sound
430
13.7 Sound propagation between two parallel high-rise building façades This section is devoted to methods for calculating the acoustic field in a city street and the effect of an absorbing road surface using the Boundary Element Method. For use in these calculations, general expressions for the 2-D Green’s functions are required. 13.7.1 Green’s function for sound propagation above an impedance ground Buildings in a modern city are usually oriented so that their façades face each other. In spite of architectural features, a great percentage of a modern façade is plane or has protrusions which in size are less than or comparable to the wavelength at the frequencies of interest. A typical city street is therefore formed by two parallel sets of buildings with occasional gaps corresponding to side streets or, sometimes, to other structural complexities. In the investigation reported here, we focus on the coherent effects of multiple reflections of traffic noise that occur between the building façades and the ground. These reflections can make a very substantial contribution to the overall sound levels. To model this effect, traffic noise can be assumed to be generated by one or more cylindrical wave sources running parallel to the walls and elevated above the road surface. This transformation of the 3-D environment into two dimensions is justified as long as the length of the street is substantially greater than its width, the gaps between the neighbouring buildings on either side are seldom, the façades are parallel planes and the traffic flow is straight and continuous. Consider the simple idealized situation in which a mono-frequency line source is elevated above a flat ground (Figure 13.11). Time dependence e−iωt is assumed. The ground runs along y=0 and has the normalized surface admittance β. Let Gβ(r, r0) denote the acoustic pressure at r=(x, y) when the source is at r0=(x0, y0). We note that β=0 if the boundary is rigid, while Re β>0 if the boundary is an energy-absorbing surface. For β=0, the sound field is the combination of a direct wave and a wave reflected by the surface, that is
(13.16) where r′=(x0, −y0) is the position vector of the image of the source in the plane y=0, and is the Hankel function of the first kind of order zero.
Predicting sound in an urban environment
431
Figure 13.11 Notation definitions for sound propagation above an impedance plane. In the more general case when β≠0 the total field Gβ can be written as
Gβ(r, r0)=G0(r, r0)+Pβ(r, r0), (13.17) where Pβ(r, r0) is a perturbation term, accounting for the effect of non-zero admittance. It has been demonstrated that the perturbation term Pβ(r, r0) and the expression G0(r, r0) can be combined using the Laplace transform and the steepest descent path transformation into a single integral of the following form [25]
where ps is the contribution accounting for the residue at the pole which can be crossed in the steepest decent deformation. Explicitly, where denotes the square root with positive real part,
(13.19)
Physically, this term represents a surface wave which decays exponentially with height above the surface.
Predicting outdoor sound
432
13.7.2 Green’s function for sound propagation from a periodic array of sources In order to understand better the composition of the sound field in a canyon, we consider first the problem of sound propagation from an infinite number of equidistantly spaced sources elevated at the same height above an impedance plane (see Figure 13.12). We assume that the sources are at positions rl=(xl, y0), l=0, 1,…, where xl=x0+2bl and 2b is the distance between adjacent sources which are assigned the same unit strength. In this case, the resultant field at a receiver position r=(x, y) can be written as the superposition of the contributions from all the sources as
(13.20) Provided that the boundary is energy absorbing, that is Re β>0, and that the source and receiver remain close to the ground surface, Gβ(r, rl) decays, as the
Figure 13.12 Notation definitions for sound propagation from a periodic array of sources above an impedance plane. distance between source and receiver increases, at a rate which is faster than in free-field conditions. The first N terms can be extracted from the sum in (13.20) to be evaluated numerically as the sum of an expression involving the complementary error function of complex argument and a Laplace-type integral using the Gauss-Laguerre quadrature rule [26]. The remaining sum, from N to infinity, can be expressed as a single infinite integral by replacing Gβ by its integral representation, reversing the order of summation and integration, and finally evaluating the summation under the integral sign, which is now a geometric series. Provided N is chosen large enough so that xN>x, the resulting expression is [25]
(13.21) where ξN=k(xN−x) and
Predicting sound in an urban environment
433
(13.22) with η0=ky0, η=ky and B=kb. The term wave contributions, given by
in expression (13.21) is the sum of the surface
(13.23)
To evaluate using (13.21) it is necessary to examine the singularities of the function f(z) and their proximity to the path of integration (the positive real axis). This is important because the accuracy of numerical integration methods is seriously affected if a singularity in the integrand lies on or near the integration path. In this case, the method of subtraction of the poles nearest to the positive real axis should be adopted [25]. Substituting t=ξNν2 in the integral in (13.21), this equation becomes
(13.24)
where
(13.25) Here
(13.26) and
Predicting outdoor sound
434
(13.27)
Integral (13.25) can be approximated by Gaussian quadrature with the weight function t−1/2e−t, that is by the generalized Gauss-Laguerre quadrature [27]. This approximation will be accurate, using a rule with a small number of points, provided the function f(t/xiN) does not have singularities close to the positive real axis. In the complex plane the function f(z) can have several poles which may lie close to the integration path. It is and straightforward to demonstrate that the important poles are zb=iarg q/2B, where q=e2iB. It has been suggested that the effect of the pole za can be ignored if or Im [25], in which case za lies at least distance 0.75 from the positive real axis. Otherwise it should be subtracted, that is
(13.28) where
(13.29) and
(13.30) with F(za)=β2[cos(η0β) cos(ηβ)−sin(η0β) sin(ηβ)−i sin (η+β)]. (13.31) The second integral in expression (13.28) can be evaluated exactly [28] so that for arbitrary complex z≠0,
Predicting sound in an urban environment
435
(13.32) In this equation, the complementary error function of complex argument is defined by and Ψ(z)=1 if z>0 (i.e. if Im β<0 and Re ), otherwise Ψ(z)=0. We note that if z is not on the positive real axis, then the square roots in (13.30) are to be taken with positive imaginary part. The pole zb should be subtracted if 0<arg q≤π/4, that is when 0<|Im zb|≤ π/(8B) [25]. The above technique for removing the pole can be adopted for the pole at z=zb. In this case
(13.33a) If only the pole at z=zb is to be subtracted, the resulting expression for integral (13.32) is similar to expression (13.28), but with ga(t/ξN) replaced by gb(t/ξN), where the function gb is defined by
(13.33b) In the case that both the poles at za and zb are to be subtracted, then ga(t/ξN) is replaced by gab(t/ξN), where
(13.33c) The pole subtraction technique ensures that in each case the integrand g(t/ξN) in (13.28) is bounded and analytic, as a function of t, in a neighbourhood of the positive real axis, namely the strip Im t>−3ξN/4, |Re t|≤min(3/4, π/(8B))ξN. Thus it can be ensured that in each case singularities of the integrand do not lie closer than distance 3/4 from the positive real axis by choosing N so that ξN≥max(1, 6B/π). In other words, since ξN=ξ0−ξ+2BN, where ξ0=kx0 and ξ=kx, N is to be chosen in the range
(13.34) In summary, there are four cases to consider, each with an integral representation to be used for numerical evaluation. These are as follows:
Predicting outdoor sound
436
I. Neither of the poles is close to the positive real axis (or zb=0 and za is not close to the positive real axis):
(13.35) II. The pole za is close to the positive real axis and either zb=0 or zb is not close to the real axis:
(13.36) III. Only the pole zb is close to the real axis (but zb≠0):
(13.37) IV. Both the poles za and zb are close to the positive real axis (but zb≠0 and za≠zb):
An important special case not covered here is that of a rigid boundary, that is β=0. In this case, series (13.20) is divergent if B is a multiple of π, in other words if q=1. If q≠1 then it can be shown [25], that the summation (13.21) is conditionally convergent and has the value given by (13.21), where
Integrals (13.35)–(13.38) can be evaluated using a numerical integration method, for example
Predicting sound in an urban environment
437
(13.39)
where xj,n denote the abscissae and wj,n the weights of the n-point Gauss-Laguerre quadrature rule for the weight function t−1/2e−t [27]. The error in the numerical integration results from the neglect of the last n−m weights and abscissae. To ensure good accuracy in the numerical integration, the integrand f(t/ξN)t−1/2e−t should be small for t>xm,n. It has been shown [25] that for the 40-point Gauss-Laguerre quadrature (n=40, m=22, xm,n=30.26) the error in the integration should be bounded by |f(t/ξN)t−1/2e−t|≤10−9, for t≥xm,n, provided that
This leads to the following criterion
(13.40) 13.7.3 Green’s function for 2-D sound propagation in a canyon Consider now the sound field generated by a point source of sound at TO in the canyon formed by two parallel vertical rigid walls embedded in an impedance ground surface, for example the case when a noise source is confined between two high-rise, parallel, reflecting building façades. Clearly the problem can be solved by computing the positions of the infinite array of image sources formed by reflection in the rigid walls as detailed in the previous section. These images form two doubly infinite periodic arrays of additional for l=0, ±1, ±2,…, where is the sources at rl, l=±1, ±2,…, and at image of rl in the wall at x=0 (see Figure 13.13). The representation for sound propagation from a single periodic array of sources can now be expanded to obtain the solution for noise propagation in a canyon,
Figure 13.13 Image sources for sound propagation in a canyon street above an impedance ground.
Predicting outdoor sound
438
which can be written in the following form [25]:
(13.41) where
(13.42) is the periodic Green’s function for an array of sources extending to infinity in both for l=0,1,…, is the reflection of rl in the vertical line directions. Here through r. Figure 13.14 presents a comparison of the relative levels predicted for a 15 m wide city street canyon with and without absorbing road surface using (13.41). The levels are predicted for r0=(9.0 m, 0.5 m) and r=(2.0 m, 1.5 m). The normalized acoustic admittance, β, was determined from the measured data for a 120 mm layer of 6 mm gravel. The values of the admittance for this material can be closely predicted by a semi-empirical model [29] using the following values of the nonacoustic parameters: characteristic particle size, D=6 mm, tortuosity, q=1.35, porosity, Ω=0.39 and grain density, ρg=2400 kg/m3. One obvious effect of the porous road surface is a significant reduction in the level of the interference maxima in the acoustic spectrum. This example demonstrates that for a particular frequency range, between 100 and 500 Hz, selected source/receiver geometry and the width of the canyon, the broadband reduction in the noise level due to the presence of 120 mm layer of gravel is 4 dB. According to the method, at certain frequencies, for example 606 Hz, 686 Hz and 766 Hz, the reduction in the noise level due to the presence of the porous ground can be significantly greater than 10 dB (see Figure 13.14). In practice, the finite values of air and façade absorption and diffuse reflections from elements of the building façades will limit this gain to below 10 dB [1]. The first effect can be included in the proposed model by adding a finite imaginary part to the real wavenumber k. The second effect can be also included if the periodic Green’s function in (13.20) is replaced with
Predicting sound in an urban environment
439
Figure 13.14 An example of the predicted effect of porous ground on the level of noise between two parallel, perfectly reflecting building façades.
where α is a complex, frequency-dependent term which accounts for the absorption and the phase shift in the acoustic wave reflected by the façade [25]. Modelling of the diffuse reflection cannot be incorporated simply in a theoretical model and is considered in the last section of this chapter. The proposed formulation is valid and efficient throughout the entire frequency range. At the low frequencies of sound, for example below 500 Hz, the efficiency of this method is comparable with that expected from the more conventional method of normal mode decomposition (e.g. [30]). However, as the frequency increases, the efficiency of the proposed formulation improves rapidly and becomes significantly superior to normal mode decomposition [25]. This level of efficiency is essential if the formulation has to be incorporated into the boundary integral method and used to predict the acoustic efficiency urban noise barriers and architectural features on building façades.
Predicting outdoor sound
440
13.7.4 Application of the Boundary Element Method The Boundary Element Method is often adopted to predict sound propagation above a flat impedance layer in the presence of arbitrarily shaped obstacles or complex landscape. In general, there are no theoretical limitations to application of this numerical method to the problem of noise propagation in a city street canyon. The Boundary Element Method can account explicitly for the scattering and absorption effects associated with urban complexities such as noise barriers, absorbing façades, elevated roads, balconies, vehicles and other objects which can be present in the street (see Figure 13.15). In principle, the method is not limited by the extent of the acoustic region of interest. However, restrictions are imposed by the size of the available computer memory and execution times can be unacceptably slow if discretization of larger boundaries at shorter wavelengths is required. The number of boundary elements required can be reduced drastically if the periodic Green’s function ((13.41) and (13.24)) is used in the boundary integral equation formulation. This function incorporates analytically many of the physical boundary conditions and accounts inherently for the multiple reflections between the parallel building façades. Let γ be the surface of the complexities in a street canyon D which excludes the porous ground E of uniform admittance β (see Figure 13.15). The absorbing surface of any of these complexities is characterized by the normalized surface admittance βs=(1/ikp)(∂p/∂n), (n(rs) is the normal to γ). The boundary value problem can then be written as the following boundary integral equation
Figure 13.15 Sound absorption and scattering in a city street.
Predicting sound in an urban environment
441
(13.43) where the Green’s function is given by (13.41) and predicts the acoustic field in the absence of any complexities, that is smooth rigid walls and the impedance ground with uniform admittance β as shown in Figure 13.13. The factor ε(rs) in equation (13.43) is defined by
(13.44)
where Ω(r) is the angle in the region D at r(Ω(r)=π if ∂D is smooth at r). To apply the boundary integral equation method, the integral in (13.43) needs to be discretized [31]. Let pν denote the approximation to p. We assume that the boundary γ is polygonal and split γ into M straight line elements γ1,…, γi,…, γν where ν=1,…, M. Equation (13.43) can be approximated by
(13.45) where for a given straight line element γi and the point
(13.46) and
(13.47) The approximations bcan and ccan are accurate provided that γi is sufficiently small in comparison with the wavelength. Let us set r=ru, u=1,…, M in (13.45). We obtain the following set of M simultaneous equations for the values pu(ru)
Predicting outdoor sound
442
(13.48)
with avu=ε(rν)δνu−bcan(rν, γu)+ikβs(ru)ccan(rν, γu), (13.49) where δνu is the Kronecker symbol. Note that where rν=(xν, yν) from (13.44), and since Ω(rν)=π,
(13.50) Also note that because of (13.50), it is necessary that elements on y=0 have yu=0 exactly, elements on x=0 have xu=0 exactly and on x=b have xu=b exactly. The next step is to determine expressions for ccan(r, γi) and bcan(r, γi). The manipulations which need to be carried out here are analogous to those suggested in [31]. Note that since is a combination of the G0 and Pβ, the corresponding approximation should be derived in the form of (13.51) and
(13.52) Here nx(ru) and ny(ru) are the x– and y–projections of the normal to the element γu at ru and hu is the length of γu. The evaluation of integrals of and its normal derivatives can only be problematic if r is close to rs, for example when evaluating first few terms in the integral sum (see (13.21)). If r is close to the integration path γi, the free field component G0(r, rs) of Gβ(r, rs) (13.16) varies rapidly as rs ranges over γi. The same arguments are applicable to the integration of the contribution from the image source in the case when is close to γi which is the image of the boundary γi below y=0. Therefore, it is necessary to consider the case when rs is close to γi. r may also be close to γ(L)i, the first image of γi in x=0, or close to γ(R)i, the first image of γi in x=b, or close to either or the images of γ(L)i or γ(R)i in y=0. So let, for denote the
Predicting sound in an urban environment
443
image of r in x=0 and r(R) its image in x=b. Then we can write, for two arbitrary points
(13.53) where G(r, r0) can be written explicitly as
(13.54)
In this equation i is a unit vector in the x-direction, the points r0+2lbi, l= 1, 2, 3,…, and being the collection of images of r0 in the lines x=0 and x=b. Note that by separating out the nearest images and from (13.53) we have ensured that none of the images included in the summation are closer than a distance b to In actual r. This guarantees that G(r, r0) is a very smooth function for computations we will select (13.24), (13.41) and (13.43) in which the remainder of the infinite integral sum represents the function G(r, r0) while N number of terms are treated explicitly using the method developed by Chandler-Wilde [31] (see also notes on the choice of parameter N in the previous section).
13.8 Modelling of 3-D sound propagation between two high-rise building façades In certain situations, it is of interest to determine the attenuation of noise emitted by a stationary point source of noise or by a point source (e.g. a vehicle) travelling along a city street canyon. In this case a 3-D sound propagation model is required. A semi-empirical correction for 3-D sound propagation has already been detailed in section 13.4 based on the incoherent method of combining the contributions due to the reflections from the parallel building façades. This empirical correction ignores the interference effects at certain frequencies of sound emitted in a narrow street and can become inadequate in certain cases. These effects can be a dominant contribution to the overall sound field and should not be discarded if accurate predictions of the sound pressure level are required. A practical theoretical model which can account for the interference effect has been recently proposed by Iu and Li [32]. It is an image source theory that takes into account the multiple reflections between the absorbing building façades and includes the ground effect in the calculations. In this way, the sound fields due to the point source and its images are summed coherently such that mutual interference effects between contributing rays are included in the analysis.
Predicting outdoor sound
444
13.8.1 Theoretical formulation based on the Van der Pol approximation Following the methodology proposed by Iu and Li [32] we represent a city street in 3-D system of coordinates as two infinitely long vertical planes separated by an absorbing ground (see Figure 13.16). We assume that the left and right walls are parallel and characterized by the normalized admittance, βL and βR respectively. An impedance ground of normalized admittance βB, which is located between the vertical walls, is situated at the plane z=0 and extends infinitely in the y-direction. The impedance ground is assumed to be perpendicular to the vertical walls and a point source is placed at (x0, 0, z0). As the sound field is symmetrical about the y=0 plane, we restrict our interest to the region where and The 3-D sound field, p(x, y, z), can be computed by solving the Helmholtz equation
(13.55) The governing equation is supplemented further by the boundary conditions at the parallel walls and the impedance ground:
(13.56a)
(13.56b)
and
(13.56c)
Predicting sound in an urban environment
445
Figure 13.16 Theoretical modelling of 3-D sound propagation in a city street canyon. In the absence of the impedance ground, the solution can be expressed as a Fourier integral
(13.57) taken over the space of all wavenumbers, k≡(kx, ky, kz). The variable Gx in (13.57) may be regarded as the required Green’s function in the wavenumber space given by
(13.58)
VL and VR are the pressure reflection coefficients for the waves reflected by the left and right vertical walls respectively. They can be determined according to
(13.59a) and
(13.59b)
Predicting outdoor sound
446
Replacing the denominator by its binomial series, expanding the square brackets and grouping all terms accordingly in (13.58), we obtain
First, let us consider the case when the order of reflection in (13.60), l=0. The first term in the square bracket represents the direct wave. The second term in the square bracket is a result of the reflection from the left vertical wall. The last two terms are a pair of image sources, which are obtained by mirror reflection of the first two in the right vertical wall. The process can be repeated again and again (in which l ranges from 1 to ∞ in the series), leading to a row of an infinite number of image sources located at the height of z0 above the impedance ground. In the event that the waves are reflected by the impedance ground, we can apply the boundary condition (13.56c) and use (13.57) to yield
(13.61)
where VB is the reflection factor of the waves from the ground, which can be expressed as
(13.62) The outer integral with respect to kz can be evaluated by the method of contour integration to give
(13.63) where
Predicting sound in an urban environment
447
and
Integral (13.63) can be used for the modelling of sound propagation in a street canyon. However, the exact evaluation of the integral can be difficult. In a particular case, when all reflecting surfaces are acoustically hard, that is βB=βL = βR=0, the reflection substitution of (13.61) into (13.63) leads to coefficients are
(13.65)
The total sound field is composed of contributions from two rows of noise sources located at heights z0 and −z0 respectively. Each of these integrals in (13.65) can be identified as a Sommerfeld integral with each source located at a different position. These integrals can be evaluated exactly [33], and the total sound field can be expressed as the sum of a series as follows:
(13.66) where the first four terms of the square bracket in the above series are the contributions due to the reflections from the vertical walls only. The path lengths, dl1, dl2, dl3 and dl4 can be determined by simple geometrical considerations:
(13.67)
Predicting outdoor sound
448
The total sound field is also augmented by a set of image sources due to the presence of a reflecting ground. These are represented by the last four terms of the square bracket in and that can also be determined (13.66). The corresponding path lengths are straightforwardly. The above theoretical formulation provides the basis for subsequent analysis proposed by Iu and Li [32]. First, we consider a special case when only left façade is present, that is VR=0. In fact, this problem can be treated as a special case of two parallel walls where the width of the street becomes very large, b→∞. It is then straightforward to show that We can simplify Gx from (13.58) to
Substituting it into (13.63a) leads to the formula derived by Tang and Li [34]
(13.68) where Q(d, θ, β) is the spherical wave reflection coefficient that can be determined for a given separation of the image source and receiver d, the angle of incidence of the reflected wave θ and the normalized admittance of the boundary β. It is determined (see (2.40)) according to
Q(d, θ, β)=Rp+(1− Rp)F(w), (13.69) where
(13.70)
(13.71) and
Predicting sound in an urban environment
449
(13.72) The angle of incidence of the reflected waves, source and receiver location as
and
can be found for a given
(13.73) In the case, when both façades are present, (13.63a) can be presented in the following form
(13.74)
where and are the angles of incidence of the reflected waves measured from the normal of the reflecting plane. 13.8.2 Theoretical formulation based on the Thomasson approximation An alternative formulation has been proposed by Horoshenkov [1] and is based on the Thomasson’s model [35] for sound propagation above an impedance ground. In the simplest situation, when a spherical sound wave is emitted from a point source situated
Predicting outdoor sound
450
above a rigid surface at a point (x0, y0, z0) the Green’s function for the total 3-D sound field at the receiver point (x, y, z) is given by
(13.75) and are paths for the direct where wave and the ground reflection respectively. If the ground is not rigid but its surface normalized admittance is described by a certain value β, it is convenient to represent the total sound field using the above expression with an additional term gβ=g0+pβ (13.76) where pβ is the perturbation term due to the finite value of the admittance
(13.77)
is the horizontal separation between the source and the receiver. Several mathematical treatments of integral (13.77) are discussed in greater detail in [31] where it is shown that some can fail for small angles of incidence, θ0, and in the vicinity of the source, that is when kRs cos θ0=O(1). For example, the previous formulation by Iu and Li uses the Van der Pol approximation which is restricted mainly to θ0≈π/2. The proposed Thomasson asymptotic expansion does not suffer from this restriction, is uniformly valid for large range of θ0 and kR [35] and, therefore, can be selected as an alternative to the method proposed by Iu and Li [32]. In his approximation, Thomasson introduced a recursive scheme for the expansion of the integral representation for the perturbation term [35]
(13.78)
where in (13.78) is defined as
γ0=cos θ0. The integral
Predicting sound in an urban environment
451
(13.79) For m=0 (13.79) is a known integral [28]
which is used in the Van der Pol approximation. The higher-order integrals Im can be obtained in terms of I0 by a recurrence relation I1=A+(0.5−A2)I0, Im=(m−0.5−A2)Im−1+(m−1)A2Im−2, m≥2. Note that in (13.78) the last term relates to the surface wave and is given by
It has been suggested [31] that the representation (13.78) is an accurate approximation for n≥2. Thus, we will use the second-order Thomasson approximation which is written as the following:
where the last term in the right-hand side of this expression is the error of the approximation which is limited to [31] E(kR)<652k(kRs)−3. For the range of audio frequencies (0.1–10 kHz), the error at Rs>20 m will be of order 10−6 which should be regarded as more than appropriate for comparison with the experimental data. Equation (13.80) in the Thomasson approximation can be used in the case when the source of sound is located between two parallel semi-infinite rigid walls erected on the ground with a normalized surface admittance β and separated by the distance b (see Figure 13.16). The total sound field at the receiver point (x, y, z) can be found as a
Predicting outdoor sound
452
superposition of the direct wave and its multiple reflections represented by an infinite number of image sources. Normally, only N image sources are critical for the total sound field in the canyon while the rest can be neglected so that
(13.81)
In this expression, the horizontal separation between the image source ml and the receiver at the point M(x, y, z) is given by
It is possible to allow for the extended reaction of the surface the impedance ze of a hardbacked porous layer of thickness d can be calculated according to well-known expression ze(ω, θ)=zb(ω)/cos(θb(ω, θml)) coth(−ikb(ω)d cos(θb(ω, θml))),
(13.82)
where the angle of refraction is θb(ω, θml)=sin−1(k sin(θ0)/kb(ω)) (13.83)
Predicting sound in an urban environment
453
and the angle of incidence θlm can be determined from for every individual image source considered in (13.81). In (13.82), zb(ω) and kb(ω) are the complex characteristic impedance and wavenumber in the porous ground respectively. Therefore, the normalized surface admittance β used in the expression for the can be replaced with βe=1/ze. perturbation term In many practical calculations it is sufficient to consider the contributions of the first few sets of image sources in (13.81). It is often suggested to restrict N<10. The limit can also be obtained from the consideration of the average correlation interval determined for the random noise emitted by a typical vehicle and the degree of accuracy in the computations of the sound pressure level (e.g. ≈1 dB). In this case the error term in (13.81) will decay as E((2bN)−2) since we anticipate here that the maximum correlation interval predicted for the lowest frequency in the noise spectrum does not exceed several wavelengths so that the contributions from higher-order reflections are not coherent with the direct wave. Another important limitation is the air absorption which becomes substantial at the higher end of frequency spectrum at greater distances from the source. The absorption, if included in the wavenumber in air k, would suppress the effect of high-order reflections and make only the first few terms in (13.81) contribute significantly to the total sound field in the canyon. Practically, the absorption is introduced in terms of the imaginary part of the complex wavenumber and can be predicted using the ISO 9613–1 standard prediction method [36]. Three-dimensional predictions for the spectrum of the total sound field in a 17 m canyon with and without absorbing road treatment were carried out using (13.81). The results were validated against the experimental data obtained from the physical scale mode experiments reported in [1]. A hard-backed 8 mm layer of Coustone was used to simulate the porous road surface at the scale of 1:20. The four-parameter impedance model [37] was used to predict the normalized surface admittance of the 8 mm layer of Coustone (using (13.82)) with the following values of non-acoustic parameters: flow resistivity, R=41,500 Pa s m−2, tortuosity, q=1.52, porosity, Ω=0.5 and pore shape factor, sp=0.4. The results of the validation are shown in Figure 13.17 which presents the measured and predicted 1/3-octave sound pressure levels adjusted for the standard traffic noise spectrum and realistic noise source strength [1, section 5.2.4]. Apart from the first interference minimum around 250 Hz, the agreement between the measured and predicted 1/3-octave band levels is within 2.5 dB. The discrepancy between the measured and predicted broadband levels does not exceed 0.05 dB.
13.9 Sound propagation in city streets 13.9.1 The radiosity method for diffusely reflecting boundaries So far we have focused our attention mainly on sound propagation in the vicinity of geometrically reflective building façades and road surfaces. Although this assumption
Predicting outdoor sound
454
Figure 13.17 Comparison of the predicted and measured excess attenuation in a 3-D city street canyon. enables the fundamental understanding of the multiple-reflection phenomenon between parallel building façades and from the absorbing ground, it is unrealistic to expect that all surfaces are geometrically reflective. Most realistic surfaces tend to disperse incident sound in all directions according to the Lambert cosine law. This type of scattering can be accounted either crudely by use of an empirical model, for example the CRTN method [4] or exactly via a computationally intensive numerical prediction model, for example the boundary element method (see section 13.7.4). An alternative and efficient prediction technique for 3-D sound propagation in the vicinity of realistic boundaries in an urban environment has been developed by Kang [38] and based on the radiosity method which is well known in optics [39]. The technique accounts for a combination of the absorption and diffusion properties which can be assigned to individual boundary elements into which a building façade or road segment can be divided. Unlike the Boundary Element Method, the developed technique is energy-based and allows the boundary discretization into much larger elements (patches) so that its efficiency is greatly superior in terms of memory storage and CPU time. Unlike many empirical methods (e.g. [4]) the technique assumes an impulsive source of sound and accounts for the time factor and, therefore, is capable of predicting the important parameters of classical architectural acoustics, that is the reverberation time, early decay time and clarity index.
Predicting sound in an urban environment
455
Figure 13.18 3-D representation of a city street canyon and method of discretization into elements with individual absorption and diffusion properties. The first step of the model is to divide any boundary in the vicinity of the source into a number of elements as illustrated in Figure 13.18 for a typical canyon street situation. We assume that the street is of finite length Lx, width Ly and height Lz. Along its length, width and depth the street boundaries are divided into NX, NY and NZ elements respectively. The number of elements is arbitrary and the accuracy can be expected to increase with finer element discretization. However, the computation time tends also to The area of individual elements can be varied and it has increase proportionately to been suggested to decrease the area of elements which are closer to an edge. The work by Kang suggests several methods of boundary discretization in the case of a relatively large and a relatively small boundary (see section I.A in [38]). The second step is to assign a proportionate amount of acoustic energy from the source to the boundary elements. The basic principle of the source energy distribution is that the energy fraction at each patch is the same as the ratio of the solid angle subtended by the patch at the source to the total solid angle. In this way, for a point source at (x0, y0, z0) the proportion of the acoustic energy transferred directly to the boundary element (l, m) is (13.84)
Predicting outdoor sound
456
where K is the radiated sound power of the source which can include angular is the angular-independent absorption coefficient of the element (e.g. dependence, random incidence absorption coefficient), M is the energy air absorption in Np m−1 (see [36]), φ is the angle of incidence and is the azimuth width of the element (see Figure 13.19). It is assumed that the impulse from the source is generated at the time t=0 so that the acoustic energy arrives at the (l, m)-th element at t=Sl,m/c, where c is the speed of sound in air. If the element belongs to a horizontal plane boundary, then the distance between the source and the element is where dl, dm and dz are the x-, y- and z-coordinates of the centre of the element, respectively. Obviously, if the boundary is vertical, then where dx is the x-coordinate of the plane boundary. If the boundary is horizontal, then the angles are determined from the following relations: φl,m, ∆φl,m and
(13.85)
Figure 13.19 Distribution of acoustic energy from a point source to the (l, m)-th element on the boundary.
(13.86)
Predicting sound in an urban environment
457
(13.87) where hl and hm are the lateral dimensions of the element. In (13.86) and (13.87) the factors kφ and take the following values
qnd
If the boundary is vertical, then the term (dz−z0) in (13.85) to (13.87) should be replaced by (dx−x0). The third step in the technique is to assign form factors which account for the proportion of the acoustic energy diffused from the element (l′, m′) onto the receiving element (l, m). In a typical city street, the orientation of two boundary elements can be either parallel or orthogonal. The procedure for the calculation of the form factors for such a pair of elements is well know in studies related to lighting and computer graphics. Here we present only the final expressions for the form factors for the parallel and orthogonal orientations of a pair of elements. For a pair of boundary elements located on two parallel building façades, Kang [38] has suggested the use of Cohen and Greenberg’s method [40] according to which the form factor, that is the proportion of the acoustic energy passed from the element (l′, n′) to the element (l, n), is given by
(13.88)
is the distance between the centres of these where elements and hl and hn are the lateral dimensions of the element (l, n). If the orientation of two boundary elements is orthogonal, for example one (l′, n′) element is located on a vertical façade and the other element (l, m) is on the horizontal road surface, then the form factor is given by [38]
Predicting outdoor sound
458
(13.89)
where is me angle of direction from the centre of the element (l′, n′) to the edge and are the angular widths, that is of the element (l, m) and
(13.90)
(13.91)
(13.92)
and the factor
The fourth step is to determine the total energy transmitted to the (l, m) element from all the other boundary elements at the k-th reflection. This process is accomplished by summing up the contributions from all possible energy exchanges between this element and the other parallel and orthogonal boundary elements, that is the energy of the k-order element source on the ground is predicted from
(13.93)
Predicting sound in an urban environment
459
where and are the sound energies on patch after (k−1) energy exchanges, respectively. sources Ak−1 and Bk−1 at the time The energies of the k-order element sources on the left and on the right façades are predicted analogously. The fifth step is to determine the total acoustic energy radiated from the boundary elements to the receiver located at R=(x, y, z). The total acoustic energy at the receiver position is the combination of the energy contributions from the ground, EG,k(t), from the left façade, EL,k(t) and from the right façade, ER,k(t). As an example, the acoustic energy contribution from the ground elements is predicted from
(13.94)
where
is the angle between the normal to the (l, m) boundary element and the direction to the receiver and is the distance between the centre of the (l, m) boundary element and the receiver. It is straightforward to derive similar expressions for the energy contributions provided by the left and right building façades. Finally, the time-dependent sound pressure level at the receiver position is given by
(13.95)
where Lref is the reference level, N is the maximum order of reflections and Ed(t)=1/(4πR2)e−MR is the energy directly received from the source. In the latter expression is the distance between the source and the receiver. Expression (13.94) is the transfer function of the city street canyon which can be used to determine the average sound pressure level for a given source power, K, that is
(13.96)
where U=T/∆t and T is width of the time window and ∆t is the time step.
Predicting outdoor sound
460
13.9.2 The image source method for geometrically reflecting boundaries If the surfaces are geometrically reflecting, that is when specular reflection of the incident sound wave is assumed, then the time-dependent level in the street can be predicted using the image source method. Two coherent image source models have already been detailed in section 13.8. It is often argued that in practical outdoor environments incoherent image source models are able to provide a more realistic prediction of the noise field between two parallel building façades. Iu and Li [32] and Kang [38] considered an incoherent approach to treat the multiple reflections between two parallel, geometrically reflecting building façades with finite values of the absorption coefficient. According to their method the total sound field in a city street canyon can be estimated heuristically by combining the contributions from the four sets of periodically distributed image sources, that is
where
(13.97) here
Predicting sound in an urban environment
461
(13.98)
are the path lengths and and relate to the corresponding ground reflections. Finally, the reverberation time and the total sound pressure levels in the canyon with geometrically reflecting façades can be determined from
(13.99)
respectively. The difference in the steady state sound pressure level between that predicted by (13.99) and that predicted in the presence of diffusely reflecting boundaries is given by
where the second term on the RHS is calculated from (13.96). Some results obtained by Kang [38] are presented in Figure 13.20. The calculation was carried out for sound propagation in a 20 m wide city street canyon and two different heights of the building façades, Lz=6 m and Lz=18 m, were considered. The source was assumed at (0 m, 6 m, 1 m) and two sets of receivers were distributed equidistantly along the horizontal line running at (y=2 m, z=1 m) and (y=2 m, z=18 m). The results show that the SPL difference increases with the increased source/receiver separation. This behaviour is consistent with the changed receiver elevation, transverse position in the street and
Predicting outdoor sound
462
Figure 13.20 The difference in the sound pressure level caused by the presence of diffusely reflecting façades in a 20 m wide city street canyon with 6 m (thick lines) and 18 m high building façades (thin lines). The solid lines correspond to the receiver line running at (y=2 m, z=1 m) and the dotted lines at (y=2 m, z=18 m) [38]. height of the building façades. Clearly, a model for geometrically reflective façades can seriously underestimate the total sound pressure level at greater source/receiver separations because it neglects the diffuse-scattering phenomenon. If the surfaces of the building façades are irregular, then diffuse scattering can add a significant contribution to the geometrically reflected sound field component and should not be neglected.
References 1 K.V.Horoshenkov, Control of noise in city streets, PhD Thesis, University of Bradford, Bradford, December (1996). 2 L.J.M Jacobs, L.Nijs and J.J.van Willigenburg, A computer model to predict traffic noise in urban situations under free flow and traffic light conditions, J. Sound Vib., 72:523–537 (1980). 3 D.C.Hothersall and S.Simpson, The reflection of road traffic noise, J. Sound Vib., 90(3):399–405 (1983). 4 The Calculation of Road Traffic Noise, Department of Environment 1985 (HMSO). 5 S.N.Tang and M.H.Kuok, Vertical distribution of L10 traffic noise levels along roads flanked by high-rise structures, J. Sound Vib., 100(1):146–148 (1985). 6 W.Shuoxian, Computer simulation of road traffic noise in urban built-up area, Appl. Acoust., 22:71–78 (1987). 7 R.J.Cowan, Useful headway models, Transport Res., 9:371–375 (1975). 8 C.H.Chew, Prediction of traffic noise from expressways—Part I: building flanking one side of expressway, Appl. Acoust., 28:203–212 (1989).
Predicting sound in an urban environment
463
9 C.H.Chew, Prediction of traffic noise from expressways—Part II: buildings flanking both sides of expressway, Appl. Acoust., 32:61–72 (1991). 10 H.G.Davis, Multiple-reflection diffuse-scattering model for noise propagation in streets, J. Acoust. Soc. Am., 64:517–521 (1978). 11 M.Hasebe and K.Kaneyasu, Prediction of traffic noise from trunk roads and access roads in urban areas, Noise Control Eng. J., 37:71–76 (1991). 12 H.G.Jonasson and S.A.Storeheier, Nord 2000. New Nordic Prediction Method for Road Traffic Noise, SP Swedish National Testing and Research Institute (2001). 13 Federal Highway Administration (FHWA) FHWA Traffic Noise Model Version 1.0: Technical Manual, FHWA-PD-96–010, DOT-VNTSC-FHWA-98–2 (1998). 14 NMPB-Routes 96, Methode de calcul incluant les effets meteorologiques, version experimentale, Bruit des intrastructures routieres (January 1997). 15 P.Steenackers, H.Myncke and A.Cops, Reverberation in town streets, Acustica, 40:115–119 (1978). 16 S.wu and E.Kittinger, On the relevance of sound scattering to the prediction of traffic noise in urban streets, Acustica, 81:36–42 (1995). 17 Research Committee of Road Traffic Noise in Acoustical Society of Japan, ASJ Prediction Model 1998 for Road Traffic Noise, J. Acoust. Soc. Jpn., 55(4):281–324 (1999). 18 K.Takagi, T.Miyake, K.Yamamoto and H.Tachibana, Prediction of road traffic noise around tunnel mouth, Proc. 29th Int. Cong. Noise Control Eng., 1−5, Nice, France, (27–30 August 2000). 19 T.L.Redmore, A theoretical analysis and experimental study of the behaviour of sound in corridors, Appl. Acoust., 15:161–170 (1982). 20 K.M.Li and K.K.Iu, Propagation of sound in long enclosures, J. Acoust. Soc. Am., 116(5):2759–2770 (2004). 21 D.N.May, Freeway noise and high rise balconies, J. Acoust. Soc. Am., 65:699–704 (1979). 22 E.A.Mohsen and D.J.Oldham, Traffic noise reduction due to screening effect of balconies on a building façade, Appl. Acoust., 10:243–257 (1977). 23 W.Kropp and J.Berillon, A theoretical model to investigate the acoustic performance of building façades in low and middle frequency range, Acustica, 84:681–688 (1998). 24 K.M.Li, W.K.Lui, K.K.Lau and K.S.Chan, A simple formula for evaluating the acoustic effect of balconies in protecting dwellings against road traffic noise, Appl. Acoust., 64(7):633–653 (2003). 25 K.V.Horoshenkov and S.N.Chandler-Wilde, Efficient calculation of two-dimensional periodic and waveguide acoustic Green’s functions, J. Acoust. Soc. Am., 111(4): 1610–1622 (2002). 26 S.N.Chandler-Wilde and D.C.Hothersall, Efficient calculation of the Green function for acoustic propagation above a homogeneous impedance plane, J. Sound Vib., 180:705–724 (1995). by 27 P.Concus, D.Cassatt, G.Jaehnig and E.Melby, Tables for the evaluation of Gauss-Laguerre quadrature, Math. Comput., 17:245–256 (1963). 28 M.Abramowitz and I.Stegun, Handbook of Mathematical Functions, Dover Publications, New York (1964). 29 N.N.Voronina and K.V.Horoshenkov, A new empirical model for the acoustic properties of loose granular media, Appl. Acoust., 64(4):415–432 (2003). 30 P.M.Morse and K.U.Ingard, Theoretical Acoustics, Princeton University Press, Princeton, NJ (1986). 31 S.N.Chandler-Wilde, Ground effects in environmental sound propagation, PhD Thesis, University of Bradford (1988). 32 K.K.Iu and K.M.Li, The propagation of sound in narrow street canyons, J. Acoust. Soc. Am., 112(2):537–550 (2002). 33 L.M.Brekhovskikh, Waves in Layered Media, Academic Press, New York (1980), p. 228. 34 S.H.Tang and K.M.Li, The prediction of façade effects from a point source above an impedance ground, J. Acoust. Soc. of Am., 110:278–288 (2001).
Predicting outdoor sound
464
35 S.-I.Thomasson, A powerful asymptotic solution for sound propagation above an impedance boundary, Acustica, 45:122–125 (1980). 36 International Organization for Standardization, ISO 9613–1:1993, Attenuation of sound during propagation outdoors—Part 1: calculation of the absorption of sound by the atmosphere (1993). 37 K.Attenborough, Acoustical impedance models for outdoor ground surfaces, J. Sound Vib., 99(4):521–544 (1985). 38 J.Kang, Sound propagation in street canyons: comparison between diffusely and geometrically reflecting boundaries, J. Acoust. Soc. Am., 107(3):1394–1404 (2000). 39 F.X.Sillion and C.Puech, Radiosity and Global Illumination, Morgan Kaufmann, San Francisco, USA (1994). 40 J.D.Foley, A.van Dam, S.K.Feiner and J.F.Hughes, Computer Graphics: Principle and Practice, second edn, Addison-Wesley, Reading, MA (1990).
Index Abramowitz 36 Absolute humidity see Humidity Absorbing façades 412; ground 136, 368, 386, 398, 413; road 399 Absorption 396 Absorption coefficient 345, 394, 424, 428 Absorption parameter 393–394 Absorptive screen 268 Acoustic: impedance see Impedance; monitoring of soils 108; pressure 26; to seismic coupling 88 Acoustical characteristics 68 Acoustically 83; deduced 133; hard 31, 39, 61, 78, 111, 204, 209, 217, 360, 398; harder 163; neutral 10–11, 13, 170, 305, 360, 362; rigid 49; soft 25, 61, 130, 209, 261, 360, 372 Adiabatic: compressibility 64; correction factor 15; lapse rate 10 Admittance: effective 108; of ground 78, 82, 400, 417–418 Aerosols 296 Air absorption 4, 21, 22, 172, 290, 328–329, 335, 342, 345, 351, 372–373; see also Atmospheric, absorption Aircraft see Noise sources Airfield 3, 346 Airport(s) 61, 131, 169, 174, 236 Air to ground coupling 88, 120; see also acoustic to seismic coupling Allard 67 Amplitude 225; fluctuations 301 Anemometer 288; cup 311–312; hot wire 311–312; sonic 311
Index
467
Angular frequency 26 ANSI standard method for ground impedance 108 Approximation: for ground effect 162; for sound speed profile 20 Arranz 272 Asphalt: hot-rolled 51, 62, 209; porous or pervious 31, 40; sealed 131 Asymmetry of meteorological effects 14 Atmospheric: absorption 289, 352; acoustics 1; boundary layer 10, 15–16, 23; thickness 15; refraction 19, 374; stability 10, see also Stable atmosphere; surface layer 16; turbulence 3, 12 Attenborough 25, 49, 55, 65, 159, 296, 328 Attenuation 2, 22, 24; along a city street 390; coefficient 21; by foliage 290, 293; rate 346, 373; of a screen 246, 252–254 Average: downwind 7; -ing times 14; sound levels 13 Avon see Rolls Royce Avon A-weighting 165, 167, 168, 229, 233, 328, 329; A-weighted level 5, 6, 165, 170, 297, 300, 344–347, 355, 359; A-weighted noise 263, 291, 300, 316, 329, 336, 365, 378 Aylor 113, 293–294 Azimuth angle 30, 179, 317, 319, 322 Balcony 395–399; insertion loss 399 Ballast 159, 227, 229, 230 Banos 25 Barrier 201, 236, 262, 290, 374; arrow profile 273–274; correction 368–369; cranked see top-bended; finite length 260, 261; gaps 262, 264, 266–267; inclined 236; leakage 262, 267; louvred 236, 275; multiple-edged 236, 277;
Index
468
railway 277; straight-edged 236, 273; Thnadners 273; thin 255–256, 259, 264–265, 272; top-bended 236, 274, 277; T-profile 273–274, 278; Y-profile 273–275 Barrière 299 Bass 105 Bean plant 287 Bells 1 BEM see Boundary Element Method Bertoni 211 Bessel function 140, 295 Biot 66, 71 Blind shooting 319 Body wave 49 Bolen 105 Born 247 Boss model 78, 113 Bosses 80 Botteldooren 299 Boundary: condition(s) 27–28, 32, 55, 90, 137, 143–144, 176, 181, 216, 413; layer 9, 15, 16, 23; wave 146, 177 Boundary Element Method 222, 227–228, 262–263, 272, 279, 375, 409; integral element method 215, 272, 274, 280, 409; integral equation 410 Boundary loss factor 38, 46, 51–52, 318 Bowman 240 Bracketing scheme 319 Bragg 301 Branches 296; see also Trees Broadband 104 Brush 294 Bullen 294 Buoyancy 302 Buret 193–194, 198 Buser 109 Bushes 290, 294 Businger-Dyer profiles 16 Car see Noise sources Carslaw 237 Caustic 319; see Ray Cell model 65 Champoux 66, 71 Chandler-Wilde 169, 218, 412
Index
469
Characteristic impedance see Impedance; of a porous medium 65–67 Characteristic lengths 67, 69, 230 Characteristic times 75; aerodynamic 75; thermodynamic 75 Chew 381, 385 Chien 25 Classical absorpion 21 Clay 113, 130, 287; granulate 65 Clifford 304, 306 Cloud 17, 19 Cohen and Greeberg 425 Coherence factor 305–306 Coherent scattering see Scattering Compacted earth 109, 115; silt 130 Complementary error function 34, 36, 162 Complex: characteristic impedance 421; compressibility 64, 67; density 63, 66–67, 69; excess attenuation 124, 290; noise barrier edge 275; propagation constant 26, 50, 62, 66, 70, 72, 89, 90, 294; sound field 307; transfer function 102; wave number 83 Component of wind speed 15 Computing time 108 CONCAWE 10–11, 13, 290, 355, 359–362 Concrete 353; porous 227, 229 Continuity: of particle velocity 43; of pressure 28, 43 Contour integrals 240; integration 415 Convection coefficient 195; factor 201 Convex 49 Copson 237 Corn 294, 295 Corrected level difference 3 Corsain 104 Coupled phase 296 Coustone 65 Cramond 103, 109, 132 Crops 287 CRN 371–372, 376, 380–381 CRTN 168, 362–364, 369, 372, 377, 384–387, 396, 398–399, 422
Index
470
CSTB 376, 380, 382 Cultivated field 367 Cylinder arrays 294–296 Cylindrical: polar coordinates 237, 239, 318; pores 64, 66, 70; wave sources 400 Daigle 103, 211, 272, 305 Davenport 16 Davis 385 Defrance 162, 297, 299 De Jong 195, 210, 211, 217, 218, 219, 222, 224, 226, 227 Delany 362, 363 Delany and Bazley model 50, 53, 62, 73, 74, 107, 109, 110, 124, 131, 162, 165, 169, 170, 257, 258, 260, 271, 328 Depth (of porous layer) 72 Derham 1 Diabatic momentum 15; heat profile 15; inverse function 16 Dickinson 102 Diffracted wave 239 Diffraction 243, 300, 301, 354; by barriers 61, 190, 236; diffracted field 238, 256; diffracted ray 223; diffracted wave 258, 299; grating 112; by a thin plane 238; by a wedge 243 Diffuse reflection see Reflection Diffuse scattering see Scattering Dilatational wave 88–89 Dipole source 136–137, 154, 160, 194, 195, 205; arbitrarily orientated 142, 150, 153; horizontal 137, 139, 141–143, 145, 147, 148, 152, 179, 263; vertical 142–150, 152, 156–157 Direct impedance deduction 108, 113 Direct wave 38, 52, 57, 138 Directivity 158, 351 Discontinuous ground 61, 195 Disked soil 78 Diurnal variation 22 Doak 102 Don 103, 109, 132 Donate 25 Doppler effect 356; factor 179, 195, 317 Double diffraction 354 Downward refraction see Refraction
Index
471
Downwind 7, 18, 19, 224, 300, 347, 350–351, 358, 359 Duhamel 279 Eddy 301, 304 Effective: admittance 40–41, 45–46, 108, 137, 177; depth 72; flow resistivity 50–51, 72, 109, 124–129, 133, 163–164, 170, 257, 260, 271, 336, 337; impedance 86, 296, see also Impedance; sound speed gradient 331; structure function parameter 312; wave number 299 Eigenray 316, 319, 321–322 Elevation angle 202 Embleton 103–104, 107, 131, 248, 269, 294–295 Emission time 178–179, 185, 188 Error function 305; see also complementary error function ESDU 359 Euler method 319–320 Excess attenuation 61, 77, 86–87, 93, 95–96, 104, 106, 108, 111, 142–143, 155, 210, 215, 220, 257, 287–288, 290–291, 293, 322, 361; instantaneous 186, 188, 201; optimum 329, 334, 337, 339, 341–344 Exponential porosity model 72–73 Extended reaction 39, 50, 56, 420 Extinction coefficient 307 Explosion 1 Façade absorption 407–409 Farmland 353 Fast Fourier Transform see FFT Fast field formulation 271 Fast Field Program 307; see also FFP Fast wave 88 FFLAGS 91, 93, 120, 122 FFP 271, 308, 310–311, 316, 324 FFT 308, 309 FHWA 385 Finite impedance see Impedance Flow resistivity 61–62, 71–72, 83–85, 87, 108, 110, 124–129, 131, 164, 328, 334, 337, see also Effective flow resistivity; steady 64 Floor of a forest see Forest floor Fluid: displacement 90; pressure 90 Foliage 2, 291, 293, 295, 299 Forest 290–291, 294, 297–299;
Index
472
cedar 291; coniferous 291–292; deciduous 291, 293; edge effects 299; floor 2, 40, 102, 130, 291; oak 293; pine 291–293, 297; spruce 291, 293 Form factor 425 Forssen 272 Fourier transform (-ation) 25, 27, 56, 57, 138, 143, 151–152, 154, 176, 182, 318 Frame displacement 90 Free field 102, 105, 195 Frequency: dependency 162 Fresnel 247, 273; function 223; integrals 210, 237, 242, 246, 249; -Kirchoff approximation 247–252, 275; number 242, 247, 250, 251, 253, 255, 257; zone 211–215, 373–374 Fricke 294 Friction velocity 15 Fujiwara 269, 274–275 Fyfe 262 Gabillet 162 Galilean transformation 176 Gamma function 332 Gaussian 272 Gauss-Laguerre quadrature rule 402 Geodecke 306–307 Geometrical: divergence 352; ray theory 373; spreading 2; theory of diffraction 191, 238, 274 Geophone 119 GFPE 297, 299 Gibbs 275 Gilbert 272 Glass beads 65, 68 Golebiewski 347 Gradient: Temperature 2, 9, 12; Wind 2, 9, 12, 226 Graham 174 Grain shape 69; factor 72
Index
473
Granular: materials 68; medium 69 Grass 61, 257, 287, 357 Grassland 31, 61, 104–105, 115, 159, 168, 209, 282, 291, 296, 299, 337, 346, 353, 359, 367 Gravel 65, 124, 129 Grazing incidence 51, 104–105 Green’s function 26, 31, 36, 55, 58, 138–139, 141, 143, 150–151, 158, 160, 176, 215, 414; in a canyon 406, 408, 417, 420; for a periodic array of sources 401 Ground: Admittance see Admittance, of ground; attenuation 352–353; cover 2, 368; effect 4, 61, 188, 291, 292, 306, 351, 352, 359, 372, 373; elasticity 62, 88, 119, 120; extended-reaction see Surface; factor 352; impedance 62, 324, 375, see also Impedance; layered 25, 84; optimum 342; multi-layered 43; porous 46; reflection 428; roughness 62, 87, 108; semi-infinite 42; wave 39, 46, 48, 52, 148 Habault 104 Hadden 243, 247, 257, 259, 260, 262, 270 Hamet 63, 75, 110 Hankel function 140, 240, 295, 400 Hard-backed layer 41, 43, 50, 54–55, 63, 72, 75, 132, 260, 420 Hard ground 2, 201, 258, 262, 386; rough ground 84; rough surfaces 78, 84, 111; see also Acoustically, hard HARMONOISE 350, 373 Harriott 211, 212, 213, 218 Hasebe and Kaneyasu 385 Hatfield 3 Hayek 271 Heat conduction 2 Heaviside step function 245 Hecht 247 Heimann 20 Helmholtz: equation 26–27, 137–138, 144, 176, 215, 228, 373, 413; inhomogeneous Helmholtz equation 143; integral 263
Index
474
Heterogeneous ground see Impedance, discontinuity High-speed train 278 Ho 273 Horizontal dipole see Dipole Horizontal gaps see Barrier gaps Horizontal level difference see Level difference Horoshenkov 278, 418 Hothersall 169, 211, 212, 213, 218, 273, 275, 384, 386 Hucknall 4, 5, 6, 7, 8, 309, 310, 345, 346, 347, 357, 358 Huisman 132, 293, 296 Humidity 24, 345, 347; absolute 22; relative 14, 22, 23, 345 Humus 130 Hutchins 273 Huygen’s principle 204 Hydraulic radius 64 Hydrodynamic flow or shape factor 80 Hygrometry 13 Ice 110 Ichida 132 Illuminated zone 396 Image source 30, 48, 139, 145, 177, 179, 184, 201, 203, 242–243, 254, 351, 388, 390, 407, 411, 414, 416, 428; receiver 203, 243, 396, 397 Impedance 62–63; area-averaged 196, 220; boundary 304; characteristic 65, 420; condition 32; discontinuity 171, 197, 199, 211, 216, 218; finite 259; ground 63, 148–149, 158, 175–176, 255, 258, 260, 318, 413–414; jump 195; layer 63, 409; meter 102; models 107; normalized see Normalized impedance; plane 264, 400, 401, 402; relative 62; strip 217, 219, 220; surface 61–63, 340; tube 62, 101, 102 Impulses 103 Incoherent: scattering see Scattering; sources 258 Index of refraction 28, 31, 39, 44, Industrial noise see Noise sources Inertial length scale 303
Index
475
Ingard 25, 63, 179, 186, 192 Inner scale of turbulence 20–21, 303 Insertion loss 246, 250, 257, 259, 278, 281, 399 Integration path 33–34, 402 Inversion see Temperature, inversion Isei 269 Ishizuka 275 ISO 9613–1 356, 373 ISO 9613–2 7, 61, 168, 294–295, 350, 353, 355–357, 376, 380, 382 Isothermal sound speed 71 Jacobian 322 Jet engine noise 158, 309, 335, 357, 358 Jin 274 Johnson 67 Kang 422, 423, 425, 428, 429 Kawai 25 Keller 250 Kirchoff 212, 254, 374 Kirchhoff approximation 374 Kirchhoff-Helmholtz integral 263 Koers 210 Kokowski 165, 167, 344 Kropp and Berillon 396 Kurze and Anderson 250; -formula 251, 253–255 L10 index 363 Lam 258, 260, 261, 357 Lambert’s cosine law 422 Laplace transform 401 Lataitis 304, 306 Layered porous ground 45 Layer thickness see Depth L’Esperance 269, 270, 271 Lead shot 64 Leaves 296; see also Foliage Level difference 105, 107, 118 Levine 237 Li 25, 53, 198, 263, 272, 316, 318, 328, 396; Iu and Li 412, 413, 416, 418, 428; Tang and Li 416 Line of sight 302 Line source 55 Locally reacting ground 32, 35, 50–51, 61, 104, 136 Log-amplitude fluctuations 302 Log-normal pore size distribution 70 Long-term predictions 3 51
Index
476
Lorentz transformation 175–176, 182, 192; log-amplitude fluctuations 303; logarithmic profile 19 Loose soil 109 Lowson 174 Lucas 80 Lyons 275 MacDonald 237, 239–241, 251, 252, 253, 257, 260, 269 Mach number 183–184, 186, 190, 192, 196, 203 Maekawa 250, 251 Makarewicz 165, 167, 328, 330, 344 Matched field algorithm 104 Matta 36 May 273, 396 Mean roughness height 86 Menounou 253, 255 Mersenne 1 Meteorological correction 354–355 Meteorologically neutral 10, 13, 360 Meteorology 9, 123 Microstructural models 63 Minimization 104, 108 MITHRA 376 MLSSA 105, 123 Mohsen and Oldham 396 Molecular relaxation 2, 21 Multiple-edge: barriers 351; noise screen 277 Multiple reflection 385, 387, 389, 392, 412, 421 Multiple scattering 294–295, 299 Multipoles 136 Multipor 120 Momentum 15; diabatic 15; roughness length 15 Monopole source 26, 35, 136–137, 139, 147–149, 155, 157–158, 160, 316; see Point source; moving 179, 186, 194 Morse 63, 179, 186, 192 Motion see Moving source effects Moving-source effects see Noise sources Muradali 262, 275 Narrow-band 102 Neutral atmosphere 16; see also acoustically-neutral and meteorologically-neutral Nicolas 53 NMPB 385 Noise see Noise sources: in tunnels 393
Index
477
Noise sources: aircraft 158, 171-172, 350; dipole see Dipole sources; industrial 350, 355; monopole see Monopole or Point sources; moving 175, 195, 204; quadrupole see Quadrupole sources; rail 158, 187, 227, 275, 281, 350, 355, 372, 375-376; road traffic 55, 187, 296, 300, 350, 355, 366, 377-378, 384, 386, 390; train 377-378, 380; Non-specular scatter 80, 83 NORD 2000 373-374, 385 Nordic prediction method for train noise (NMT) 376, 380-381 Normal stress 90 Normal surface impedance 101-102 Normalized admittance 413, 417 Normalized impedance 32, 86 Normalized surface admittance 409 Normalized surface impedance 162 Numerical distance 35-36, 39, 51, 185, 318 Nyberg 196, 219–222 Obukhov length 15, 17, 302 Ocean acoustics see Underwater, acoustics Octave band 14, 106 Ogren 272 Oil seed rape, 168, 287, 289-290 Okubo 274 Osman 273 Ostashev 306 Outgoing waves 44 Packing density 112 Parabolic cylinder functions 332 Parabolic Equation method 309, 316; see also PE method Parallel building façades 388–391, 399, 412, 428 Parkin 3, 11, 52, 345, 346, 360 Pasquill: category 10, 16, 19; class 10, 17; classification system 360; stability categories 10 Patch source 427 Path length 317, 326, 428 PE method 223, 271-273 Penumbra 326 Pepys 1 Perfectly-reflecting boundary 392; see also Acoustically, hard Periodic roughness see Roughness
Index
478
Phase 61, 101, 136, 225, 322; covariance 305; factor 42; fluctuations 301-302, 305, 323; gradient 103 Phenomenological: theory 63; model 71, 73, 110 Pierce 192, 243, 257, 259-260, 269 Plane wave 21, 37, 40, 78-79 101, 120 Plane wave reflection coefficient 38-39, 41-42, 44-45, 162, 180, 197, 316, 318 Plants 289 Ploughed ground 118, 129, 166, 168, 337 Plumes 9 Point source 104, 165, 211, 304, 340; equivalent 278 Polar angle 317, 320-321 Poles 34-35; subtraction of 403-404 Pore shape parameter 65-66, 159 Pore size distribution 69, 76-77 Poroelastic ground 119; see also Ground elasticity Porosity 61, 65, 120, 131, 159 Porous 2; boundary 49; ground 45-46, 407; medium 62; road surface 39, 257, 407 Prandtl number 63 Pressure 138; amplitude 299, 300, 307; gradient 28; release 42 Price 291, 295 Pride 76 Probability of meteorological class 12 Probe microphone 101-102 Propagation constant 64, 101, 231; see also Complex, propagation constant Propagation see Sound Propagation through buildings 359 Pulse 49 P wave 88 Quadrupole source 136, 154; arbitrarily orientated 153-154; axis 154; field 155;
Index
479
lateral 155–157; longitudinal 155–157; vertical 157 Radiosity method 384, 421 Radlett 3 Rasmussen 63, 162, 211, 265, 271, 272 Raspet 55, 322 Rathe 250 Ray: caustic 318; crossing 318; curved 318; direct 224, 368, 381; ground-grazing 2; ground-reflected 330; path 225, 319, 322; reflected 398; tracing 2, 316, 324, 326, 331, 361; sound 31 Rayleigh wave 92–94; air-coupled 49, 121 Reactance 47, 62 Reciprocity theorem 148 Rectangular pores, 64 Redfearn 250 Reflected wave 52, 57 Reflection 351; balcony correction 398; building façade correction 351, 370–371, 386; diffuse 384, 407; façade- 386–387, 391; multiple- 387, 391 Reflection coefficient see Plane wave; Spherical wave Refracting atmosphere see Refraction Refraction 2, 107, 331, 359; downward 17, 226, 298, 318, 322, 326, 338, 339; upward 2, 298, 318, 326–327, 338–339, 344 Refractive index 20; see Index of refraction; fluctuation 302, 311; in a moving atmosphere 317, 320 Reichal 36 Relative: characteristic impedance see normalized and characteristic impedance effective admittance 79; humidity see Humidity; SPL 112 Relaxation losses 2; models 74, 110 Residue series 401
Index
480
Resistance 47, 62 Resonance 296 Retarded time 182 Reynolds number 303 Rigid: boundary 405; frame of porous medium 72, 88 Roberts 258, 261, 262 Rolls Royce Avon 3, 4, 5, 165, 335 Roots 129, 130 Rough ground 333; surface 62, 78, 83, 86; see also Roughness Roughness 62, 76, 78, 84, 86, 108, 111, 113, 115, 118, 125, 126, 338; length 16; periodic 83, 112; random 116 Rubinowics-Young formula 247–248 Rudnick 25 Sabatier 55 Salomons ix, x, 16, 271 Sand 68, 107, 114, 129, 217, 220–222; loamy 129, 131; Olivine 65; rough 113, 114; sandy plain 130; smooth 110 Scatterer interaction factor 80 Scattering 2, 387; amplitudes 294; cross section 311; diffuse 385, 430; by foliage 298; reverberant 2, 293; by roughness 77–78; in a street 409; thermal 296; by trunks 298; by turbulence 103, 301, 302; by vegetation 290–291, 293; viscous 2, 293, 296 Screens see Barriers Scholes 3, 11, 52, 271, 345, 346, 360 Schwinger 237 Screen-induced wind speed gradients 12, 223, 299, 360 Screening 354, 372 Seismic refraction survey 91, 119 Semi-cylinders 79 Semi-empirical model 63, 124, 209, 350, 388 Senior 240
Index
481
Shadow: boundary 238–239, 241, 243, 326–327; zone, 5, 238–239, 251, 299, 318, 326, 362, 375 Shear 2, 302; instabilities 300; viscosity 2 Short-range 104 Short-term predictions 351 Shuoxian 385 Silsoe Research Institute 289 Similarity relations 16, 18, 20 Simpson 384, 386 Singularity 320 Sleeper 227, 229 Slit-like pores 64–65, 70; microstructure 109; model 110 Slow wave 88 Sludrzyk 247 Slutsky 211 Smooth ground 84; finite impedance 85; porous surface 84 Snell’s law 31; modified 319 Snow 2, 5, 53–54, 62, 68, 101, 109, 130, 291; dry 131; freshly-fallen 40; layer 39; -like 75; new 130; sugar 131 Soil 129; sandy 129 Solar radiation 10, 13, 17, 360 Sommerfeld 25, 27, 29, 237, 416 Soroka 25 Sound 1, 2; attenuation mechanisms 2; channel 320; field 136; ground-reflected 61; level relative to free field 125, 126, 127, 128, 162, 222, 268; see excess attenuation; level difference 105, 113, 118; path separation 21; ray see Ray; shadow 2; velocity 326; Sound speed 1, 31, 319; gradient 2, 323; wave 32
Index
482
profile 14–16, 20, 316; power of Avon jet engine 165; power level 165, 330, 351, 353, 379, 380, 381, ray see Ray Source: spectrum 278; see also Noise sources Specific-heat ratio 186 Spectrum of turbulence: Gaussian 303–305, 307, 310; Von Karman 303–304, 307 Spherical spreading 2, 4, 165, 172; see Geometrical spreading, wavefront spreading Spectral analysis of surface waves 91, 120 Specular reflection 196, 198, 222; Specularly reflected wave 38 Spherical polar coordinates 33, 139, 177, 240 Spherical wave: divergence 102; reflection coefficient 38–39, 103, 184, 198, 204, 245, 316 Spherical wave reflection coefficient 141, 210, 219, 257, 305, 373, 416 Sports field 108 Sprague 103 Square pores 64 Stable atmosphere 9, 15, 360 Stability of atmosphere see Stable atmosphere Stacked: cylinders 68; spheres 68–69, 76 Standard deviation of pore-size distribution 70 Steenackers 390 Steepest descent method 30, 401 Stegun 36 Stinson 63, 66, 69, 71, 103 Stochastic scattering see Scattering Stratification factor 322 Stratified atmosphere 316 Street canyon 392, 406–407, 415, 423 Strength parameter 302 Stress, continuity of 90 Structure factor 63, 70 Stubble 166, 168 Sub-soiled ground 118 Substitute sources 211 Substrate 72 Surface: discontinuous 217; extended reacting 39, 50, 56, 59; impedance 61–63, 66–67, 72–73, 75–77, 85, 91, 92–93, 97, 103, 333; locally reacting see Locally reacting ground; rigid see Hard ground; road 366; roughness 15, 76, 105, 287,
Index
483
see also Roughness; temperature 20; wave 39, 46–49, 52 Suspension 296 Tagaki 252, 392 Taherzadeh 272 Tang and Kuok 385, 388 Tangential stress 90 Taraldsen 73, 74 Taylor series 241 Temperate climate 10 Temperature 3, 8–9, 20, 358; absolute 21; gradient 2; 271, 292, 310; fluctuations 20, 302, 303; inversion 13, 20, 224, 350, 355; shallow 20; lapse 2; potential 10; profile 18; variation 312 Template method for impedance deduction 108 Thermal: conduction see heat conduction; effects 63; exchange 88; instabilities 300 Thermistor 312 Thomasson 63, 108, 263, 264, 418 Time domain 75 Tolstoy 78, 80, 81, 237 Tone bursts 103 Top-bended 236, 274 Topography 2, 123 Tortuosity 64–65, 71, 125–128, 159 Traffic noise see Noise sources Train see Noise sources Transmission loss 268, 324 Travel time 325 Trees 61, 290, 351 Triangular pores 64, 66, 70, 85 Two-parameter model 108, 124, 125–128, 142, 323, 328 Tubes 63 Tunnels 392 Turbulence 2, 12, 18, 20, 116, 118, 289–290, 299, 300, 303, 307, 309–310, 322–323, 329, 335, 341–342, 345, 358, 362, 375; convective 300; measurement 311, 312; scale 305, 306; scattering by 299, 310;
Index
484
screen-induced 299; spectrum see Spectrum of turbulence Turbulent flux 9 Turning point 224, 316, 320–321 Twersky 78, 79, 80, 81, 294, 295 Underwater: acoustics 1, 2, 104; sound 78 Unstable: atmosphere 10, 15 Upward refraction see Refraction Upwind 2, 18, 300 Van der Heijden 103, 132 Van Renterghem 299 Variable porosity model 124, 132, 292, 330, 332, 335, 343–344 Variance of wind and temperature fluctuations 20 Vegetation 2, 13, 61, 287, 290–291; -covered, 78, 357; tall 290; wind-induced vegetation noise 300 Velocity: fluctuations 311; gradients 107 Velocity potential 174 Vertical dipole see Dipole Vertical edge 354 Vertical gradients 9 Vertical level difference 118 Viaduct 377, 381 Vibration of ground 88 Virtual distance 179 Viscosity 64, 66; correction function 67, 69; dynamic viscosity function 66; Padé approximation for viscosity correction function 70; viscous coupling 88; viscous effects 63 Viverios 275 von Karman 15, 307 Walker 296 Wang 272 Watts 263, 275 Wavefront 39, 320–321; spreading 4, 351 Wavenumber 26, 79, 304, 307; see also Complex wave number Wedge 190, 192–193, 210, 243 Wempen 105, 107
Index
485
Weyl-Van der Pol formula 39, 46, 58, 141, 146, 162, 163, 164, 177, 178, 263–264, 304, 316, 329, 413; Doppler-Weyl-Van der Pol formula 182, 187, 189, 192, 196–197 Wheat 287 Wilson 74–75 Wind 3, 118; direction 13–14, 271, 300, 312, 350, 351; gradient 271, 292, 310, 360–361; speed 13, 14, 15, 299, 300, 302, 358, 361 Wolf 247 Wong 263 Woodland 291–292; see also Forest Wu 323 Yamamoto 252 Zouboff 13