Volume II
Editor
Zeev B. Alfassi, Ph.D. Professor Department of Nuclear Engineering Ben Gurion University of the Negev Beer Sheva Israel
45742 NIC
LIBRARY
CRC Press, Inc. Boca Raton, Florida
Library of Congress Cataloging-in-Publication Data Activation analyis I editor Zeev B. Alfassi. p. cm. Includes bibliographical references. ISBN 0-8493-4583-9 (v. 1). -- ISBN 0-8493-4584-7 (v. 2) 1. Nuclear activation analysis. I. Alfassi, Zeev B. QD606.A252 1990 543l.0882--dc20
89-24021 CIP
This book represents information obtained from authentic and highly regarded sources. Reprinted material is quoted with permission, and sources are indicated. A wide variety of references are listed. Every reasonable effort has been made to give reliable data and information, but the author and the publisher cannot assume responsibility for the validity of all materials or for the consequences of their use. All rights reserved. This book, or any parts thereof, may not be reproduced in any form without written consent from the publisher. Direct all inquiries to CRC Press, Inc., 2000 Corporate Blvd., N.W., Boca Raton, Florida 33431. 1990 by CRC Press, Inc. International Standard Book Number 0-8493-4583-9 (Volume 1) International Standard Book Number 0-8493-4584-7 (Volume 11) Library of Congress Card Number 89-24021 Printed in the United States
PREFACE Elemental analysis is done best by nuclear methods since these are determined only by the nuclei and are not affected (in most cases) by the surrounding electrons, i.e., the chemical environment. Activation analysis is a method of quantitative chemical analysis of the elemental composition of the samples based on the nuclear activation of the atoms of the chemical elements present in the analyzed sample. Activation analysis usually has the following advantages: (1) simultaneous multielement analysis, (2) very high sensitivities (detection of limit in the range of ppm and ppb or less), (3) nondestructive analysis, and (4) easy and fast analysis which in many cases can be automated. The book describes both prompt measurements (60th y and particles) and delayed activities (mainly y-ray spectrum). The book treats the various methods of activation, i.e., activation by neutrons, accelerated charged particles, and high-energy photons. Special chapters are devoted to the application of these methods in the fields of life sciences, biological materials, coal and its effluents, environmental samples, archeology, material science, and forensic studies.
THE EDITOR Z. B. Alfassi, Ph.D., is a professor and the chairman of the Nuclear Engineering Department in the Ben Gurion University, Beer Sheva, Israel. Professor Zeev B. Alfassi received his B.Sc. and M.Sc. degrees from the Hebrew University in Jerusalem in 1964 and 1965, respectively, in the fields of chemistry and biochemistry. He received his Ph.D. from the Weizmann Institute of Science and the Soreq Nuclear Research Center in 1970. Professor Alfassi is a member of the council of the Israel Nuclear Society. He has published more than 100 scientific papers and edited the CRC book Chemical Kinetics of Small Organic Radicals. His current research interests include chemical analysis by nuclear methods, radioisotope production and uses, radiation chemistry and chemical kinetics of radicals in solution, and solubility of electrolytes in water-miscible organic-solvents mixture.
CONTRIBUTORS Volume I1 Zeev B. Alfassi, Ph.D. Professor Department of Nuclear Engineering Ben Gurion University of the Negev Beer Sheva, Israel Atif Alian, Ph.D. Professor Department of Chemistry Faculty of Sciences University of Garyounis Benghazi, Libya Chien Chung, Ph.D. Professor and Director Nuclear Science and Technology Development Center National Tsing Hua University Hsinchu, Taiwan Rumiana Djingova, Ph.D. Chief Research Scientist Department of Analytical Chemistry Faculty of Chemistry University of Sofia Sofia, Bulgaria Alain G . Elayi, Dr. es Sci. Maitre de Confkrences Division of Experimental Research Institute of Nuclear Physics Orsay, France Kenneth J. Ellis, Ph.D. Associate Professor Department of Pediatrics Children's Nutrition Research Center Baylor College of Medicine Houston, Texas Vincent P. Guinn, Ph.D. Professor Department of Chemistry University of California Irvine, California
William Dennis James, Ph.D. Research Chemist Center for Chemical Characterization and Analysis Texas A & M University College Station, Texas Ivelin Kuleff, Ph.D. Associate Professor Department of Analytical Chemistry Faculty of Chemistry University of Sofia Sofia, Bulgaria
Abraham P. Kushelevsky, Ph.D. Associate Professor Department of Nuclear Engineering Ben Gurion University of the Negev Beer Sheva, Israel
Max Peisach, Ph.D., D.Sc. Chief Specialist Researcher Nuclear Analytical Chemistry Division National Accelerator Centre, Faure, C .P. South Africa
B. Sansoni, Ph.D. Director Zentralabteilung of Chemie Analysis Kernforschungsanlage Julich Julich, West Germany
Takeo Sato, Ph.D. Chief Isotope Section Division of Technical Services Tokyo Metropolitan Institute for Neurosciences Fuchu, Japan
Gad Shani, Ph.D.
Yoshiyuki Tanizaki, Ph.D.
Associate Professor Department of Nuclear Engineering Ben Gurion University of the Negev Beer Sheva, Israel
Chief Researcher Tokyo Metropolitan Isotope Research Center Tokyo, Japan
Eiliv Steinnes, Ph.D.
M. H. Yang, Ph.D. Professor Institute of Nuclear Science National Tsing Hua University Hsinchu, Taiwan, Republic of China
Professor Department of Chemistry University of Trondhein, AVH Dragvoll, Norway
To my parents Arieh and Lea the lion and the lioness
VOLUME OUTLINE Volume I GENERAL Introduction - Principles of Activation Analysis Computerized Analysis of y-Ray Spectra Optimization of Instrumental Activation Analysis Limits of Detection in Instrumental Neutron Activation Analysis Radiochemical Separations in Activation Analysis Use of Delayed Neutrons in Activation Analysis Use of X-Ray Emitters in Activation Analysis Stable Isotope Dilution Activation Analysis Substoichiometric Radioactivation Analysis Utilization of Chemical Derivatives in Activation Analysis INDEX
TABLE OF CONTENTS Volume I1 11. ACTIVATION METHODS Chapter 1 Activation with Nuclear Reactors.. ....................................................... 3 Z. B. Alfassi Chapter 2 14 MeV Neutron Activation Analysis ................................................... 7 3 A. G. Elayi Chapter 3 Prompt Activation Analysis with Charged Particles ....................................143
M. Peisach Chapter 4 Photon Activation Analysis. ............................................................219 A. P. Kushelevsky Chapter 5 Activation Analysis with Isotopic Sources. ............................................ .239 G. Shani Chapter 6 Activation Analysis with Small Mobile Reactors ......................................,299 C. Chung 11. APPLICATION OF ACTIVATION ANALYSIS Chapter 7 Activation Analysis of Biological Materials ............................................323 T. Sato Chapter 8 Activation Analysis of Coal and Coal Effluents ........................................359 W. D. James Chapter 9 Activat' I Analysis of Water Samples .................................................377 Y. Tahiizaki Chapter 10 In Vivo Neutron Activation Analysis ...................................................407
K. J. Ellis Chapter 11 Activation Analysis in Archaeology ....................................................427 I. Kuleff and R. Djingova
Chapter 12 Activation Analysis in Forensic Studies ................................................491 V. P. Guinn Chapter 13 Activation Analysis of Air Particulate Matter ..........................................503 A. Alian and B. Sansoni Chapter 14 Activation Analysis in Agriculture and Botany.. .......................................567 E. Steinnes Chapter 15 Activation Analysis of Semicor~ductorMaterials .......................................579 Z. B. Alfassi and M. H. Yang Chapter 16 Depth Profiling of Silicon by Nruclear Activation Methods ............................ .597 2. B. Alfassi and M. H. Yang Index ..................................................................................609
.
Activation Methods
Volume II
3
Chapter I
ACTIVATION ANALYSIS BY NUCLEAR REACTORS
.
Zeev B Alfassi
TABLE OF CONTENTS I.
Introduction .......................................................................4
I1.
Reactor's Epithermal and Fast-Neutron Activation Analysis ......................4 , A. Introduction ...............................................................4 B. Advantage Factors for (n. y) Reactions .................................... 7 1. Brune and Jirlow's Advantage Factor .............................. 7 2. Parry's ' 'Improvement Factor" ....................................8 3. Bern and Ryan's Advantage Factor ................................ 9 4. Tian and Ehmann's Generalized Advantage Factor ................ 9 C. Thermal Neutron Absorbers ..............................................13 D. Applications of Epithermal Neutron Activation ........................... 16 E. (n,n') Activation .........................................................17 . F (n. p) and (n. a) Reactions ................................................ 18 1. Rapid Determination of Iron ......................................18 . 2 Determination of Phosphorus and Silicon .........................20 . 3 Other Elements ...................................................23
111.
Reactor Cyclic Activation Analysis .............................................. 23 A. Introduction ..............................................................23 B. Theory ...................................................................24 1. Effect of Transfer Times t, and t, ................................. 25 2. The Effect of Background ........................................ 27 C. Measurement of the Half-Life ............................................ 27 D. Cyclic Activation Involving Daughter Activity ...........................28 E. Replicates vs . Cyclic Activation .......................................... 29 F. Dead Time and Pile-Up Corrections ......................................29 G. Examples of Uses ........................................................ 32
IV .
Activation Analysis with Pulsing Reactors .......................................32
Table for Identification of Nuclides Formed in Nuclear Reactors .......................35 References ...............................................................................67
4
Activation Analysis
I. INTRODUCTION The most important source for bombarding particles for determination of trace elements by activation analysis is the nuclear reactor, due to its relatively high flux of bombarding particles and the relatively high cross-sections for the radiative capture reaction of thermal neutrons (n,y). Many of the recently published books on activation analysis concentrate on the usual techniques of thermal neutrons activation analysis and since these techniques are already routine, there is no point in repeating them here. Since the identification of the analyzed element is done by its y lines and half-lives, and since we have some reservations about most of the tables appearing in the literature (some of them include all existing radionuclides even if they are not formed by neutron activation, and hence they are too big and, therefore, cumbersome; other tables are lacking important data, e.g., absolute intensities of the y lines, abundances of the stable isotopes or cross-section for activation which give a measure for the probable formation of the radionuclides), we give at the end of this chapter a table which seems to us to be the most appropriate for activation analysis with nuclear reactors. As a measure of probable formation of radionuclide, it is preferable to give the product of the natural abundance and the cross-section for (n,y) reaction of its parent nuclide since it is this product that appears in the activation equation, and there is no advantage of giving the values separately, enlarging the table without any advantage. The chapter itself deals with three subjects of activation analysis which receive less attention in usual textbooks: activation with epithermal and fast neutrons from nuclear reactors, cyclic activation analysis, and the use of pulsed reactors.
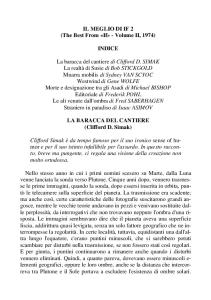
11. REACTOR'S EPITHERMAL AND FAST-NEUTRON ACTIVATION ANALYSIS A. INTRODUCTION In usual instrumental neutron activation analysis (INAA), the whole reactor neutron energy spectrum is used. However, in some cases, the use of part of the neutron spectrum is preferable; these systems are characterized by large differences in the activation crosssections for the desired and the interfering nuclides in the various parts of the energy spectrum. The required trace elements are activated with part of the neutron spectrum while the interfering major elements are activated more strongly with the other parts of the spectrum, and thus we prefer to avoid this second part. The neutron energy spectrum in a nuclear reactor is usually divided, for convenience, into three portions, and their relative abundances are dependent on the reactor structure. The most abundant fraction is the one of thermal neutrons, i.e., those neutrons which are in thermal equilibrium with the moderator atoms. Their most expected energy is equal to kT (where k is the Boltzmann's constant, T is the neutron temperature), which at room temperature is equal to about 0.025 eV. The neutrons with energy above those of the thermals are divided into fast neutrons, those which are directly from fission and have not been moderated at all with energy mainly above 1 MeV, and epithermal neutrons, i.e., partly moderated and having energy between tenths of eV and 1 MeV. When the whole reactor neutron energy spectrum is used for activation, the main contribution is from the thermal neutrons due to their usually higher cross-section ([n,y] reactions). In some cases where the epithermal and fast fluxes present a problem, special care is taken to use locations of irradiation where the neutrons are highly thermalized and the fast and epithermal fluxes are low. A case like this is the determination of sodium in the presence of large concentration of magnesium and aluminum.' Sodium gives with thermal neutrons "Na via the 23Na (n,y) 24Nareaction; however, "Na can be formed also from
Energy, keV
FIGURE 1 . Gamma-ray spectra of blood serum activated by reactor neutrons (a) and epithermal neutrons (b).
magnesium or aluminum with fast neutrons by the reactions 24Mg (n,p) 24Naand *'A1 (n,a) 24Na. Sun et al. ,' in order to reduce the contribution of magnesium and Al toZ4Na,used the thermal column for irradiation, since the disadvantage of having lower total flux in that position is more than overcome by the very low flux of epithermal and fast neutrons. An opposite case is the more usual one, i.e., the case where the required trace elements are activated more strongly relative to the major elements by the epithermal or fast neutrons. Most stable isotopes of the major elements in geology and biology follow the l/v crosssection rule (their activation cross-section is inversely proportional to the square root of the neutron energy) throughout the whole energy spectrum. On the other hand, many of the less abundant elements have, in addition to their thermal activation, large activation cross-section resonances in the epithermal energy region and consequently can be activated preferentially in this region. Similarly, several of the less common elements can be activated by other neutron reactions besides the common (n,y)reaction. These (n,p), (n,a), and (n,nf)reactions require higher energy than thermal (and in most cases, they did not occur also in the epithermal region and are induced only by fast neutrons). A simple example for the advantage of using neutron filters (thermal neutron absorbers) in activation analysis is seen in Figure 1, which shows the y-ray spectra of a sample of blood serum activated with reactor neutrons once within a cadmium wrapping and once without any absorber (bare irradiation). In the case of activation without Cd absorber, the Comptons of the major elements Na and C1 cover the peaks of bromine and iodine (bromine can be determined only after a delay of several days while the shorter-lived iodine cannot be determined instrumentally and can be determined only after chemical separation). The activation with epithermal neutrons (Cd cover) shows clearly the peaks of Br and I. Since the reactor's neutrons spread over a large span of energy and since the flux and the cross-section varied with the energy, the usual activation equation
6
Activation Analysis
where R is the rate of activation, N is the total number of atoms of the element to be activated, u is the cross-section for the activation reaction, and is the flux of the activating particles (neutrons), is replaced by the equation
+
The integral in Equation 2 is replaced usually by the sum of two integrals separating the thermal and the epithermal regions. The lower limit of the epithermal component of the reactor's neutron spectrum is taken as either pkT (where p = 5 for H,O and D20 reactors and 3 for some graphite reactors) or the energy cut-off of a filter used to absorb the thermal neutrons. For the more common absorber, Cd, this cut-off energy is equal to 0.55 eV for a cylindrical cadmium box with a wall thickness of 1 mm. Equation 2 is usually replaced by an equation which involves averages of the cross-sections and the flux
R where
+,
=
R*
+ Rep, = (+* . at, +
. I,) . N
is the average thermal flux and a, is an effective thermal cross-section
or for I/v nuclides at 293 K
where u, is the cross-section for 2200 rnls neutrons and g is parameter representing the deviation in the thermal region from the llv law. is the epithermal flux per unit InE and I, is the resonance integral. The common convention is to use for the second term the I,, term - the cut-off energy of 1-mm thick Cd filter, 0.55 eV, as the low boundary integral. When reactor systems &e composed of constant slowing down density, i.e., when the effects of neutron leakage and absorption can be neglected, the slowing down spectrum follows an almost dE/E distribution [+(E)dE = +epidWE].2Thus the epithermal neutron activation is given by the equation
Attention should be paid that in the ideal case by
+,
is not the total epithermal neutron flux which is given
It is very important when comparing various studies to check how the epithermal flux (fluence rate) is defined. In most works, Equation 4 is used to calculate the epithermal flux (most commonly with dilute gold foils, 0.1 to 0.3% in aluminum, covered with a cadmium sheet and using the gold resonance integral, 1550 b), however, these methods usually determine and not the total epithermal neutron flux. L,the epithermal cross-section, is only an approximate resonance integral as the precise
Volume II
7
value of the resonance integral should consider the real lower energy limit (pkT)and the overlap of the two neutron spectra. The theoretical resonance integral I, is given by
where a, is the cross-section for kT neutrons (2200 m/s neutrons), g is a parameter which represents the departure of the cross-section from the l/v low in the thermal region (if the l/v law is obeyed g = l), and E, is the thermal energy = 0.0253 eV. However, for activation analysis, the approximate experimental integral I,, is the important one and many resonance integrals are t a b ~ l a t e d according ~-~ to Hogdahl convention7 which set 1 MeV
u(E) is taken as the total activation cross-section including the l/v contribution. If the resonance integral is defined with cross-section excluding the I/v contribution, I, the activation rate is given by7
The epithennal activation properties of a nuclide can be conveniently expressed by means of the absorber ratio, which gives the ratio of the activity of this nuclide irradiated
once with the whole reactor's neutron spectrum and once covered by an absorber of thermal neutrons. Thus the cadmium ratio is given by
The most important fact is not only how the insertion of an absorber of thermal neutrons influences the activity of the specific measured nuclide but also how it influences the interfering nuclides. Thus it would be advantageous to analyze an element by epithermal neutron irradiation rather than by using the whole spectrum of reactor neutrons for the activation (ENAA vs. RNAA as it is most usually written, epithermal and reactor neutron activation analysis) if its ratio of resonance integral to thermal neutron cross-section I&, is larger than this ratio for the interfering elements. Several criteria were suggested to measure the advantage of ENAA over RNAA. B. ADVANTAGES FACTORS FOR (n,y) REACTIONS
1. Brune and Jirlow's Advantage Factor Brune and Jirlow9 suggested in 1964 to use as an advantage factor for ENAA activation the ratio between the cadmium ratio of the measured nuclide and the interfering nuclide. &d
F,, = REd where RCdis the cadmium ratio as defined previously; the superscripts 0 and i stand for the
8
Activation Analysis
measured element and the interfering nuclides, respectively. This is the most used advantage factor and several tables of this factor for many nuclides appeared in the literature for cadmium absorber as well as for boron ab~orber.~.'O-'~ In some irradiation facilities where the thermal neutrons absorber is installed permanently, the absorber ratios cannot be determined since the activity without an absorber cannot be measured. In this case, the advantage factors (called enhancement factors by Gladney et al." since they are approximate advantage factors) are measured by comparison of irradiations of the nuclides in the absorber-lined position and in a bare irradiation port. Although the spectral distribution in the various places in the reactor might be different, which means that the advantage factor measured in that way will not be the same as measured using only a bare irradiation port with and without an absorbing capsule, the true meaning of those advantage factors are the same. They give the advantage of using the epithermal activation either by using an absorbing capsule or lining the irradiation port with an absorbing material (thermal neutrons absorber). Substituting Equation 7 to Equation 8 gives
F,,
=
FR + Sk FR s;
---
+
where FR is the ratio of the fluxes (F, = 4@$,) and S, is the ratio of the cross-sections (S, = a&). The superscripts 0 and i stand as before for the measured and interfering elements, respectively. Equation 9 shows that if F, > Sk, S;;, then the advantage factor F,, equals unity; since the flux is mainly epithermal, the absorber of the thermal neutrons does not change considerably the activity either of the analyzed element or of the interfering element. In the opposite case where Sk, S; > FR, FBj = Sk/S; which can be looked at as the upper limiting value. For many experimental set-ups, F,, is lower than this limiting value and consequently it is not expected to obtain the same advantage factors in different studies since Sk and SO, are constant but F, is different for the various reactors. F, will be higher for less well-moderated nuclear reactors (reactors with "hard spectrum" of neutrons).
2. Parry's "Improvement Factor" In 1980, Parry1' pointed out that while the advantage factor describes well the increase in the signal-to-noise ratio, it does not consider the decrease of the activity of the analyzed element due to the elimination of the activation by the thermal neutrons and hence does not treat the larger error resulting from the lower counting statistics. Parry suggested that the true criteria should be the improvement in the detection sensitivity. The lower detection limit L, for a radioactivity measurement, i.e., the minimal signal which can be detected above the background at 95% confidence level is given by Equation 10.18
where B is the background activity. The minimal detected mass in activation analysis (sensitivity) is given by
where A is the specific activity of the analyzed element under the experimental condition for the activation and detection. Since A is proportional to the activity of the analyzed element and since B is due mainly to the interfering nuclide, Parry suggested that the improvement factor f, is given by
Volume II
9
3. Bern and Ryan's Advantage Factor Bem and Ryan'' in 1981 followed the same trend of thinking as Parry a year earlier; however, they suggested that the advantage factor should describe the improvement of the relative standard deviation of the counts. The relative standard deviation where the net counts (base line corrected counts) is N and the base line count is B is given by the expression
and the advantage factor is given by
where the subscripts i and 0 stand as the superscripts before. When the background is mainly due to the interfering radionuclide, Bem and Ryan's advantage factor is equal to that of Parry. The correlation of Parry's advantage factor to that of Brune and Jirlow can be seen from the comparison of Equations 8 and 12.
Therefore, Parry's advantage factor is always smaller than that of B ~ n and e Jirlow.
4. Tian and Ehmann's Generalized Advantage Factor Tian and Ehmann20 criticized Bem and Ryan's criterion (and consequently also Parry's) on the grounds that in practice, in RNAA, the limit on the number of counts is not due to the activity of the analyzed sample but rather due to problems associated with high dead time which lead to inferior resolution and also causing problems of pile up and inaccurate measurement of the counting live time. In order to overcome these problems, the samples are measured quite far from the detector or are irradiated for short times. When the sample is activated with only epithermal neutrons, the total activity of the sample is reduced considerably, and hence the counting efficiency can be increased by using smaller sampledetector distances or the total counts can be increased by using larger samples or larger irradiation times. If the increase in counts (due to either count efficiency or size of the sample or length or irradiation) is given by GZ, than the generalized Tian and Ehmann's advantage factor is given by
, f,, = f,,. if G = 1, f,, = f,, and if G = 1 / ~ &then The last case is the practical one since, both in the thermal activation and in the epithemal activation, the counting efficiency is usually chosen to obtain the maximum total counting rate allowable by the dead time correction device. This generalized approach of Tian and Ehmann20 gives a more firm basis for the widely used definition of Brune and Jirlow. Table I summarizes the advantage factors found in the literature together with the limiting value of the advantage factor calculated from the resonance integrals and thermal cross-sections.
TABLE 1 Relative Advantage of Epithermal Neutron Activation (24Na = 1.0)
Cd filter Element Radionuclide Mg Al C1 K Ca Ti
"Mg 29~1 ' ~ 1 4ZK "Ca 51Ti
Mn
%Mn
Co Ni Cu
6SNi T u
v
=v -0
66Cu
Zn Ga Ge As Br Rb Sr Y
-Zn 70Ga 72Ga 75Ge 77"Ge "As
B @ r' 82Br -Rb 88Rb 87mSr 9"Y
zt Nb Mo Ru Rh
-Nb 1°'Mo lo5Ru 104mRh
Half-life 9.5 min 2.3 min 37.3 min 12.4 h 8.8 min 5.8 min 3.8 min 2.8 h 10.5 min 2.56 h 12.8 h 5.1 min 13.8 h 21 min 14 h 83 min 54 s 26.5 h 17.6 min 35.3 h 1.02 min 17.8 min 2.83 h 3.1 h 17.0 h 17.0 h 6.3 min 14.6 min 4.4 h 4.4 min
A
B
C
D
B filter
E
F 1.O5 1.14 0.95
1.73 0.80 0.70 1.51 2.11
Cd
+B
14 h 4.7 min 22 rnin 2.4 min 24.4 s 6.5 h 50 min 54 rnin 40.1 min 9.7 min 4.2 min 1.55 min 69 min 25 rnin 25 rnin 2.9 h 2.55 rnin 82.9 rnin 40.2 h 33 h 1.73 h 12.4 min 47 h 23 min 9.3 h 18.6 h 3.6 min 1.26 min 26.9 h 7.5 h 1.9 h 6.45 s 17 h 18.6 min 31 h 1.45 min 18 h 18 h
TABLE 1 (Continued) Relative Advantage of Epithermal Neutron Activation (24Na = 1.0)
Element Radionuclide 19Tt
Th
233%
U
239U
Half-life
A
30.8 min 22.2 min 23.5 min
11.7 9.65 22.5
B
C
D
E
F
G
H
I
J
K
9.3 10.3 9.66 9.39 25.4 20.7
Note: A, Calculated from thermal neutron cross-sections and resonance integrals; taken from References 3 to 6; B, taken from Reference 29; C, taken from References 16 and 30; D, taken from ~efgrence12; E, taken from Reference 14; F, taken from Reference 10; G, taken from Reference 29; H, taken from Reference 11; I, taken from Reference 12; J , taken from Reference 13; and K, taken from Reference 30.
Volume 11
13
The interfering element was chosen as sodium which is the main interfering element in biological systems when nuclides with t,,, > 1 h are analyzed. For shorter decay times,38 C1 is also a strong interfering element and in geological samples,28A1 is a strong interference. However, their S, differ by less than a factor of 1.5 and consequently it does not considerably change the picture.
C. THERMAL NEUTRON ABSORBERS The main absorbers for thermal neutrons are cadmium and boron due to their high crosssection for reaction with thermal neutrons; however, other elements can also be used, although requiring thicker absorbers than with Cd or B. The variation of the cross-section with the energy is different for Cd and for B, hence an intelligent choice of an absorber (also sometimes called a filter) will lead to optimized detection of some nuclides." In some cases, one absorber is used and in others a combination of two absorbers, e.g., Cd + B.'2,'7.21,22 In NaCl MnBr, Mn02).'2339 one case, even a mixture of four absorbers was used (Cd In some experiments, filters which absorb the epithermal neutrons in some regions are used allowing more selectivity for some elements.23 Since the main absorbers are boron and cadmium, it is very important to study the differences between them. Even before comparing their advantage factors, it is important to compare them from the technical point of view. The absorber can be used in connection with the sample as a covering sheet wrapping the material in it, mainly in the case of cadmium from which metallic sheets are commercially available, as a capsule built from these materials, and as a mixture with the sample, used with B20,,24 or as a permanent installation inside one of the irradiation ports of the reactor. The use of absorber-lined ports has the disadvantages that (1) scattered thermal neutrons can come from angles which are not covered by the lining of the absorber leading to lower absorber ratios,2s while when the absorber is used as a capsule or wrapping, it is covered from all angles, and (2) the capsule in which the sample is held during the pneumatic transfer and which usually is from polyethylene leads to partial thermalization of the epithermal neutrons.23On the other hand, the use of an absorber-built capsule or wrapping suffers from the disadvantages of the absorption reactions. Cadmium is activated and forms short- and long-lived nuclides and the unloading and unpacking of the sample for medium- and long-lived radionuclides measurement faces radiation safety problems due to the high radiation dose. Short-lived (t,,, < 20 to 30 s) radionuclides cannot be measured at all in cadmium capsule since the short half-life prohibits the safe unpacking of the vessel and the activity of the absorber is too high to allow measurement together with the filter. While the absorption of neutrons by 1°B does not lead to radioactive products, the reaction loB (n,cx) 7Li is very exoergic (Q = 2.792 MeV) and the samples are heated considerably. Stroube et found that in the 20-MW reactor at the National Bureau of Standards (U.S.), thermal heating of the boron nitride vessel limited the length of irradiation for freeze-dried foods to 4 s and prevented completely safe irradiation of wet food. When biological samples are irradiated, this heating accelerates the thermal decomposition of organic compounds producing high pressure in sample container, when they are airtight sealed, which may explode and contaminate or even ruin the irradiation port. In other cases, elements may be volatilized and lost. In order to avoid these effects, the time of irradiation should be limited. Glascock et al.27found that irradiation in a boron nitride (BN) vessel in the peak flux position (-1014 n cm-2 s-I) should not exceed 10 s to prevent the melting and destruction of the polyethylene materials. Stroube et a1.,26 in order to lengthen the allowed time in the BN vessel, irradiated the samples inside the BN capsule in a cadmium-lined irradiation position and for 2-MW reactor found that the maximum allowed time for safety reasons is 3 min. The cadmium lining greatly reduced the heating of the BN vessel and allowed a much longer irradiation time. Gladney et al." used boron-lined irradiation position by hot pressing a mixture of 50% elemental boron and 50%
+
.
+
+
14
Activation Analysis
aluminum into aluminum sleeves which are welded to a cooling water jacket to ensure proper cooling of the sample. Williamson et a122measured the temperature inside a polyethylene rabbit inserted into a Cd-lined irradiation port and found that the temperature reached an equilibrium value of 90°C in about 7 min. When a BN capsule was irradiated in the same position, the measured temperature was 120°C in about 3 min and continued rising. Ehmann et al.28 irradiated rock samples in a boron carbide filter for 20 h, keeping the sample in heat-sealed quartz ampules. Quartz, being a poor thermal conductor, keeps the sample from being highly heated, however, this solution is good for geological samples but will probably not suffice for biological samples. Chisela et studied the temperature in a sintered BC capsule in an air-cooled irradiation facility and found the capsule to reach steady-state temperatures of 163°C and 194°C for 4.0-MW and 5.0-MW reactors, respectively. When a permanent installation from powdered B4C was done with water cooling, the temperature reached not more than 50°C. The use of permanent lining of absorber has also the disadvantage of reducing the total flux of the neutrons in the reactor and of excessive use of the nuclear fuel. Another possible advantage of boron over cadmium is the reuse of the same filter in subsequent irradiation. Cadmium filters cannot usually be reused, at least immediately, due to the long-lived radioactivity produced in cadmium during irradiation. The activity produced in boron filters is small and is only due to contamination in the boron. However, the use of boron filters is limited in many cases to not too high total doses of neutrons due to structural failure of the capsule probably due to excessive formation of helium gas from the 1oB(n,a)7Lireaction. Cadmium filters are easily done from metallic cadmium sheets of about 1-mm thickness. Boron is a difficult material to machine and Stuart and Ryanz9prepared boron shields by forming a mixture of boron carbide powder and paraffin wax. The mixture was heated to 70°C (paraffin melting point = 56°C) and cast into cylindrical forms. A central hole was made in the form as it solidified by using a heated metal rod of appropriate diameter. The hole was not done through the whole length of the cylinder, in order to obtain a cylindrical capsule with a central cavity closed at one end. The other end was closed with a top made from the same material. Parry16 used the same method, however, instead of using boron carbide, she used B powder. It should be mentioned that the paraffin is causing a small thermalization of the epithermal neutrons. The best machinable refractory boron compound is BN,30and consequently many of the studies with boron filters were done using BN capsules. Ehmann et a1.28suggest not to use BN due to the relatively high cross-section of 1.81 b for the 14N (n,p) 14C reaction which will lead to formation of an appreciable amount of the long-lived radioactive 14C,but rather to use boron carbide, another refractow
One of the disadvantages of boron filters is the impurities found in boron powder as discussed in detail by Bem and Ryan.I9 However, if a boron capsule is used together with a permanently installed Cd lining, the interferences due to the activities of *'A1, 56Mn,and 38Clfrom the boron contaminants are significantly reduced.16 Both cadmium and boron have high absorption cross-sections for low-energy neutrons; however, the energy dependence of the cross-sections differs considerably. Figure 2 shows that cadmium approaches a perfect sharp filter for the thermal region and has some resonances in the epithermal range whereas boron behaves as almost a perfect l/v absorber with no sharp energy cut-off. Although the cross-sections for neutron capture by boron is lower than the cross-sections for absorption by cadmium in the lower energy range of 0.01 to 1 eV, it can be compensated for by using thicker boron absorbers. A 0.25 cm thick boron shield is sufficient to stop practically all the thermal neutrons. The effective cut-off energy is almost independent of the thickness of the Cd absorber while it increases considerably with the thickness of the boron absorber, as can be seen in Figure 3.
Volume 11
15
FIGURE 2. Cross-sectionsfor neutron absorption by boron and cadmium as a function of the kinetic energy of the neutrons
-
10-
2
L 500
-1000
1
Filter Thickness ( m g / c m )
FIGURE 3. Dependence of the cut-off energy of the thermal neutron filter as a function of the filter thickness.
Rossitto et a1.21discusses the boron vs. cadmium absorber from the point of view of larger advantage factors. Assuming the nuclide of interest has only a single resonance located at energy E, and the interfering nuclide following the l/v cross-section dependence, he concluded that: (1) if ER 6 2eV, the best absorber is Cd, (2) for 2eV S ER 15eV, B + Cd will be the optimal choice, and (3) for E, 3 15eV, B or B + Cd will be equally effective.
16
Activation Analysis
However, it should be remembered that Cd also absorbs some of the resonance neutrons due to their reaction with cadmium in one of the energies at which cadmium has resonance (e.g., 18.40 eV113Cdresonance, although it is a small resonance). This effect which is called the cadmium correction factor, Fcd,32is usually ignored in most of the activation analyses, and it can be justified on the grounds that Fcd is usually very close to unity.32 Chisela et al.31calculated the advantage factor for three nuclides for both Cd and B4C absorbers as a function of the filter thickness. Up to 2-mm thickness, B4C is always inferior to Cd, however, for thicker filters, B4C start to be better than Cd. This preference can be a factor of 2 for the 9%40 (n,y) "Mo reaction (E, = 429 eV) or a factor of 1.3 for the E, = 62 eV Iz4Sn(n,y) '25mSnreaction or hardly 1.1 for the ER = 49eV "As (n,y) 76As.At high filter thickness, the advantage factors remains constant for Cd, but that of boron reaches maximum at thicknesses of 3 to 6 mm and a thicker boron filter leads to a decrease of the advantage factor as a result of increased absorption of higher energy neutrons by the thick &, boron filters. This absorption explains why, for some cases, elements with reasonable I ratio could be detected with Cd filter but not with Cd B filter (0.7-mm Cd 3-mm boron). Table 1 summarizes many of the advantage factors reported in the literature. It can be seen that variation among the different laboratories is quite large, mainly for boron absorbers since it depends also on the absorber thickness and density and not only on the flux ratio as was explained earlier. If the results of Stuart and Ryanzyare used, since they measure more Rcd and R, values than other groups, it seems that for most of the elements the difference between Cd and B is not too large; however, for some elements, boron in preferable while for other (although a smaller number) elements, the advantage factor is higher in the case of cadmium. Thus for indium, l16"In has AF (CD) = 11.0 while AF (B) = 2.0, probably due to the absorption by boron of the relative low epithermal energy neutrons which react with indium at its resonance of the Il5In (n,y) l16"In reaction at 1.457 eV; similarly for rhodium, AF (Cd) = 6.9 and AF (B) = 1.1. On the other hand, for the determination of cadmium itself, AF (Cd) = 12 and AF (B) = 34; similarly for lead, Af (Cd) = 27 and AF (B) = 64 or even AF ('OB) = 130. To summarize, as the samples measured usually include several elements, it does not make a big difference which filter is used. As a good practice, if very accurate results are required, it is worthy to irradiate once in a capsule of boron compound and once inside a Cd capsule. The data of Parry16 show that the advantage factor for Cd + B is always higher than of Cd alone (it was Cd lining + B capsule 1 and 2.7 mm thick, respectively).
+
+
D. APPLICATIONS OF EPITHERMAL NEUTRON ACTIVATION Epithermal neutrons are used more and more frequently in INAA of biological and geological samples due to the large concentration of interfering nuclides, Na and C1 in the case of biological samples, "A1, 56Mn, and 24Nain the case of geological samples. Many of these studies apply epithermal NAA to the determination of halogen^'^.^^.^^-^' especially in biological samples. Al-Sharistani and A b a ~ measured s~~ the concentration of iodine in blood samples using a shield for thermal neutrons which consists of Cd, NaC1, MnBr,, and MnO, in order to further reduce the activation of Na, C1, Br, and Mn. Cesana et a1.15 used B + Cd, 1 mm and 680 mg/cm2, respectively and obtained similar results. Wyttenbach et al.37 used a BN capsule and Alfassi and Lavi3' used Cd covers with all obtaining similar results for the detection limit. However, the determination by ENAA in biological samples is not limited only to the determination of halogens. More complex spectra were obtained by longer irradiation of several samples, e.g., oyster tissue for which the lower limit of detection (LLD) was found to be lower in the case of epithermal neutron activation for the ~~.~~ elements Mo, Ni, and Rb. For some other elements, it facilitates faster a n a l y s i ~ .Many
Volume 11
17
TABLE 2 Advantage Factors for (n,n') Activation with a Cadmium Absorber (Normalized to "CI (n,y) 38CI = 1.0)
Element
Produced radionuclide
Advantage factor Half-life
A
B
C
4.9 s 2.81 h
16.1 s 48.6 min 4.49 h 2.55 min 5.5 h 9.9 rnin 8.8 s 42.6 min 66.9 rnin Note: A , Parry;I6 B, G ~ i n nC, ; ~our results.61
papers deal with the use of ENAA in geological samples of various s o ~ r c e s , ~ ~and -~O it is this area in which many of the first works of the ENAA were done. Similar studies were done on coal and fly ash51-56 and other sy~tems.~'-'~ Rowe and Steinnes 51s2 found that for coal, epithermal irradiation is preferable for the determination of Ni, Zn, As, Se, Br, Rb, Sr, Mo, Sb, Cs, Ba, Sm, Tb, Hf, Ta, W, Th, and U, whereas thermal irradiation was best for Sc, Cr, Fe, Co, La, Ce, Nd, Eu, Yb, and Lu. Similar results were found also by ~ ~ also suggest the use of both thermal and epithermal NAA Kostadinov and D j i n g ~ v awho when two elements have very close gamma lines (second order interference) but their advantage factors are different, e.g., U (106-keV gamma line of 239Np)and 153Sm(103keV). This method is similar to that which deals with the first-order interference originated from the same nuclide produced from different elements, as is discussed later.
E. (n,nl) ACTIVATION The main advantages of using activation analysis by (n,nf) activation products is that the (n,nl) reactions produce nuclides with shorter half-lives and usually lower y energies and hence higher detection efficiencies. This is besides the advantage of less interference from the radionuclides produced by the absorption of thermal n e ~ t r o n s . ~ O However, -~~ only a few elements can be determined by this method. Table 2 gives the results of the advantage factors measured for these elements. The advantage factors are usually larger than those obtained for resonance (n,y) activation. The main disadvantage compared to thermal activation is the lower sensitivity due to a smaller flux of neutrons and smaller cross-sections. Sometimes this drawback is compensated for by the lower background due to less interference and sometimes also by the shorter half-life which allows an immediate measurement. For example, the thermal neutron activation of mercury yields lg7"Hg (23.8 h, 134 keV [34%]), 203Hg(46.6 d, 279 keV [77%]), and 205Hg(5.5 m, a weak y line of 204 keV).205Hg,due to its weak y line and the strong interferences in the short time immediately after the activation, cannot be used for the determination of mercury. 197mHg cannot be used in most cases due to its low y-ray energy which is completely covered by the Comptons of the interfering elements. Thus mercury is usually determined via 203Hgafter several weeks of delay. In many cases, the use of '99mHggives an immediate answer with a reasonable (7.8 s) instead of '98Au (2.69 d). accuracy. Another example is the measurement of 197mAu Another use is the determination of lead which can be measured only through the 204Pb
18
Activation Analysis
(n,nf) 204mPb(67.2 m, 899 keV) since (n,y) reaction on Pb does not lead to any gamma emitter. In some cases, the metastable isomer is formed both by (n,nf) and (n,y) which leads to lower advantage factors. An example is 77mSe(17.5s) produced both by 76Se(n,y) 77mSeand 77Se (n,nf) 77m Se. The normalization in Table 2 was done to 38Clor to 28A1in geological samples and not to 24Naas was done in Table 1, due to the fact that most of the (n,nf) products are short lived and in these short times C1 is a stronger interference; however, the &, is very close for 24Naand 38Cl (less than 10% difference) so the choice of the normalizing (interfering) element is not so important.
F. (n,p) AND (n,a) REACTIONS These reactions occurring with the fast neutrons with energy usually in the MeV range should be looked upon in two ways: (1) the use of these reactions for the determination of some elements and (2) the possible interference of these reactions in the determination of some elements by (n,y) reaction, due to the formation of the same nuclide." In the beginning of this chapter, we started with the use of the well-thermalized neutron flux in the thermal column of the reactor for the determination of sodium,' however, most of the activations are not done in the thermal columns due to the lower flux. In most cases, these interferences are low due to the lower cross-sections of these reactions relative to the (n,y) reaction and the lower flux of the fast neutrons. However, in some cases, this interference can be a serious one. For example, the determination of magnesium with thermal neutrons is done by 27Mg which is formed by the 26Mg (n,y) 27Mgreaction. Unfortunately, 26Mg has low abundance and low cross-section for the (n,y) reaction and thus this determination is seriously interfered by the reactions 27Al(n,p) Z7Mgand 24Na(n,a) 27Mg.Other cases can occur when the interference has much higher concentration than the measured element. These interferences can be solved only by the use of double irradiation, one with a bare core and one inside a Cd or B filter and calculating the contribution of each element. The same treatment is usually done for the use of (n,p) and (n,a) reactions in determination of some elements. The main advantage of these reactions is that they produce nuclides different from those produced by (n,y) reactions. Consequently, it may lead to a faster determination in the case of producing a short-lived nuclide rather than the long-lived one produced in (n,y) reaction. In other cases, it may enable the determination of elements which cannot be measured via (n,y) reactions since the produced radionuclide is only a P emitter. One disadvantage of these reactions is that the radionuclide obtained can be produced also by (n,y) reaction with other nuclides. For example, 52Vis produced both by the "V (n,y) "V and 52Cr(n,p) 52V reaction. As explained before, this disadvantage can be overcome by the use of double irradiation with and without thermal neutron absorber using the fact that the thermal neutron filter has a different effect on (n,y) reactions than on (n,p) or on (n,a) reactions. The cadmium ratio of the (n,p) and (n,a) reactions is much smaller than that of (n,y) reaction, even when the (n,y) reaction has a large resonance. However, the effects of B/Cd filter on the (n,p) and the (n,a) reactions are very close, so it is quite difficult to separate between these reactions if they produce the same nuclide. In some cases the competing two fast ~ 58Co or 54Fe (n,p) reactions are (n,p) and (11,2n),~e.g., 53Ni (n,p) 58Co and 5 9 C (n,2n) 54Mnand 55Mn(n,2n) 54Mn.In these cases, the interference can be calculated by measuring the Co or Mn through their (n,y) reactions leading to T o or Y o and 56Mn,respectively. To exemplify the use of (n,p) and (n,y) reactions, two examples are given. 1. Rapid Determination of Iron Figure 4 shows the y-ray spectrum of an iron sample irradiated for a short time. As can be seen, the peak of 847-keV y-rays of 56Mndue to 56Fe(n,p) 56Mnis considerably higher than the 58Fe(n,y) 59Fe 1099 keV. Hence the use of (n,p) reaction for determination of iron
Volume I1
OL-
-- 1
--
500
1000
Energy ( k e ~ )
FIGURE 4. Gamma-ray spectrum of iron irradiated with reactor neutrons (irradiation 10 min, delay 5 min, and count 6 min). (From Alfassi, Z. B . and Lavi, N . , J. Radionucl. Nucl. Chem. Art., 84, 363, 1984.)
has a higher sensitivity in the case of short irradiation and counting. However, s6Mn is formed also from manganese by the 55Mn(n,y) 56Mnreaction. The concentrations of both iron and manganese can be found by double irradiation, one sample with reactor neutrons (without any filter) and one sample with epithermal neutrons (with cadmium absorber). If the specific activity (measured counts under the experimental set-up per 1 g of the element) for irradiation with reactor neutrons will be F, and M, for iron and manganese, respectively, and similarly for epithermal neutrons F, and ME, then the activity of 1 g sample containing P,% of iron and P,% of manganese will be C, = (F, CE = (F,
. P, + M, . PM)/lOO P,
+ ME . P,)/
100
where C, and C, are the activities induced by reactor neutrons and epithermal neutrons, respectively. The solution of these two equations gives
where A = 100(FRM, - F,M,). The errors in the values of the specific activities are usually smaller than those associated with the measurements of the counts of the samples since the specific activities are determined by irradiation and counting of several samples. Consequently, the errors in P, and P, can be estimated assuming that only the Cs have errors associated with them. For determination of the quantity Q from two independent measurements X and Y, the standard deviation of Q is given by"
where S, and S, are the standard deviations of the measurements of X and Y, respectively. Taking only the standard deviations of CE and C, from counting statistics yields
20
Activation Analysis
TABLE 3 Comparison between the Amounts of Manganese and Iron in Known Mixtures with that Determined by Instrumental Epithermal Neutron Activation A n a l y s i ~ ~ ~ Known mass
Mn
Fe (mg)
Calculated mass
Mn ( M )
Fe (mg)
The best criterion for the minimum amount of iron which can be detected in this method is that its contribution to the counts will be larger than the statistical error in the contribution of manganese, i.e.,
or the minimum percentage of Fe which can be determined is
56Mncan also be formed from (n,a) reaction with 59Co.However, the cross-section for this reaction is about six times smaller than that for 56Fe(n,p) 56Mnand the contribution of 59Co (n,a) 56Mncan be calculated from the activity of 60"Co produced by 59Co(n,y) 60"Co since the ratio of these reactions is constant for a given experimental condition. Table 3 gives the comparison between the known composition of various mixtures of iron and manganese and those obtained by epithennal instrumental activation analysis with both reactor neutrons and epithermal neutrons.65
2. Determination of Phosphorus and Silicon Thermal neutron activation cannot be used for the determination of phosphorus and silicon. Radiative capture (n,y) reaction with the only stable isotope of P leads to formation of 32Pwhich is a pure P emitter. In the case of silicon [stable isotopes "Si(92.2%), 29Si(4.7%), and 30Si(3.I%)], the only radionuclide produced by the (n,y) reaction is 31Siwhich is almost only a P emitter. Its very low intensity of y-rays (1266 keV - 0.07%) together with the low abundance of 30Siand the low cross-section for radiative capture (0.11 b) enable only the determination of relatively large amounts of silicon. However, activation with epithermal neutrons leads also to the formation of "A1 via both 31P(n,a) "A1 and "Si (n,p) 28A1,and of 29Alby the 29Si(n,p) 29Alreaction. "A1 is produced also by the "A1 (n,y) 28A1reaction. This leads to a procedure for determination of Si from the activity of 29Al,which is produced only from silicon, using the activities of "A1 from activation with a Cd filter and without a filter to determine the concentration of both aluminum and phosphorus. However, the activity of 29Alproduced for Si is almost two orders of magnitude less than the activity of 28A1prduced from it. Thus, the use of 29Alwill both limit the minimal amount of silicon that can be determined and will reduce the accuracy of the measurement. Another problem
Volume 11
21
associated with the measurement of 29Alis that its main gamma line is the 1273 keV which suffers from the interference of the single escape peak of the more abundant ,'A1 at 1268 keV. However, when the concentration of Si is high, silicon can be determined by the 29Si (n,p) 29Al reaction as was done by H a n ~ o c k ~ for~ "the measurement of silicon in pottery using a Cd shield to decrease the formation of 28A1.The samples were allowed to decay for 17 to 20 min before counting for further decreasing of the 28A1activity. Ordogh et a1.66b measured in that way the concentration of silicon in very small inhomogeneous lymph node samples. The concentration of P was determined spectrophotometrically by the molybdenum blue method and hence the concentration of Si and Al can be found from the 28A1activity induced by both epithermal activation (Cd cover) and reactor neutron irradiation. Another way was suggested by Alfassi and LavP7 who used the simultaneous determination of 27Mg and 28A1, each of them for both reactor activation and irradiation with only epithermal neutrons, to measure simultaneously Mg, Al, Si, and P. Each of these radionuclides can be formed by three reactions
and solution of the four equations for the four measured activities (the 844 keV due to 27Mg and 1778 keV due to 28A1each without a filter and with a cadmium absorber). The specific activity (measured counts per 1 g of the element under the experimental set-up) will be assigned by three letters, the first one giving the target element, the second one the element formed, and the third one (R or E) will show if the activation has been done by reactor neutrons (without an absorber) or by epithermal neutrons (with a cadmium absorber). Thus, for example, SAR means the specific activity of ,*A1 produced from silicon by reactor neutrons. The activities measured per 1 g of sample are also represented by three letters, the first one is always C, and the second and the third have the same meanings for specific activities. If the concentration of Mg, Al, Si, and P are given by f,,, f,,, f,,, and fp in weight fractions, then the four appropriate equations are
+ AMR . fA, + SMR . fsi CME = MME . f,, + AME . f,, + SME - f,, CAR = AAR . f,, + SAR . fsi + PAR . f, CAE = AAE - fA, + SAE - fsi + PAE . fp
CMR = MMR . f,,
solving these equations gives f,, = (a,
. a,
-
fsi = ( a , a,
. - a, - a@ -
a, a6)/6
22
Activation Analysis
TABLE 4 Comparison of the Known Elemental Composition of Synthetic Mixtures with Those Measured by Epithermal Neutron Activation Analysis6'" Known mass (pg)
Measured mass (mg)
where a, = AAR PAE - AAE PAR
. . a, = AMR . MME - AME . MMR a, = SMR . MME - SME . MMR a, = SAR PAE - SAE PAR
a,
=
CAR. PAE - CAE. PAR
.
.
a, = CMR MME - CME MMR
8
f,,
=
a,-a, - a2.a3
= (CMR - m,,
f,
=
(CAR - m,,
- AMR - mS. SMR)/MMR . AAR - mSi.SAR)/PAR
Table 4 gives the known compositions of several synthetic mixtures prepared from Mg(NO,),, AI(NO,),, SiO,, and (NH,),PO,, together with the calculated masses from the above equations with the four measurements from two activations. As can be seen, this method gives quite reliable results for the determination of sulfur and phosphorus as long as their concentration is at least one order of magnitude larger than that of aluminum. This situation is found in many natural materials, such as phosphate ores, sand, some silicates, and so on. Table 5 lists the cadmium ratios obtained for the various reactions. Cesana and T e r ~ - a n i ~ ~ ~ measured P in bones using reactor irradiation with a B,C capsule, assuming that 28A1is formed only from phosphorus since the concentration of Al and Si in bones is very low. In pottery, they determined A1 from 27Mg, due to the low concentration of Mg, and after subtracting the contribution to '*A1 from Al, they calculated from 28A1the concentration of Si, since the concentration of P in pottery is very low.
Volume 11
23
TABLE 5 Scheme of Reactions Induced by Neutrons to Form Z7Mgand 28AI Reactions
Resulting nuclide
Cadmium ratio
Jones et al."' studied the concentration of silicon in plants by the 2ySi(n,p) 2yA1reaction. Although its peak at 1273 was resolved from 28A1single escape peak at 1268 keV, the resolution is bad enough and the error in the counts due to 29Alis quite high, so they preferred to take the counts due to the doublet (1268 1273) and to substract the counts of the single escape peak as calculated from the 1779-keV photopeak of 2XA1and the ratio single escapelphotopeak measured in irradiated pure aluminum sample. This method was found to be reliable for samples containing as little as 0.5 wt% silicon. For smaller concentration of However, silicon, they used 28A1for the determination of silicon, similarly to 0rdogh et instead of measuring the concentration of phosphorus by a colorimetric method, they prefer the derivative activation method. Phosphorus is converted to tungstomolybdicphosphoric acid which is extracted and then the tungsten is determined by neutron activation analysis as lX7W.Penev et al.69measured simultaneously Al, Mg, and Si in rocks by the method of Alfassi and L a ~ i , however, ~~" assuming the concentration of P to be very low and neglecting its contribution to 28Aland assuming the contribution of Si to 27Mgto be negligible, thus simplifying the equations. Soreq and Griffin3" measured the concentration of silicon in aluminum alloys with a detection limit of 0.4% silicon in 0.5g alloy sample, using the 29Si ( n , ~ ) * ~ reaction Al induced by epithermal neutron irradiation (BN capsule) resolving the 1268- and 1273-keV peaks by a computer program to analyze multiplets.
+
3. Other Elements Several other element^^".^^ were studied for their possible determination by (n,p) and (n,a) reaction as is summarized in Table 6. The most studied element is Ni,71due to its low sensitivity in the (n,y) reaction since the abundance of the @Ni, which leads to the 2.58 h 65Ni,is low. Several studies were done with the 58Ni(n,p) '*Co since the isotopic abundance of 58Ni is high 68.3 and the 58Ni (n,p) 58Coreaction has relatively high cross-section for epithermal neutrons (I 13 mb).
111. REACTOR CYCLIC ACTIVATION ANALYSIS A. INTRODUCTION Several elements can be measured by INAA only through the measurement of very ' F with 11.0-s half-life) and for short-lived isotopes (e.g., F which is activated only to O several others while the measurement through medium-lived radioisotopes is possible, the sensitivity can be considerably increased by the measurement of the short-lived radionuclides, for example measurement of 77mSe(17.4 s) instead of 75Se(120.4 d). At least 38 elements produce short-lived nuclides (half-life G 60 s) by thermal neutron bombardment. The use of short irradiation increased also the number of samples which can be measured per day and made activation analysis a more sound method economically. Due to the short half-life, the number of radioactive nuclei formed in saturation is small (Ndioactiv,= N.,..~-+t~,~/ln 2
24
Activation Analysis
TABLE 6 Reactions for Activation Analysis by Reactor Fast Neutrons via (n,p) and (n,cy) Reactions (%PI Element to be determined Oxygen Fluorine Sodium Magnesium Aluminum Silicon Phosphorus Sulfur Potassium Calcium Titanium
Vanadium Chromium Iron Cobalt Nickel Zinc Germanium Arsenic Niobium
Isotopic abundance X Activation cross-section product (mb)
ha)
Half-life 7.2 s 27 s 38 s 15 h 9.5 min 2.3 min 6.6 min 12.4 s 1.83 h 22 h 12.5 h 3.43 d 84 d 20 s 43.7 h 5.79 min 3.76 min 312 d 2.58 h
Isotopic abundance x Activation cross-section product hb)
Half-life
7.2 s
16N
24Na >'Mg
15 h 9.5 min
28A1
2.3 min
4'Ar
37.8 min 1.83 h
"Sc
44 h
2.58 h
S6Mn 71.3 d 12.8 h 21.1 min 49 s 3.19 h
+
where N, is the number of target nuclei, a the activation cross-section, the neutron flux, and t,,, the half-life of the formed radioactive nuclei) and consequently the counting has a large statistical error. In order to increase the number of counts, cyclic activation analysis should be used. In cyclic INAA (CINAA), a sample is irradiated for a short time, rapidly transferred to a detector for counting, and the entire process is repeated for a number of cy~les;'~,'~ the gamma-ray spectrum of each cycle is recorded to yield a cumulative spectrum.
B. THEORY Four periods of time are important in cyclic activation: the time of irradiation, t,; the time between the end of irradiation and the start of counting, i.e., the decay time due usually to the time required for transfer of the sample from the irradiation position to the counting station, t,; the counting time, t,; and the transfer time back to the irradiation position, a time in which there is decay mainly of the longer-lived radionuclides which contribute to the noise, t,. The cycle period T is given by
The number of counts for the first cycle is given by the equation
Volume 11
25
where a is the saturation activity and the F, are the time factors.
where E is the efficiency of the detector, I is the intensity of the radiation of interest, and A is the decay constant of the isotope of interest (A = ln2/tI,,). In the second counting period, there is the same number of counts due to the second irradiation plus what was left from the first irradiation
where F, = e-",. Similarly for the nth cycle, we obtain an expression which is the sum of a geometric series.
and the total number of counts accumulated in all the n cycles is given by
C, can be optimized by choosing proper times t,, t,, t,, and t, which lead to the optimal time-factors F,, F,, F,, and F,. The optimization can be done by plotting Equation 20 and finding the maximum. When dealing with optimization, the first question that arises is what quantity is to be optimized and what are the limitations. The answer to the limitation factors is simple, the transfer times and the total time of the analysis. We want the total time of the analysis, t, = nT, to be short enough in order to enable the measurement of a large number of samples. The important quantity to optimize is a combination between the signal and the signal-to-noise ratio. It is not only the signal-to-noise ratio which is important and should be optimized,77 since having a small signal with a very large signal-to-noise ratio still means a large statistical error in the activation analysis determination. Spyrou and suggested the quantity to be optimized is S / ~ where B s is the total counts, C,, due to the measured nuclide, and B is the total counts due to the interfering nuclides -the background. Spyrou et al.7Xsuggested that a more realistic quantity to optimize in order to obtain the timing parameter required is the increase in the relative error or the precision, i.e., the quantity to be optimized is S V M .
1. Effect of Transfer Times t, and t, The transfer time can be relatively long in the order of 10 s to 1 min when the transfer is done m a n ~ a l l y ,a~method ~ , ~ ~ which sometimes is referred to as Pseudo-Cyclic activation
26
Activation Analysis
analysis. The transfer time will be in the order of 0.4 to 2.081,82s where it is done pneumatically and computer controlled, and in some fast transfer systems, the transfer time is of the order of 0.1 s and less.', The transfer time can be made very small when there is no physical transfer of the sample but a pulsed irradiation source is used, which was suggested as the real cyclic activation a n a l y ~ i s . ' ~Assuming .~~ the transfer times to be constant and for a fixed period (T is constant), differentiation of Equation 20 with respect to t, gives that the maximum number of counts will be obtained when t, = t,, i.e., the same time is spent on activation as on counting of the activated sample. Givens et al.84 studied the effect of the number of cycles if the transfer time is taken as zero (t, = t, = 0) by plotting Equation 20 for various cases. They found that if the total analysis time is chosen as six times the half-life of the desired radionuclide, and if the irradiation and counting times are taken equal (t, = t, = T/2), then the maximum response occurs at a cycle time T = 2.4t,,,, independent of t,,,; however, this means 2.5 cycles which seems meaningless. An important conclusion from their calculation is that counting rapidly decreases for T > 2.4 T,,, whereas the decrease for T < 2.4 T,,, is very small, indicating that we want n 2 3 and there is no loss in larger number of cycles. However, this is true only when the transfer time is zero or at least negligible. When the transfer time is comparable to the irradiationlcounting times, it brings about too many cycles, for a constant irradiation time will lead to reduction of the total counts. Janczyszyn and GorskiSSstudied the effect of the sample transport time. Two distinct features can be seen in their plot of the detector response (total counts) vs. the cycle period, T, for total measurement time of six half-lives as a function of the transport time, or as they called it the idle time = t, + t4 : (1) the maximum is moved to longer periods (lower n) since the idle time is longer; (2) whereas for idle time = 0, increase in n did not change considerably C,, C, decreases with increasing n for practical idle times. Janczyszyn and Gorski gave a nomographic plot for the selection of the optimum number of cycles to maximize the counts in a given experimental time. By differentiating Equation 20 with respect to the cycle period, T, assuming constant transport time t, = t4 = constant and t, = t,, and equating the derivative to zero they obtained
where k = exp (At,) and x = exp (AT12) q
=
1 - exp( - At) At
and t - the total measurement time is equal to nT where n is the number of cycles. In order to resolve T from Equation 21, they used a nomographic plot of At, as a function of n q. From the knowledge of the transport time, At, is known and consequently from the plot nq is obtained. Since the total time of experiment is known, q can be calculated and hence n is obtained by a simple division. The procedure is simpler for the case At, 2 1 as there is only one nomographic plot. For At, S 1, for each n there is another nomograhic plot and approximation by iterative method is suggested for the optimal number of cycles. Tominaga and Tachikawag6gave a plot of normalized count vs. the normalized cycle period for various delay time. The delay time and the cycle periods are normalized in units of the half-life of the activated nuclide and the counts are normalized to large number of cycles without delay time. (They also assume t, = t,; t, = t,.) Tominaga and Tachikawa, however, stated that it is preferable to use in the case of mechanical sample transfer system a smaller number of cycles than is required to obtain maximum number of counts as long as the decrease in the number of counts is not Iafge (up to 10%). Their motivation is to reduce
Volume 11
27
the abrasion of the sample capsule and the transport tube and also the consumption of pressurized gas. Thus they give an extra plot, not only for the optimal cycle period as a function of the delay time but also what are the cycle periods, larger than the optimal one, which will still lead to 95 and 90% of the maximum number of counts. These plots of Tominaga and Tachikawas6 and those of Janczyszyn and Gorskis5 are very helpful in determining the required period of the cyclic activation; however, they are all on a log-log scale and the results obtained are not too accurate. Since microcomputers or programmable calculators are found everywhere in laboratories, it is simpler to use small and easy programs which will give interactively the optimal set of conditions for cyclic activation. These programs consider the presence of more than one activable nuclide and can choose a proper compromise between the requirements for the different radio nuclide^.^^^^^.^^ Al-Mugrabi and Spyroun9describe a program which simulates the photopeak, Compton continuum, escape peaks, and bremmsstrahlung. The simulation output forms the input to an optimization program, optimizing the signal-to-noise ratio.
2. The Effect of Background Spyrou and Kerr7' plotted the variation of the total counts for cyclic activation and conventional activation as a function of total experimental time for various transport times (all normalized in units of the half-life of the desired nuclide). As the waiting time becomes larger, the minimal time of experiment required for cyclic activation to be advantageous over the conventional one is larger. Their second plot of the signal to dbackground instead of the signal itself shows much more clearly the advantage of cyclic activation over the conventional one. They chose the half-life of the nuclides contributing to the background as lOOt,,,. The cross-over points from conventional to cyclic activation are now at times shorter by a factor of 2 compared to when only the signal was considered. Moreover, while S (the signal due to the measured nuclide) increases for cyclic activation and remains constant for conventional activation, S / ~ isBincreasing with experimental time for cyclic activation and decreasing for conventional activation as the signal reaches saturation at shorter times than the background. These plots show clearly that the cyclic activation is more advantageous as the ratio of the half-lives of the background and the signal is larger. Spyrou and Kerr7' studied also the length of the cycle period for a fixed experimental time required to maximize S or S / ~ (total B experimental time 10 t,,,, background half life = 100 t,,,) for several idle times. For all idle times, the optimal number of cycles in order to maximize S is always smaller than that required for maximizing s / ~ B They . found also that while in the hypothetical case of signal without background, S increases quite considerably and monotonously B not vary so much with the total with the experimental time, in the realistic case S / ~ do time of the experiment, and after some number of cycles S / ~ tends B to flatten out. The longer the half-life of the background, the flatter becomes the response, but it is to be remembered that S itself increases with time. The optimum cycle period decreases as the background half-life increases for the same value of the total experiment time, however, it becomes less pronounced for background half-life 3 100 t,,,. C. MEASUREMENT OF THE HALF-LIFE S p y r o ~ ~ "suggested ,~' that cyclic activation can be used also for determination or rather confirmation of the half-life of the nuclide measured. Equation 20 can be written as
For large n, 1
-
is close to unity and hence C, is a linear function of n.
28
Activation Analysis
F4 Plotting C, as a function of n yields -as the ratio R of the intercept to the slope
F, - 1
T In 2 However, care should be taken that ln (1 - 1lR)' the assumption 1 > Ff; is fulfilled for all the C, plotted as a function of n. It seems to us that a simpler way will be the use of the spectrum of each cycle itself, instead of using the < 1, accumulated spectra as suggested by Spyrou and his co-workers. Assuming Equation 19 becomes and hence F4 = R/(R - 1) and t,,, =
+
and hence F4 = 1 -
C Tln, ' and t,,, = The half-life t,,, can be calculated cn ln (1 - C,IC,,)'
from each cycle and finding the limit of t,,, as n is increasing. Al-Mugrabi and Spyrougl used Equation 23 to resolve the 85-keV peak measured, to the separate contributions of 132Snand "Wd. It is, therefore, important to store each individual cycle spectrum and not to store only the accumulated spectra. The storage of each cycle's spectrum can be used for (1) to correct the dead time of each cycle separately, as is outlined later, three p~rposes:'~ since the dead time increases with each cycle and also its time dependence, (2) to allow estimation of the effective half-life of the underlying background, in order to calculate optimal parameters for repeated activation, (3) to enable the estimation of the half-life of the measured nuclide in order to confirm its identity.
D. CYCLIC ACTIVATION INVOLVING DAUGHTER ACTIVITY Ortaovali et al.92 discusses the possibility of cyclic activation when the radionuclide decays to another unstable nuclide which also decays, i.e., a stable isotope A forms a radionuclide B which decays to a radionuclide C which decays further to either a stable or an unstable nuclide activation
h~
AC
A B C -If B and C emit different y-rays, they can be measured separately not interfering with each other. The counts due to B are according to the usual Equation 20 while the accumulated activity of C, C$, is given by the equation
i.e., if the counts due to C are equal to those of B, multiply by -- Ac
kc - A,
plus the same
equation; if C are formed directly from A with the same cross-section, multiply by A,/@, - A,). The meaning of each term in Equation 25 is the same as in Equation 20 where the subscripts or superscripts B and C indicate to which nuclide it refers, i.e., which A to be used. An interesting case when C is formed both directly from A by activation and through
Volume 11
29
B by decay is given by Ortaovali et al.91This considers all the cases where the radioactive capture of neutron by a stable nuclide produces both a ground state of a radioactive nuclide and a metastable isomer which decays to the ground state. They used the example of irradiation of 1°%h, where Io4Rh are formed by both reactions. IO4rnRh 4.41 min I.T. (100%)
If only one cycle with a short time is used, the route via lo4"Rh can be neglected, but not for cyclic activation.
E. REPLICATES VS. CYCLIC ACTIVATION Guinn suggestedg3another method similar to the cyclic activation which will use the same analysis time but will lead to a better precision of the determination than the cyclic activation analysis for short-lived isotopes; this method can be called the method of replicates. Guinng3pointed to the fact that in each cycle the main counts of the measured nuclide is due to the last irradiation, since this is the way timing parameters are determined. However, this is not true for the background radiation which has a considerably longer half-life. The simple conclusion is to irradiate and measure the sample only one time using n separate samples of the substance being analyzed instead of making n cyclic measurements on one sample of this material. The method of replicates also has fewer problems of dead time and pile up which in cyclic activation increases with each cycle. Also the same correction is applied for each replicate while a different one is applied for each cycle. The main disadvantages of the method of replicates is the large time required for the preparation of n samples for each material to be analyzed and the large number of rabbits and containers required. Guinn suggested that this method can be used for n < 5 to 10 due to the tedious preparation of n samples for larger n. Guinn pointed out that this method will be specially suited for sample materials that are not very homogeneous where the method of replicates is averaging the inhomogeneities. Parry94 used this method for the measurement of short-lived nuclides in activation analysis of geological material due to their inhomogeneous character. By this method Parry measured rhodium and silver in some geological samples and reference materials and found that the detection limit was improved by 20 replicates by a factor of 4.4 to 4.7 in accordance with the theoretical factor of nil2 ( d 2 0 or 4.5). She found that the total analysis time for 1 sample (20 replicates) was about 1 h (about 30 min weighing and 25 min analysis time). The other solution using larger samples (i.e., combining n samples together) cannot be used because of problems of dead time. F. DEAD TIME AND PILE-UP CORRECTIONS In assaying very short-lived radionuclides, a high count rate is necessary to obtain good statistics during the very short counting time available. This situation poses a problem since a high counting rate causes a high dead time and many cases of pile up. During each counting period, the activity of the sample changes considerably due to the decay of the short-lived products. Besides, the background due to the longer-lived activation products is building up cycle by cycle and hence the background differs from one cycle to another. As a consequence of the short transfer time required for the measurement of very short-lived nuclides, the measurements must be made close to the irradiation position, usually in the
30
Activation Analysis
reactor hall where even with considerable shielding there is high background gamma activity. The correlation between the actual measured net counts in the photopeak of interest, C, and the true initial photopeak count rate, %, is given by the equation.
where t, is the clock count time and D(t) is the dead time (in fractions) of the analyzer at time t. This equation is based on the following treatment, derived from the definition of dead time. If R(t) is the true count rate at time t, then the number of net counts measured in interval dt at any given moment t, n(t) is given by the following equation (which it is the definition of the dead time)
.
Substituting into Equation 27, the exponential decay of radionuclides R(t) = R, e-X' and
C
=
16'
n(t) leads to Equation 26. S c h ~ n f e l drecorded ~~ the analyzer dead-time circuit reading
vs. time during the counting period on a fast strip-chart recorder and then performed numerical/graphical integration calculation and calculate the true photopeak activity from the actual measurement by Equation 26. Wiernik and AmieP measured the rapidly changing analyzer dead time in a similar fashion, but they preferred not to use the Schonfeld method of calculation (Equation 26) as it calls for a time-consuming geometrical calculation of the area under the dead-time variation curve. They developed a method assuming that there is only one fast decaying nuclide and hence the dead time decreases at a rate determined by the disintegration constant of the measured nuclide. The total dead time is due to a fixed background and this fast decaying one, thus
where DBis the fixed background and Do is the initial total background. Wiernik and A n ~ i e l ~ ~ combined Equations 26 and 28 and obtained for one cycle of irradiation and measurement
where F is given by
Thus for n cycles, the total net count is given by
Volume I1
31
However, the assumption of Wiernik and Amie196of only one fast decaying nuclide is not true in many cases. Guinn and Miller9' used an oscillator/multiscalar circuit to measure and store the dead time of the analyzing system repeatedly during the very short counting period. Then the dead-time data are least squares fitted by a computer to the function
and then the integral in Equation 26 can be calculated analytically using these values of a, P, r, and 8. Egan et al.98found an exponential function to fit best the experimental data of the system dead time
Equation 33 is the same as Wiemik and Amiel's Equation 28 although k in Equation 33 is a fitting parameter where A in Equation 28 is the decay constant of the only fast-decay nuclide. WyttenbachWdiscussed the problem of pulse pile up (called also summing effects or coincidence losses) in the case of high count rates. He discussed the correction of the pileup effects by the use of a pulser with a known repetition rate which is fed into the preamplifier. The factor in which the pulser rate is decreased from the known value is the factor in which the photopeak area should be multiplied in order to compensate for the coincidence losses as was done by Anderslooand refined later by Bolotin et al.'O1 W y t t e n b a ~ hshowed ~~ that pile-up corrections can be done without a pulser by measuring the summing up constant of the system using the dead-time correction device of the multichannel analyzer. The losses due to coincidence are given by the equation,
where I, is the true photopeak count rate without coincidence losses as measured in low count rate conditions, I is the actual photopeak count rate, including pile up, as measured in high count rate experiments, N is the mean rate of pulses emitted by the detector, and the time constant T can be called the resolution time of the system.lo2 I, can be measured using a source of low strength. Adding to this another source, a strong one, with another gamma ray will reduce the measured activity, I of the first source due to pile up losses. Thus T can be found by plotting In (I&) vs. N or as W y t t e n b a ~ hsuggested ~~ by first approximation plotting U I , vs. N. HeWshowed another way to correct the coincidence losses by using the real time (clock time), T, and the live time of the measurement, t,
where 6 is another constant of the detection system. 7/acan be measured from plotting UI, vs. T/t and subsequently be used to correct other spectra. It should be remembered that actually T depends on the energy of the gamma measured.'02 This correction and similar others103are the easiest one to be used in cyclic activation where the count rate varies considerably with time. Egan et al.98 used constant frequency pulser for pile-up correction.
32
Activation Analysis
G . EXAMPLES OF USES OF CYCLIC ACTIVATION ANALYSIS WITH NUCLEARREACTORS There are numerous papers dealing with the use of cyclic activation analysis with nuclear reactors and we will give only a few of them to exemplify the uses. Wiernik and AmielIo4 used a nuclear reactor with a fast transfer pneumatic system using cyclic activation to determine ,07"Pb with 0.8-s half-life. Egan and Spyrou105did the same using two 7.5-cm x 7.5-cm NaI (TI) crystals operated in a modified sum-coincidence system. The sensitivity in an interference free matrix was found to be 5 pg. It should be pointed out that 207mPb is the only y emitter formed from lead by (n,y) reaction. Kerr and SpyrouIo6measured the fluorine content of bone and other biological materials by cyclic activation using the (n,y) ' F; tl,2 = 11 S. They corrected for reaction of the only stable isotope of fluorine I9F (n,y) O the interferences due to 23Na (n,a) O ' F by simultaneous measurement of 24Na and 23Ne photopeaks from which the Na content is obtained. They found sensitivity of 0.6 pg F in an interference-free matrix. In biological materials, they detected by activation analysis about ten other elements besides Na and F, such as Sc, Se, 0 , Br, Hf, C1, Rb, Mg, Cu, V, K, Mn, and Ca. Fluorine was actually the first element to be determined in cyclic activation analysis.75 De Silva and Chattso used cyclic activation analysis with manual transfer to determine 15 elements in National Bureau of Standards (NBS) reference standards of bovine liver and orchard leaves and other biological samples. They use t, = 30 s, t, = 10 s, t, = 30 s, t, = 140 s, and n = 4 for some samples while for others t, was changed to 10 s and determined Ag, Al, Br, Ca, CI, Cu, I, K, Mg, Mn, Na, Rb, S, Se, and V. The same group107used also a rapid transfer pneumatic cyclic system which allows detection of halflives as short as 0.8 s. They applied the system successfully for the determination of Ag, F, Hf, Rb, Pb, Sc, and Se in various biological and metallurgical matrices. The timing parameters were changed for the determination of the various elements due to their different half-lives (which vary over two orders of magnitude). For example, Ag, F, Rb, Sc, and Se determinations were done with the timing parameters 10, 2, 10, and 2 s for t,, t,, t,, and t,, respectively, with n = 12, while for Pb they used timing parameters of 3, 1, 3, and 1 s and n = 10. Ag, Rb, Sc, and Se could also be determined using long-lived isotopes of these elements. However, the use of the short-lived nuclides not only reduces the total experimental time but also improves the precision of the determination. Valente et al.'08 measured the detection limits for the platinum metals in vegetation for different neutron activation conditions. They found after dry ashing that rhodium and palladium are best determined by cyclic epithermal irradiation while long thermal activation are required for Os, Pt, Ir, and Ru.
IV. ACTIVATION ANALYSIS WITH PULSING REACTORS In the last chapter, we dealt with the improvement in activation analysis via short-lived radioisotopes by the use of cyclic activation analysis and in this chapter we discuss the use of pulsing reactors for the measurement of short-lived activation products. The activation with reactor pulses share some of the advantages of cyclic activation although it has some disadvantages. Both methods share the advantages of the reduction of the minimum detectable quantity for some elements in using short-lived nuclides and in some cases the use of shortlived activities provide the only capability to determine the element by the nuclear technique of neutron activation. Both methods share the advantage of obtaining fast results when an immediate determination is required while steady-state neuron activation with long-lived radionuclides required long decay time. However, the cyclic activation analysis also means a short use of the reactor so on a commercial basis, cyclic activation of short time is advantageous while pulsing activation analysis requires sole use of a reactor facility and pulses can be provided at the rate of only 4 to 8Ih depending on the facility. Besides cyclic activation can be done with every reactor while only few research reactors have the pulsing
Volume 11
33
choice. The uses of pulses have also the risk of fuel damage due to excessive thermal spikes during the pulses. The Triga reactors employ a zirconium hydride (ZrH, ,) alloyed, enriched uranium (-20%) in a stainless-steel cladding. This fuel has a strong prompt negative temperature reactivity coefficient which enables the insertion of large positive reactivity by the ejection of a control rod from the core with compressed air. The large increase in the reactivity results in a highly supercritical condition of the core and the power level of the reactor increases to about 300 to 1000 MW (the powers and the fluxes vary for the various types of the Triga reactors) in 25 ms. The increase in the power leads to an increase in the temperature which, due to the high negative reactivity coefficient, results in lowering of the reactivity until the reactor becomes subcritical and the neutron flux decreases to its level of steady-state operation. For the Triga Mark I reactor, the operation in steady state yields power level of 250 kW with neutron flux of about lOI3 n cmP2s-I. The Gaussian pulse has a full width at half maximum (FWHM) of 15 ms and the neutron flux reaches a maximum of about 4.5 1016 n cm-2 s- I . The neutron flux integrated over the pulse is about 7.2 1014 n cm-'. For Triga Mark 11, the steady-state 100-kW supply neutron flux of 1.3 loi2 n cm-2 s- I. The 300-MW pulse gives 1.6 lOI5 n . cm-2 s-I. The pulse can be started only from very low power, 500 to 100 W and between two pulses, the reactor should be cooled and brought to the low level again, a process which takes 8 to 15 min. Guinn and colleaguesio9were the first to recognize and demonstrate the activation analysis with reactor pulsing. The maximum obtainable activity of a radioisotope prepared by steady-state operation is given by N, a where is the steady-state flux while the activity obtained by the pulse is given approximately (neglecting the decay during the pulse) by N, cr 0.693/t1,, where is the neutron flux integrated over the pulse and t ,,,is the half-life of the produce radionuclide. Thus the advantage of the pulse irradiation is given by 0.693 . t1,2 +INT/+,, is about 70 and hence the advantage of the pulsing activation is approximately 50/t,,, which means that activation with pulsing reactor is advantageous for radionuclides with half-lives shorter than 50 s. The samples activated with the reactor's pulse have very high rate of photon emission due to the high activity of the very short-lived radionuclides, e.g., 0.70 s 38mCl.WestphalliOdeveloped considerably the loss-free counting of highly active samples although there is a small increase in the noise and he used it for very short-lived isotopes of 20 ms (24mNa,12B)to 800 ms (38C1, 'O7'"Pb). has evaluated pulse neutron activation analysis for various systems, e.g., Na and B in glasses, Al, C1, In, and Na in dust, or also F, V, Cu, Mn, Sc, and Br in other dust samples. He also studied the use of pulse activation for ore studies, either geological or ore standards, for B determination in water and coals. The elements detected by him were U (by delayed neutrons), Au, Se, Sc, Br, Hf, Na, Pb, C1, Al, Dy, Mn, V, F, Mg, Ag, Ti, Cu, and Ca. Miller and Guinn1I4developed a system to follow the rapidly changing spectrometer dead time. They measured 207mPb (0.8 S) and 20F(11.0s). Guinn and Miller9' studied 12 elements which produced very short-lived elements (half-lives in the range of 0.3 to 18.7 s). Three elements F, C1, and S produce the short-lived activity by (n,y) reaction and naturally were found to have higher sensitivity for activation with a bare reactor. Four elements (S, Br, Y, Zr) produce the short-lived activity by the emission of a particle, (n,p) and (n,nl) reactions, and are detected best in the Cd-lined core position. In the case of five elements (Ge, Se, Ba, W, and Pb), the activity is produced both by (n,y) reaction and either (n,nf) or (n, 2n) reaction. For the first two due to the dominance of the (n,y) reaction, the bare irradiations were found to give better sensitivity while for the last three elements, bare and Cd-lined positions give the same results. Guinn and Miller9' analyzed two NBS standards with a pulsing reactor. In orchard leaves standard, they detected Pb, C1, Se, and Br and in the bovine liver standard, they detected C1 and Se. Millerii5studied the timing characteristics of reactor pulses as a function of the energy pulse. He used Triga Mark I reactor which can
.
-
-
.
.
.
- +,,
+,,
-
. -
+,,
. - +,
34
Activation Analysis
be pulsed up to a peak power of 1000 MW. By regulating the amount of inserted reactivity, he produced pulses ranging in peak power level from about 250 to 1000 MW. He found that the time between firing of the transient control rods and reaching the peak power level and also the FWHM of the power pulse is very reproducible ( ? 1 ms) for a given size pulse, but they vary with the pulse size, being longer for smaller pulse size. For example, the FWHM was found to be 12 ms for 1000 MW and 23 ms for 250 MW. This meansthat for a 1000-MW pulse, the fluence of neutrons is not four times that of a 250-MW pulse, but only double that of the 250-MW pulse. The time from the firing of the control rods to the power pulse peak is 245 ms for a 1000-MW pulse and 280 ms for a 485-MW pulse, so Miller suggested that the sample will remain in the irradiation position 400 ms following the initiation of the pulse. Although the pulses are nearly Gaussian, they also have tails with power level below 2 MW. With 400-ms irradiation time, there are 80 to 135 ms of tail irradiation and this contributes about 2% of the sample activity. Miller97studied the reproducibility of the activity induced in Ag ('08Ag, 2.42 min) and in Ce ('39"Ce, 56.5 min) and found them to be -+ 2% for pulses of a given size. For pulses of varying size, the normalized sample activity was constant to only 7 to 10%. James and Oyedele1I6 studied also the dependence of the FWHM and the time to peak power on the peak power from 100 to 1000 MW and found similar results to those of Miller (the FWHM changes from 12.8 to 43 ms when the pulse peak energy varies between 990 and 100 MW). They found that the shape of the pulse is markedly altered by changing its size; the tail becomes much more significant for small peak power. Consequently it can be expected that small random timing uncertainties will be acceptable for large reactor pulses but may introduce significant error using small pulses. They found that the best reproducibility was found for activation using large pulses. James117emphasized that the use of the pulsing mode of the reactor is more expensive and time consuming than using the steady-state alternative and expressed the opinion that the use of pulsing reactor is justified only for special cases where no other method is available with the required sensitivities. He pointed out that one of the advantages of activation analysis with short-lived isotopes is the short turnaround times and consequently the large throughput of analyses. However, using pulsing activation analysis requires sole use of a reactor facility and pulses can be provided at the rate of only about four per hour. Therefore, the actual cost of analysis is much greater than steady-state NAA. James"' studied the peaks observed on reactor pulsing activation of standard reference materials and other samples of interest important to the fields of environmental science, nutrition and medicine, ecology, and energy. The spectra accumulated for 5 s after a 0 . 5 s delay is usually dominated by the 670-ke y line from 38mClwith few other small peaks visible. In the spectra accumulated for 50 s after 5.5 s of delay, several elements are detectable depending on the type of sample under study. An element which was found in all samples studied is 77mSe.This is specially important in the case of nutrition. This method of analysis detects Se in swine feeds where earlier attempts to analyze it by steady-state activation were unsuccessful. They found lower limit of detection of 0.05 p,g in 1-g botanical sample (50 ppb). Determination of very short-lived nuclides (<1 s) was difficult or impossible except for 38"Cl, due to a spectral background contributed by this nuclide (t,,, = 700 ms). 2WmPb(tl,,= 800 ms) was found to be determined at no less than 20-pg quantities. James suggested that the determination of selenium in complex matrices offer a particularly significant advantage.
TABLE FOR IDENTIFICATION OF NUCLIDES FORMED IN NUCLEAR REACTORS Energy (keV)(%)
Nuclide
Half-life
9.3(8) 24(16) 26(2.l) 26(1)
Kr 83m Sn 119m Sm 155 Sn 125
1.83 h 293 d 22.4 min 9.64 d
27(16.4) 27(4) 29(1) 35(6.8) 35(6.8) 35(5.8) 37(40) 4O(7.5) 4l(l.3) a(5.6) 45(2.3) 46(1.5)
Te 129 Eu 155 Th 233 Te 125m 1 125 Sb 125 Br 8Om Xe 129m Mo 99 U 239 Eu 155 Hf 179m
69.6 min 4.96 year 22.3 min 57.4 d 60.14 d 2.77 year 4.42 h 8.89 d 66.0 h 23.5 min 4.96 year 18.7 s
51(57) 53(1) 53(2) 55(5.9) 57(l 1.1) 57(3.7)
Rh 104m Pt 197m Ba 133 Xe 125 Ce 143 Gd 161
4.4 min 94.4 h 10.5 year 16.8 h 33.0 h 3.6 min
57(2.5) 58(4) 58(2) 58(48) sg(l.2) 58.q99.8)
Tb 161 Dy 159 Gd 159 Hf 180m Xe 127 Co 60m
6.90 d 144.4 d 18.56 h 5.5 h 36.4 d 10.5 min
Prob. of formation
Other peaks(keV)(%)
36
Activation Analysis
W W W W W W W W W
888%%288%
2 0? 009 C0 " 0l ?0" ?0* 0 0
128.6 d 27.0 d 22.3 min 72.1 d 4.96 year 13.43 h 3.68 h 2.42 h 96 min 70.0 d 10.98 d 18.6 min 6.5 h 5.5 h 32.0 d 2.35 h 3.9 min 120 d 2.8 d 241.6 d 4.02 d 4.4 min 114.4 d 28 h 3.6 min 30 h
105(22.4) Eu 155
57.3 min 46.75 h 241.6 d 22.4 min 4.96 year
0.125E+ 1
27(4)
45(2.3)
61(1.8)
87(32)
TABLE FOR IDENTIFICATION OF NUCLIDES FORMED IN NUCLEAR REACTORS (Continued) Energy (keV)(%)
Nuclide
Half-life 28 h 18.6 min 2.335 d 14.5 min 1.3 min 27.1 s 32.0 d 7.5 h 171 d 6.71 d 160.1 d 1.73 h 4.2 d 12.4 min 7.5 h 18.7 s 32.0 d 120 d 9.3 h 1.9 h 2.4 min 3.9 h 90.64 h 11.5 d
Prob. of formation
Other peaks(keV)(%)
7.5 h 70 s 14.6 min 50 s 2.9 h 14.2 min 2.8 d 160.1 d 4.02 d 4.4 h 45 s 1.68 n i n 32.0 d 42.4 d 23.8 h 23.8 h 11.5 d 120 d 42.4 d 90.64 h 42.4 d 54 min 30.0 h 12.4 rnin 1.9 h 47 s 22.4 min 6.0 h 18.7 s 3.9 h
TABLE FOR IDENTIFICATION OF NUCLIDES FORMED IN NUCLEAR REACTORS (Continued) Energy (keV)(%)
Nuclide
Half-life 32.50 d 36.4 d 16 min 25 min 1.9 h 30 h
15l(76) Kr 85m 151(11.6) Sr 85m 151(30) Cd l l l m 152(7.1) Ta 182
4.48 h 67.7 min 49 min 114.4 d
1.3 min 16.98 h 18.6 min 1.73 h 43.1 min 13.6 d 42.6 min 3.139 d 119.7 d 3.35 d 1.94 h 40.1 min 53 s 18.7 s
Prob. of formation
Other peaks(keV)(%)
Xe 131m Gd 161
11.9 d 3.6 min
Ba 139 Ce 139 Pm 151 Nd 151
83.06 min 137.6 d 28 h 12.4 min
Pd l l l m
5.5 h
Ta 182m Xe 127 Pt 191
16 min 36.4 d 2.8 d
Xe 127m W 185m Nd 151
70 s 1.68 min 12.4 min
Sb 125 Yb 169 Pm 151 Ta 182
2.77 year 32.0 d 28 h 114.4 d 2.8 d 66.0 h 3.6 min 8.1 h 14.2 min 16 min 30.8 min 9.9 min 16.8 h 4.69 min 13.3 s 49.5 d
TABLE FOR IDENTIFICATION OF NUCLIDES FORMED IN NUCLEAR REACTORS (Continued) Energy (keV)(%)
Nuclide
Half-life
191(5.7) 192(25)
Pt 197 Mo101
18.3 h 14.6 min
192(2.8) 192(2.6)
Fe 59 Ft' 199
45.1 d 30.8 min
193(3.9)
Hf 179m
18.7 s
197(3.3) 197(97) 197(6.5)
Xe 1291x1 8.89 d 019 27.1 s Tb160 72.1 d
198(40) 198(1.4)
Yb 169 Se 75
201(7.1)
Te 1311x1 30 h
202(2.6)
Hf 179m
18.7 s
203(96.5) 203(58.2) 204(1.9) 204(14.6)
Y 90m Xe 127 Hg 205 Lu 177m
3.19 h 36.4 d 5.2 min 160.1 d
206(3.3)
Ir 192
74.0 d
208(62)
Lu 1771x1 160.1 d
2O8(ll) 208(2.6)
Nd 149
Lu 177
32.0 d 120 d
6.71 d 1.73 h
Prob. of formation
Other peaks(keV)(%)
Au199 Pd 107m Np 239 Nd149
3.139d 21.3 s 2.335 d 1.73h
Ge77
11.3h
Er 171 Te 121m Ru97 Hf180m Ge 77m Hf 179m
7.5 h 154d 2.9d 5.5h 53 s 18.7 s
Ba 131
11.5d
Ge77
11.3h
Tb160
72.ld
Kr 79
34.9 h
Br 82
35.34 h
Ta 182
114.4 d
Se 8 3
22.4 min
Lu 177m
160.1 d
Np 239 Ta 182
2.335 d 114.4 d
Sr 85m Ce 143 Xe 133111 As 77 Ba 131
67.7 min 33.0 h 2.19 d 38.8 h 11.5 d
TABLE FOR IDENTIFICATION OF NUCLIDES FORMED IN NUCLEAR REACTORS (Continued) Energy (keV)(%)
Nuclide
Half-life
NO(3.8)
Nd 149
1.73 h
240(3.4) 241(8.4)
Pm 151 Te 131m
28 h 30 h
243(29) 245(94) 246(4.3) W(3.2)
Xe 125 Cd l l l m Sm 155 Ba 131
16.8 h 49 min 22.4 min 11.5 d
250(92) 254(1.3)
Xe 135 Zr 97
9.10 h 16.8 h
255(ll) 255(2.l) 256(11.6)
Ce 137m Sn 113 Nd 151
34.4 h 115.1 d 12.4 min
259(2)
Gd 161
3.6 min
26l(ll)
Kr 79
34.9 h
261(1.8) 261(2.6)
Cd 115 Hf 179m
53.38 h 18.7 s
263(61) 263(6.6)
Mo 93m Ru 105
6.9 h 4.4 h
264(50)
Ge 77
11.3 h
264(3.8)
Ta 182
114.4 d
Prob. of formation
Other peaks(keV)(%)
83 min 120 d 30.8 min 28.7 h 1.73 h 2.8 d 1.73 h 3.6 min 18.7 s 2.42 h 10.98 d 28 h 38.9 h 10.5 year 2.335 d 46.59 d 23.8 h 94.4 h 120 d 18.7 s 30.0 h 160.1 d 4.2 d 3.6 min 8.02 d 53.1 h
TABLE FOR IDENTIFICATION OF NUCLIDES FORMED IN NUCLEAR REACTORS (Continued) Energy (keV)(%)
Nuclide
Half-life
bob.of formation
Ir 192
33.0h 19.15h 7.5h 74.0d
O.lO5E+ 0 0.690E+2 0.849E+O 0.344E+ 3
299(35)
Tb 160
72.1d
O.255E+ 2
3OO(l.3)
Kr 79
34.9h
0.164E-1
27.0d 10.5year 120 d
0.704E+ 1 0.856E- 2 O.466E+ 0
293(46.5) 294(2.9) 2%(28) 296(29.2)
Ce 143 Ir 194 Er 171
300(6.6) Pa 233 303(19.6) Ba 133 304(l.3) Se 75
Kr 85m 4.48h 305(14) 306(5.4) Rh 105 35.5h 307(24.3) Hf 179111 18.7s
0.513E-1 0.878E- 1 O.143E+ 2
Kr 79
34.9h
0.164E- 1
Tc 101 307(91) 308(63) Er 171 308(30.6) Ir 192
14.2min 7.5h 74.0d
0.191E-1 O.849E+ 0 0.344E+3
308(10) 312(38) 3l5(25)
32.0d 27.0d 3.6min
0.451E+1 O.740E+ 1 O.168E+ 0
307(2)
Yb 169 Pa 233
Gd 161
In 117111 1.94h 315(15) 316(85.8) Ir 192 74.0d
0.321E-2 0.344E+3
Np 239
O.268E+ 1
316(1.4)
2.335d
Other waks(keV)(%)
Pt 199
30.8 min
Ru 105
4.4 h
Ta 182m Nd 147 Hf 175 Rh 105 Ti 51 Ir192
16 min 10.98 d 70.0 d 35.5 h 5.8 min 74.0d
0 s 193 Ru97 Irl94min
30.0 h 2.9d 171d
Dy 157 Nd 149
8.1 h 1.73 h
Lu 177min 160.1 d
Ir 194 Ir l94min
19.15 h 171 d
La 140
40.27 h
Sn 125min 9.5 rnin Hf 180min 5.5 h Sn 125 9.64d
Mo 101
14.6 min
2.335 d Np 239 Te 13lmin 30 h In ll5min 4.49 h Irl94min 171d Pm151
28h
TABLE FOR IDENTIFICATION OF NUCLIDES FORMED IN NUCLEAR REACTORS (Continued) Energy (keV)(%)
Nuclide
341(4.4) 342(4.6) 344(85) 344(17)
Pa 233 Ag 111 Hf 175 Cd 117
d d d h
O.74OE + 1 0.234E - 2 O.624E + 0 0.381E-2
344(2.5) LM(8.6)
Eu 1521112 9.3 h Cd 117111 3.31 h
O.157E + 4 0.600E - 3
346(ll) 346(12) 351(3.2) 351(3.3)
Pt 1971x1 Hf 181 Ce 143 Pt 191
94.4 h 42.4 d 33.0 h 2.8 d
0.126E- 1 O.443E + 1 0.105E+O 0.150E- 1
356(75)
Se 83
22.4 min
0.425E - 2
356(67) 357(20)
Ba 133 Se 83x11
10.5 year 69 s
O.856E- 2 O.366E - 2
360(66)
Gd 161
3.6 min
0.168E+O
360(5.9)
Pt 191
2.8 d
0.150E-1
361(94) 362(3.6) 362(l. 1) XA(ll.2) 364(82.4) 366(1.3) 367(4.8) 367(14)
0 s 1Wm Dy 165m Dy 165 Gd 159 1131 Mo 99 Ni 65 Ge 77
9.9 min 1.3 min 2.35 h 18.56 h 8.02 d 66.0 h 2.52 h 11.3 h
O.42OE -4 O.479E + 3 0.761E+3 0.621E+O O.98OE - 1 0.313E- 1 0.135E- 1 O.lO9E - 1
Half-life 27.0 7.45 70.0 2.42
Prob. of formation
Other peaks(keV)(%)
11.5 d 42.6 min 74.0 d 36.4 d 160.1 d 10.5 year 3.9 h 30.0 h 2.81 h 34.9 h 2.4 min 3.9 h 5.5 h 171 d 115.1 d 13.6 s 4.4 h 4.2 d 34.9 h
27.0 d 120 d 76.3 min 11.5 d 2.8 d 2.69 d
TABLE FOR IDENTIFICATION OF NUCLIDES FORMED IN NUCLEAR REACTORS (Continued) Energy (keV)(%)
Nuclide
413(1.8)
Pd l l l m
5.5 h
414(17)
Lu 177111
160.1 d
415(1.3)
Pd l l l m
5.5 h
4 16(24)
Ge 77
11.3 h
416(1.7) 417(30) 419(21)
Pa 233 In 116m Lu 177111
27.0 d 54 min 160.1 d
424(7)
Nd 149
1.73 h
426(5.6)
Nd 151
12.4 rnin
428(29.6) 433(1.4) 433(3.1)
Sh 125 Hf 175 La 140
2.77 year 70.0 d 40.27 h
434(10)
Cd 117
2.42 h
439(33) MO(1.2) 443(17.5) 443(80) 446(3.7) 446(2.3) 452(18) 454(4.3) 455(33)
Ne 23 Nd 147 1 128 Hf 180111 Pm 151 Ce 137 Te 131 Xe 125 Xe 137
37.2 s 10.98 d 25 min 5.5 h 28 h 9.0 h 25 min 16.8 h 3.83 min
Half-life
b o b . of formation
Other peaks(keV)(%)
TABLE FOR IDENTIFICATION OF NUCLIDES FORMED IN NUCLEAR REACTORS (Continued) Energy (keV)(%)
Nuclide
493(5.1) Wt(6.2)
Te 131 F't 199
25 min 30.8 min
0.980E - 1 0.2688 0
496(41 .3)
Ba 131
11.5 d
O.l43E - 1
497(90) 498(19.7) 499(2.3)
Ru 103 Sb 124m Ru 105
39.35 d 1.6 min 4.4 h
0.411E+O 0.196E- 1 0.878E- 1
501(17) 503(98) 506(15)
Hf 180m 0 s 1% Mo 101
5.5 h 9.9 min 14.6 min
0.467E- 1 O.42OE -4 0.191E- 1
508(19.4) 508(5)
Te 121 Zr 97
16.8 d 16.8 h
O.225E - 2 O.47OE - 3
511(15)
Kr 79
34.9 h
O.164E- 1
511(5) 511(28.4)
Br 80 Zn 71m
17.6 min 3.9 h
0.563E+ I 0.5208- 4
512(14) 5 l2(45)
Zn 71 Se 83
2.4 min 22.4 min
O.55OE - 3 O.425E- 2
514(99.3) 516(11.7) 527(80) 527(1.7) 528(27.5) 53O(l.4) 530(2)
Sr 85 Dy 165m Xe 135m I 128 Cd 115 Br 83 Gd 161
64.9 d 1.3 min 15.3 min 25 min 53.38 h 2.4 h 3.6 min
O.454E - 2 O.479E+ 3 0.312E-3 O.62OE 1 0.965E- 1 0.425E - 2 0.168E+O
Half-life
Prob. of formation
+
+
Other peaks(keV)(%) 602(4.8) 192(2.6) 968(1.2) 216(21) 1048(1.5)
654(1.5) 265(2.6)
949(2.2) 317(5.6)
240(2.4)
249(3.2)
14.2 min 10.98 d 2.8 d 1.73 h 30.8 min 14.2 min 2.35 h 23.8 h 43.1 min 35.34 h 26.4 h 1.02 min 42 s 30.0 h 49.5 d 11.3 h 26.4 h 171 d 2.06 year 26.4 h 2.70 d 3.31 h 2.06 year 573(79) 575(3.4)
Te 121 Pd l l l m
16.8 d 5.5 h 23.4 min 74.0 d
TABLE FOR IDENTIFICATION OF NUCLIDES FORMED IN NUCLEAR REACTORS (Continued) Nuclide
Half-life
Mo 101
14.6 min
0 s 185 Zn 71m
94 d 3.9 h
Sb 125 Ir 194m
2.77 year 171 d
Ga 72
14.1 h
zr 97
16.8 h
Te 131 Sb 124
25 min 60.3 d
Sb 124m 1r 192
1.6 min 74.0 d
Cs 134
2.06 year
Kr 79
34.9 h
Sb 125 Ti 51 Xe 135 Ru 103 Ir 192
2.77 year 5.8 min 9.10 h 39.35 d 74.0 d
0 s 190m Br 80 W 187
9.9 min 17.6 min 23.8 h
Prob. of formation
Other peaks(keV)(%)
35.34 h 3.9 h 11.5 d 2.8 d 23.8 h 14.1 h 11.3 h 633(1.7) 633(1.9) 633(3.4)
Ag 108 Re 188 Pd l l l m
2.41 min 16.98 h 5.5 h 2.77 year 8.02 d 19.15 h 1.6 min 94 d 60.3 d 25 min 1.73 h 26.4 h 249.9 d 24.6 s 2.55 min 33.0 h 17.6 min 2.77 year 76.3 min 2.69 d 4.4 h
TABLE FOR IDENTIFICATION OF NUCLIDES FORMED IN NUCLEAR REACTORS (Continued) Energy (keV)(%)
Nuclide
Half-life
Se 83m
69 s
Ag llOm
249.9 d
Mo 93m W 187 Ag llOm
6.9 h 23.8 h 249.9 d
Ir 194m
171 d
Sb 122 Pd l l l m
2.70 d 5.5 h
Te 129m Mo 101
33.6 d 14.6 min
Br 82
35.34 h
Ag llOm
249.9 d
Sb 124
60.3 d
Sb 124
60.3 d
F't 199
30.8 min
Ge 77
11.3 h
0 s 185 Se 83
94 d 22.4 min
Prob. of formation
Other peaks(keV)(%)
33.0 h 8.02 d 60.3 d 64.0 d 4.4 h 49.5 d 12.4 min 66.0 h 53 s 16.8 h 249.9 d 40.27 h 3.9 h 56.5 s 64.0 d 249.9 d 34.97 d 23.8 h 30 h 35.34 h 66.0 h 30.8 rnin 30 h 2.06 year 12.4 min
TABLE FOR IDENTIFICATION OF NUCLIDES FORMED IN NUCLEAR REACTORS (Continued) Energy (keV)(%)
Nuclide
Half-life 22.4 min
2.06 year
54 min 30 h
22.4 min 9.3 h 9.46 min 76.3 min 2.58 h 16.8 h 30 h
Prob. of formation
3.31 h
22.4 min 94 d 4.4 h 72.1 d 94 d 2.42 h 249.9 d 22.4 min 83.82 d 14.1 h 17.8 min 2.4 min 9.64 d 40.27 h 40.27 h 5.8 min 16.98 h 44.8 d 249.9 d 25 min 9.3 h 3.9 h 72.1 d
60
Activation Analysis
1051(4.6)
Cd117
2.42 h
1051(7.2)
Ga 72
14.1 h
1051(7.3)
Cd l l 7 m
3.31 h
1063(5)
Se 83m
69 s
1065(14)
Cd 1l7m
3.31 h
1067(9)
Sn 125
9.64 d
1079(8.8) 1080(4.7) 1085(6.4)
Rb 86 Yb 177 Ge 77
18.7 d 1.9 h 11.3 h
1087(1)
Sn 125
9.64 d
1089(4.2)
Sn 125
9.64 d
1097(53) 1099(56) 1102(2.7) 1115(15.2) 1115(2.2)
In l l 6 m Fe'59 Te 121m Ni 65 Tb 160
54 rnin 45.1 d 154 d 2.52 h 72.1 d
1116(1)
Pd 1l l m
5.5 h
1116(1)
Se 83m
69 s
1121(37)
Ta182
114.4 d
1121(100) Sc 46 1123(2) Nd151
83.82 d 12.4 rnin
1126(14.8) Te 131m
30 h
1147(5.7)
25 rnin
Te 131
TABLE FOR IDENTIFICATION OF NUCLIDES FORMED IN NUCLEAR REACTORS (Continued) Energy (keV)(%)
Nuclide
Half-life 16.8 h 2.06 year 5.272 year 76.3 min 72.1 d 12.4 rnin 114.4 d 11.3 h 72.1 d 30 h
26.4 h 26.4 h 114.4 d 26.4 h 114.4 d 3.31 h 1.9 h
72.1 d 16.8 h
h o b . of formation
Other peaks(keV)(%)
45.1 d 54 min 14 s 1.83 h 4.54 d 22.4 min 2.42 h 72.1 d 9.3 h 35.34 h 60.3 d 5.272 year 3.31 h 16.8 h 2.06 year 14.96 h 60.3 d 27.1 s 26.80 h 249.9 d 9.3 h 3.31 h 3.75 min 27.1 s 35.34 h 249.9 d
TABLE FOR IDENTIFICATION OF NUCLIDES FORMED IN NUCLEAR - REACTORS (Continued) --
Energy (keV)(%)
Nuclide
Half-life
1477(99.4) Mo 93m
6.9 h
1482(25.4) Ni 65 1505(14) Ag llOm
2.52 h 249.9 d
1508(7) In ll6m 1525(17.9) K 42 1533(11) Mo 101
54 min 12.36 h 14.6 min
1562(2.7)
Cd 117
2.42 h
1563(1.2)
Se 83m
69 s
1576(3.7) F'I 142 1576(14.3) Cd 117
19.13 h 2.42 h
La 140
40.27 h
1596(96)
1597(4.4) Ga 72
14.1 h
1633(100) F 20 1642(32.8) C1 38 1664(2.8) Se 83m
11.0 s 37.18 min 69 s
1674(3)
Mo101
14.6 min
1691(50)
Sb 124
60.3 d
1691(1)
Pd l l l m
5.5 h
1722(2.7)
Cd 117
2.42 h
Prob. of formation
-
Other peaks(keV)(%)
76.3 min 16.8 h 54 min 2.246 min 2.58 h 17.8 min 14.1 h 3.31 h 9.64 d 76.3 min 69 s 60.3 d
3.31 h 54 min 2.58 h 37.18 min 14.1 h 22.4 min 3.31 h 14.1 h 14.1 h 40.27 h
2558(4.3)
Kr 87
2.58 h 76.3 min 76.3 min
0.103E - 1
403(48)
674(1.8)
846(7.2)
1 176(1)
1740(2)
2012(2.9)
2555(8.7)
TABLE FOR IDENTIFICATION OF NUCLIDES FORMED IN NUCLEAR REACTORS (Continued) Energy (keV)(%) 2676(2.1) 2754 (99.85) 3084(91.7) 3102(90) 4072(7)
Nuclide
Half-life
Prob. of formation
Other peaks(keV)(%)
Rb 88 Na 24
17.8 min 14.96 h
0.339E- 1 0.130E+O
898(14.5) 1368(100)
Ca 49 S 37 Ca 49
8.72 min 5.0 min 8.72 min
O.206E- 2 0.300E-4 O.2O6E- 2
4072(7) 3084(91.7)
1836(21.4)
Volume 11
67
REFERENCES 1. Sun, L. Y., Conrady, M. R., and Schmitt, R. A., Instrumental neutron activation analysis of Na in biological materials, J . Radioanal. Nucl. Chem., 81, 323, 1984. 2. Foster, A. R. and Wright, R. L., Basic Nuclear Engineering. Allyn and Bacon, Boston, 1982, 247. 3. van der Linde, R., De Corte, F., Van den Winkel, P., and Hoste, J., A compilation of infinite dilution resonance integrals I, J . Radioanal. Chem., 11, 133, 1972. 4. Van der Linden, R., De Corte, F., and Hoste, J., A compilation of infinite dilution resonance integrals 11, J . Radioanal. Chem., 20, 695, 1974. 5. Gryntakis, E. M. and Kim, J. I., A compilation of resonance integrals, J . Radioanal. Chem., 29, 175, 1976; Gryntakis, E. M. and Kim, J. I., A compilation of resonance integrals from hydrogen to fermium, J. Radioanal. Chem., 76, 341, 1983. 6. Sher, R. and Albinson, H., in Handbook of Nuclear Activation Cross Sections, IAEA, Technical Reports Series No. 156, International Atomic Energy Agency, Vienna, 1974. 7. Hogdahl, 0. T., Neutron absorption in pile neutron activation analysis. Determination of copper and gold in silver, Proc. IAEA Symp. Radiochemical Methods of Analysis, International Atomic Energy Agency, Vienna 1962, 23. 8. Steinnes, E., Epithermal neutron activation analysis of geological material, in Activation Analysis in Geochemistry and Cosmochemistry. Brunfelt, A. D . and Steinnes, E., Eds., Universitetsforlagt. Oslo, 1971, 113. 9. Brune, D. and Jirlow, K., Optimization in activation analysis by means of epithermal neutrons. Determination of molybdenum in steel, Nukleonik, 6 , 242, 1964. 10. Alfassi, Z. B., Epithermal neutron activation analysis, J. Radionnal. Nucl. Chem. Art., 90, 151, 1985. 11. Gladney, E. S., Perrin, D. R., Balagna, J. P., and Warner, C. L., Evaluation of a boron-filtered epithermal neutron irradiation facility, Anal. Chem., 52, 2128, 1980. 12. Hanna, A. G. and Al-Shahristani, H., Resonance activation analysis of biological materials, J. Radioanal. Chem., 37, 581, 1977. 13. Randa, Z., Analytical possibilities of epithermal neutron activation on routine INAA of mineral materials, Radiochem. Radioanal. Lett., 24, 157, 1976. 14. Kucera, J., Epithermal neutron activation analysis of trace elements in biological materials, Radiochem. Radioanal. Lett., 38, 229, 1979. 15. Cesana, A., Rossitto, F., and Terrani, M., On the resonance activation analysis of biological materials, J . Radioanal. Chem., 45, 199, 1978. 16. Parry, S. J., Epithermal neutron activation analysis of short-lived nuclides in geological material, J . Radioanal. Chem., 72, 195, 1982; Parry, S. J., Evaluation of boron for the epithermal neutron activation analysis of short-lived radionuclides in geological and biological matrices, J . Radioanal. Nucl. Chem. Art., 81. 143, 1984. 17. Parry, S. J., Detection limits in epithermal neutron activation analysis of geological materials, J . Radioanal. Chem., 59, 423, 1980. 18. Currie, L. A., Limits for qualitative detection and quantitative determination. Application to Radiochemistry, Anal. Chem., 40, 587, 1968. 19. Bem, H. and Ryan, D. E., Choice of boron shield in epithermal neutron determinations, Anal. Chim. Acta. 124, 373, 1981. 20. Tian, W.-2. and Ehmann, W. D., Observations relative to epithermal and fast neutrons in INAA, J . Radioanal. Nucl. Chem. Art., 84, 89, 1984; Tian, W.-Z., Epithermal neutron activation analysis. Some comments, J . Radioanal. Nucl. Chem. Lett., 103, 225, 1986. 21. Rossitto, F., Terrani, M., and Terrani, S., Choice of neutron filters in activation analysis, Nucl. Insrr. Methods. 103, 77, 1972. 22. Williamson, T. G., Benneche, P. E., Hostica, B., Brenizer, J. S., and Nguyen, T. L., Characterization of an epithermal irradiation facility, J . Radioanal. Nucl. Chem. Art., 114, 387, 1987. 23. Tokay, R. K., Skalberg, M., and Skarnemak, G., A technique for reducing interferences in epithermal neutron activation analysis, J . Radioanal. Nucl. Chem. Lett., 96, 265, 1985. 24. Rosenberg, R. J., A simple method for the determination of uranium and thorium by delayed neutron counting, J . Radioanal. Chem., 62, 145, 1981. 25. Holzbecher, J., Chatt, A., and Ryan, D. E., Slowpoke Epicadmium neutron flux in activation analysis of trace elements, Can. J . Spectrosc., 30, 67, 1985. 26. Stroube, W. B., Jr., Cunningham, W. C., and Lutz, G. J., Analysis of foods for iodine by epithermal neutron activation analysis, J. Radioanal. Nucl. Chem. Art., 112, 341, 1987. 27. Glascock, M. D., Tian, W.-Z., and Ehmann, W. D., Utilization of a boron irradiation vessel for NAA of short-lived radionuclides in biological and geological materials, J. Radioanal. Nucl. Chem., 92, 379, 1985.
68
Activation Analysis 28. Ehmann, W. D., Briickner, J., and McKown, D. M., Epithermal neutron activation analysis using a boron carbide irradiation filter, J. Radioanal. Chem., 57, 491, 1980. 29. Stuart, D. C. and Ryan, D. E., Epithermal neutron activation analysis with a SLOWPOKE nuclear reactor, Can. J . Chem., 59, 1470, 1981. 30. Soreq, H. and Griffin, H. C., Fast neutron activation analysis of silicon in aluminium alloys, J. Radioanal. Chem., 79, 135, 1983. 31. Chisela, F., Gawlik, D., and Bratter, P., Advantages of boron filters in instrumental epithermal neutron activation analysis of biological materials, J . Radioanal. Nucl. Chem. Art., 112, 293, 1987. 32. Elnimr, T. and Ela-Assaly, F. M., Determination of the attenuation of epicadmium neutrons using the method of varying Cd-thickness, J. Radioanal. Nucl. Chem. Art., 109, 3, 1987; Powell, J. E. and Walker, J. V., A determination of the cadmium absorption of resonance neutrons in cadmium-covered indium foils, Nucl. Sci. Eng., 20, 476, 1964. 33. Chisela, F., Gawlik, D., and Bratter, P., Some problems associated with the use of boron carbide filters for reactor epithermal neutron activation analysis, J . Radioanal. Nucl. Chem. Art., 98, 133, 1986. 34. Gladney, E. S. and Perrin, D. R., Determination of bromine in biological, soil and geological standard reference materials by instrumental epithermal neutron activation, Anal. Chem., 51, 2015, 1979. 35. Sato, T. and Kato, T., Estimates of iodine in biological materials by epithermal neutron activation analysis, J . Radioanal. Chem., 68, 175, 1982. 36. Gladney, E. S., Sedlacek, W. A., and Berg, W. W., Comparative determination of bromine and iodine in three air sampling media via instrumental thermal and epithermal neutron activation analysis, J . Radioanal. Chem., 78, 213, 1983. 37. Wyttenbach, A., Tobler, L., and Furrer, V., Simultaneous determination of the halogens C1, Bi, I in biological materials with epithermal neutron activation; results and comparison with conventional methods, in Instrumentelle Multielementanalyse, Sansoni, B . , Ed., VCH Publishers, Weinheim, West Germany, 1985. 38. Alfassi, Z. B. and Lavi, N., The determination of iodine in biological samples by epithermal neutron activation analysis, Radiochem. Radioanal. Lett.. 53, 173, 1982; Alfassi, Z. B. and Lavi, N., Determination of bromine in blood serum by epithermal neutron activation analysis, Anal. Chem., 55, 796, 1983; Lavi, N. and Alfassi, Z. B., Rapid determination of halogens in blood serum by instrumental neutron activation analysis, Analyst, 109, 361, 1984; Alfassi, 2. B. and Lavi, N., Rapid determination of halogens in milk by instrumental neutron activation analysis, J . Radiochem. Nucl. Chem. Art., 90, 395, 1985; Etzion, Z., Alfassi, Z., Lavi, N., and Yagil, R., Halide concentrations in camel plasma in various states of hydration, reference materials by instrumental neutron activation. Application to the IAEA horse kidney, Fresenius Z. Anal. Chem., 326, 730, 1987. 39. Al-Shahristani, H. and Abbas, K., Resonance activation analysis of iodine, J. Radioanal. Chem., 27, 105, 1975. 40. Chultem, D., Ganzorig, Dz., and Gun-Aajav, T., Determination of iodine in biological samples by resonance neutron activation, J . Radioanal. Chem., 50, 195, 1979; Fardy, J. J. and McOrist, G. D., Determination of iodine in milk products and biological standard reference materials by epithermal neutron activation analysis, J . Radioanal. Nucl. Chem. Lett., 87, 239, 1984; Brune, D. and Wester, P. D., The determination of iodine in thyroid gland with epithermal neutrons, Anal. Chim. Acta, 52, 372, 1970. 41. Unni, C. K. and Schilling, J. G., Determination of bromine in silicate rocks by epithermal neutron activation analysis, Anal. Chem., 49, 1998, 1977; Ebihara, M., Saito, N., and Akaiwa, H., Determination of trace iodine in rock samples by epithermal neutron activation analysis involving rapid radiochemical separation, J. Radioanal. Nucl. Chem. Lett., 108, 241, 1986. 42. Chisela, F., Gawlik, D., and Bratter, P., Instrumental determination of some trace elements in biological materials by epithermal and thermal neutron activation analysis, Analyst. 111, 405, 1986. 43. Chisela, F. and Bratter, P., Determination of trace elements in biological materials by instrumental epithermal neutron activation analysis, Anal. Chim. Acta, 188, 85, 1986. 44. Baedecker, P. A., Rowe, J. J., and Steinnes, E., Application of epithermal neutron activation in multielement analysis of silicate rocks employing both coaxial Ge(Li) and low energy photon detector systems, J. Radioanal. Chem., 40, 115, 1977. 45. Zaghloul, R., Gantner, E., Mostafa, M., and Ache, H. J., Epithermal neutron activation analysis using the monostandard method, J . Radioanal. Nucl. Chem. Art., 109, 295, 1987; Zaghloul, R., Multielement epithermal neutron activation analysis using an internal single comparator, J. Radioanal. Nucl. Chem. Art., 100, 215, 1986. 46. Lavi, N. and Ne'eman, E., Epithermal neutron activation analysis and detection limit calculation for trace amounts of thorium at nanogram level, in Israeli geological samples, J . Radioanal. Chem., 78, 327, 1983; Kuleff, I. and Kostadinov, K., Epithermal neutron activation analysis of uranium by Neptunium-239 using high resolution gamma spectrometry, J . Radioanal. Chem., 63, 397, 1981. 47. Steinnes, E., Simultaneous determination of uranium, thorium, molybdenum, tungsten, arsenic and antimony in granitic rocks by epithermal neutron activation analysis, Anal. Chem., 48, 1440, 1976.
Volume 11
69
48. Rosenberg, R. J., Kaistila, M., and Zilliacus, R., Instrumental epithermal neutron activation analysis of solid geochemical samples, J. Radioanal. Chem., 7 1 , 419, 1982. 49. Gladney, E. S., Owens, J. W., and Starner, J. W., Simultaneous determination of uranium and thorium in ores by instrumental epithermal neutron activation analysis, Anal. Chim. Acta, 104, 121, 1979. 50. Geisler, M. and Schelhorn, H., Determination of silver in soil-7 standard reference material by NAA, J. Radioanal. Nucl. Chem. Lett., 96, 567, 1985. 51. Steinnes, E. and Rowe, J. J., Instrumental activation analysis of coal and fly ash with thermal and epithermal neutrons and short-lived nuclides, Anal. Chim. Acta, 87, 462, 1976. 52. Rowe, J. J. and Steinnes, E., Determination of 30 elements in coal and fly ash by the thermal and epithermal neutron activation analysis, Talanta, 24, 433, 1977. 53. Kostadinov, K. N. and Djingova, R. G., Trace elements investigation of coal samples by thermal and epithermal neutron activation analysis, Radiochem. Radioanal. Lett., 45, 297, 1980. 54. Bellido, L. F. and de C. Arezzo, B., Uranium and thorium determination in Brazilian coals by epithermal neutron activation analysis, J . Radioanal. Nucl. Chem. Art., 92, 151, 1985. 55. Bellido, L. F. and de C. Arezzo, B., Non-destructive analysis of inorganic impurities in Brazilian coals by epithermal neutron activation, J . Radioanal. Nucl. Chem. Art., 100, 21, 1986. 56. Kuleff, L. and Zotschev, S., Neutron activation determination of the uranium content of the primary coolant of water-water nuclear reactors, J. Radioanal. Nucl. Chem. Art., 83, 39, 1984. 57. Chen, S. G., Tsai, H. T., and Wu, S. C., An internal standard method for the determination of uranium, thorium, lanthanum and europium in carbonaceous shale and monazite by epithermal neutron activation analysis, Radiochem. Radioanal. Lett., 49, 149, 1981. 58. Kuleff, I., Djingova, R., and Penev, I., Analysis of ancient and medieval glasses by INAA, J. Radioanal. Nucl. Chem. Art., 83, 333, 1984. 59. Kuleff, I. and Kostadinov, K., Epithermal neutron activation analysis of uranium by neptunium-239 using high resolution gamma-spectrometry, J . Radioanal. Chem., 63, 397, 1981. 60. Guinn, V. P. and Miller, D. A., Recent instrumental neutron activation analysis studies utilizing very short-lived activities, J. Radioanal. Chem., 37, 313, 1977. 61. Alfassi, 2. B. and Lavi, N., Epithermal neutron activation analysis using (n,n1) reaction, J . Radioanal. Chem., 76, 257, 1983. 62. Tzak-Biran, T. and Guinn, V. P., Analysis of metal fragments for lead via the 2MPb(n,nl) *"'"Pb reaction, Trans. Am. Nucl. Soc., 28, 94, 1978. 63. St. Pierre, J. and Zikovsky, L., Determination of the effective cross-section for (n,nl) reactions on Ag, Br, Ir and Y with reactor fast neutrons, Radiochem. Radioanal. Lett., 54, 61, 1982. 64. Gladney, E. S. and Perrin, D. R., Quantitative analysis of silicates by instrumental epithermal neutron activation using (n,p) reactions, Anal. Chem., 51, 2297, 1979. 65. Alfassi, Z. B. and Lavi, N., Fast determination of iron by neutron activation analysis (NAA) using reactor and epithermal neutrons, J. Radionucl. Nucl. Chem. Art., 84, 363, 1984. 66a. Hancock, R. G. V., On the determination of silicon in pottery, J . Radioanal. Chem., 69, 313, 1982. , Orban, E., Miskovitz, G., Appel, J., and Szabo, E., Lymph node test for silicosis by 66b. ~ r d o g h M., activation analysis combined with spectrophotometry, Int. J. Appl. Radiat. Isot., 25, 61, 1974. 67a. Alfassi, 2. B. and Lavi, N., Simultaneous determination of sodium, magnesium, aluminium, silicon and phosphorus by instrumental neutron activation analysis using reactor and epithermal neutrons, Analyst, 109, 959, 1984. 67b. Cesana, A. and Terrani, M., Determination of P in bones and of A1 and Si in pottery by activation with reactor neutrons, Int. J. Appl. Radiat. Isot., 3 5 , 405, 1984. 68. Jones, J. D., Kaufman, P. B., and Rigot, W. L., Method for determination of silicon in plant materials by neutron activation analysis, J. Radioanal. Chem., 50, 261, 1979. 69. Penev, I., Kuleff, I., and Djingova, R., Simultaneous activation determination of aluminium, magnesium, and silicon in rocks, glasses and pottery, J. Radioanal. Nucl. Chem. Art., 96, 219, 1985. 70. Yule, H. P., Lukens, H. R., Jr., and Guinn, V. P., Utilization of reactor fast neutrons for activation analysis, Nucl. Instr. Methods, 33, 277, 1965. 71. Steinnes, E., Determination of nickel in rocks after epithermal neutron activation, Anal. Chim. Acta, 68, 25, 1974. 72. Lavi, N., Application of epithermal neutron activation analysis for determining trace amounts of molybdenum and nickel in standard rocks, using high resolution gamma-ray spectrometry, Radiochem. Radioanal. Lett., 27, 163, 1976. 73. Rowe, J. J. and Steinnes, E., Instrumental activation analysis of coal and fly ash with thermal and epithermal neutrons, J. Radioanal. Chem., 37, 849, 1977. 74. Tout, R. E. and Chatt, A., A critical evaluation of short-lived and long-lived neutron activation products for trace element determination, Anal. Chim. Acta, 118, 341, 1980. 75. Anders, 0 . U., Determination of fluorine by neutron activation, Anal. Chem., 32, 1368, 1960; Anders, 0 . U., Use of very-short-lived isotopes in activation analysis, Anal. Chem., 33, 1706, 1961.
70
Activation Analysis
76. Caldwell, R. L., Mills, W. R., Jr., Allen, L. S., Bell, P. R., and Heath, R. L., Combination neutron experiment for remote analysis, Science, 152, 457, 1966. 77. Spyrou, N. M. and Kerr, S. A., Cyclic activation: the measurement of short-lived isotopes in the analysis of biological and environmental samples, J. Radioanal. Chem., 48, 169, 1979. 78. Spyrou, N. M., Adesamni, Ch., Kidd, M., Stephens-Newsham, L. G., Ortaoval, A. Z., and Ozek, F., Usefulness of thermal and epithermal cyclic activation analysis with a reactor system, J. Radioanal. Nucl. Chem., 72, 155, 1982. 79. Chattopadhyay, A. and De Silva, K. N., Pseudo-cyclic neutron activation of Ag, F, Rb, Sc and Se in biological samples, Trans. Am. Nucl. Soc., 32, 185, 1979. 80. De Silva, K. N. and Chatt, A., A method to improve precision and detection limits for measuring trace elements through short-lived nuclides, J. Trace Microprobe Techniques, 1, 307, 1982. 81. Burholt, G. D., Caesar, E. A. Y., and Jones, T. C., The fast cyclic activation system for neutron activation analysis in the University of London Reactor, Nucl. Instrum. Methods, 204, 231, 1982. 82. Chatt, A., De Silva, K. N., Holzbecher, J., Stuart, D. C., Tout, R. E., and Ryan, D. E., Cyclic neutron activation analysis of biological and metallurgical samples, Can. J. Chem., 59, 1660, 1981. 83. Fanger, H. U., Pepelnik, R., and Michaelis, W., Fast-neutron activation analysis with short-lived nuclides, J . Radioanal. Chem., 61, 147, 1981. 84. Givens, W. W., Mills, W. R., Jr., and Caldwell, R. I., Cyclic activation analysis, Modern Trends in Activation Analysis, National Bureau of Standards, Special publication 312, Vol 11, 1969, 929. 85. Janczyszyn, J. and Gorski, L., Optimization of the number of cycles in cyclic activation analysis, Radiochem. Radioanal. Lett., 8, 297, 1971. 86. Tominaga, H. and Tachikawa, N., Modified optimization of the cycle period in cyclic activation analysis, Radiochem. Radioanal. Lett., 37, 55, 1979. 87. Colin, M., Friedli, C., and Lerch, P., Heavy ions activation analysis: Theoretical approach for optimizing cyclic analyses, Nucl. Instrum. Methods Phys. Res., B10, 1062, 1985. 88. Tout, R. E. and Chatt, A., The effect of sample matrix on selection of optimum timing parameters in cyclic neutron activation analysis, Anal. Chim. Acta, 133, 409, 1981; Tout, R. E. and Chatt, A., Optimization of timing parameters in cyclic activation analysis, Trans. Am. Nucl. Soc.. 33, 233, 1979. 89. Al-Mugrabi, M. A. and Spyrou, N. M., The use of simulation for the optimisation of the signal to noise ratio in cyclic activation analysis, J. Radioanal. Nucl. Chem. Art., 110, 67, 1987. 90. Spyrou, N. M., Cyclic activation analysis - a review, J. Radioanal. Chem., 61, 21 1, 1981. 91. Al-Mugrabi, M. and Spyrou, N. M., The determination of uranium using short-lived fission products by cyclic and other modes of activation analysis, J . Radioanal. Nucl. Chem., 112, 277, 1987. 92. Ortaovali, A. Z., Ozek, F., Celenek, I., and Spyrou, N. M., Studies of some problems and applications of cyclic activation analysis, J . Radioanal. Chem., 61, 175, 1981. 93. Guinn, V. P., Cyclic nuclear activation analysis, Radiochem. Radioanal. Len., 44, 133, 1980. 94. Parry, S. J., Cumulative neutron activation analysis for the improved detection of short-lived nuclides, J. Radioanal. Chem., 75, 253, 1982. 95. Sehonfeld, E., Alpha - a computer program for the determination of radioisotopes by least-squares resolution of the gamma-ray spectra, Nucl. Instrum. Methods, 42, 213, 1966. 96. Wiernik, M. and Amiel, S., Use of very short-lived nuclides in non destructive activation analysis with a fast shuttle rabbit. I. Correction for rapid variations in the dead time, J. Radioanal. Chem., 3, 245, 1969. 97. Guinn, V. P. and Miller, D. A., Recent instrumental neutron activation analysis studies utilizing very short-lived activities, J. Radioanal. Chem., 37, 313, 1977. 98. Egan, A., Kerr, S. A., and Minski, M. J., Determination of selenium in biological materials using ""Se (T = f7.5 sec) and cyclic activation analysis, Radiochem. Radioanal. Len., 28, 369, 1977. 99. Wyttenbach, A., Coincidence losses in activation analysis, J. Radioanal. Chem., 8, 335, 1971. 100. Anders, 0. U., Experiences with the Ge(Li) detector for high resolution gamma-ray spectrometry and a practical approach to the pulse pileup problem, Nucl. Instrum. Methods, 68, 205, 1969. 101. Bolotin, H. H., Strauss, M. G., and McClure, D. A., Simple technique for precise determinations of counting losses in nuclear pulse processing systems, Nucl. Instrum. Methods, 83, 1, 1970. 102. Alfassi, Z. B., Tsechansky, A., and Kushelevsky, A. P., On the correction of the self coincidence in gamma ray spectra dependence of resolution time on energy, J. Radioanal. Chem., 55, 135, 1980. 103. Cohen, E. J., Live time and pile-up correction for multichannel analyzer spectra, Nucl. Instrum. Methods, 121, 25, 1974. 104. Wiernick, M. and Amiel, S., Use of very short-lived nuclides in nondestructive activation analysis with a fast shuttle rabbit. 11. Determination of lead by means of Z07mPb, J. Radioanal. Chem., 3, 393, 1969. 105. Egan, A. and Spyrou, N. M., Detection of lead via lead-207m using cyclic activation and a modified sum coincidence system, Anal. Chem.. 48, 1959, 1976. 106. Kerr, S. A. and Spyrou, N. M., Fluorine analysis of bone and other biological materials: A cyclic activation method, J. Radioanal. Chem., 44, 159, 1978. 107. Chatt, A., De Silva, K. N., Hozbecher, J., Stuart, D. C., Tout, R. E., and Ryan, D. E., Cyclic neutron activation analysis of biological and metallurgical samples, Can. J. Chem., 59, 1660, 1981.
Volume 11
71
108. Valente, I. M., Minske, M. J., and Petterson, P. J., Neutron activation analysis of noble metals in vegetation. J . Radioanal. Chem., 7 1, 115, 1982. 109. Lukens, H. R., Jr., Yule, H. P., and Guinn, V. P., Reactor pulsing in activation analysis, Nucl. Instrum. Methods, 33, 272, 1965; Guinn, V. P., in "Production and Use of Short-Lived Radioisotopes from Reactors", Vol. 2, IAEA, Vienna, 1963, 3; Yule, H. P. and Guinn, V. P., in "Radiochemical method.^ of Analysis", Vol. 2, IAEA. Vienna, 1965, 11; Miller, D. A. and Guinn, V. P., Precision high speed neutron activation analysis via very short-lived activities, J. Radioanal. Chem., 32, 179, 1976. 110. Westphal, G. P., A high rate gamma spectroscopy system for activation analysis of short-lived isomeric transitions, Nucl. Instrum. Methods, 136, 271, 1976. 1 11. Grass, F., Aktivierungsanalysen mit kurzlebigen nukliden und kernzustanden, Nucl. Instrum. Methods, 14. 49. 19?4. 112. Grass, F. and Niesner, R., Rapid characterization of dust samples by neutron activation techniques using a high rate "loss free" counting gamma spectroscopy system, Nucl. Instrum. Merhods, 151, 589, 1978. 113. Grass, F., Short time activation analysis with steady state and pulse irradiation, J . Radioanul. Nucl. Chem. Art., 112, 347. 1987. 114. Miller, D. A. and Guinn, V. P., Precision high-speed neutron activation analysis via very short-lived activities, J. Radioanul. Chem., 32, 179, 1976. 115. Miller, D. A., Instrumental neutron activation analysis utilizing pulsed irradiations, Nucl. Instrum. Methods, 159, 109, 1979. 116. James, W. D. and Oyedele, J. A., Application of reactor pulsing to neutron activation analysis, .I. Radioanal. Nucl. Chem. Art.. I 10, 33. 1987. 117. James, W. D., Evaluation of reactor pulsing activation analysis enhancement in reference materials, J . Radioanal. Nucl. Chem. Art., 112, 361, 1987.
Volume 11
73
Chapter 2
14-MeV NEUTRON ACTIVATION ANALYSIS
. .
A G Elayi
TABLE OF CONTENTS I.
Introduction ......................................................................
74
I1.
Neutron Sources .................................................................
76
111.
Neutron Reactions and Cross-Sections ........................................... 77
IV .
Irradiation Facilities and Procedures ............................................. 80 A. The Texas Convention for Flux Monitoring .............................. 84
v.
Growth of the Activity and Detector Response in the Case of a Single Irradiation ................................................................85
VI .
Cyclic 14-MeV Neutron Activation Analysis .................................... 88 A. Time Function in Cyclic Activation Analysis ............................. 88
VII .
Method Using a Reference Different from the Sample ...........................91 A. The Self-shielding Problems ............................................. 92 . B Formalism ................................................................ 92 1. Formalism Relative to the Activation ............................. 92 2. Formalism Relative to the Detection ..............................94 C. Simple Handling of the Formalism ....................................... 99 Neutron andtor Gamma-Ray Self-Shieldings as Related to the D. Detection Count Rates ................................................... 100
VIII . Choice of the Irradiation. Delay. and Counting Times ..........................101 A. Choice of the Irradiation Time .......................................... 102 1. General Case ..................................................... 102 Choice of the Irradiation Time in the Case of Interfering 2. Elements ......................................................... 103 B. Choice of the Delay Time ............................................... 105 C. Choice of the Counting Time ............................................107 IX .
Precision of 14-MeV Neutron Activation Analysis ..............................107 A. Procedure and Parameters Studied ....................................... 107 B. Anomalous Isotopic Abundances ........................................108 C. Influence of the Neutron and Gamma-Ray Self-shielding ...............108 Influence of the Positioning of the Sample and the Reference D. with Respect to the Detector ............................................109 Influence of the Positioning of the Sample and of the Reference E. with Respect to the Neutron Source .....................................110 F. Influence of the Irradiation Time ........................................111 G. Influence of the Counting Time .........................................111
74
Activation Analysis
H. I.
J.
X.
Interfering Gamma-Ray and Nuclear Reactions .........................I11 1. Interfering Gamma Rays .........................................I11 2. Interfering Nuclear Reactions ....................................I12 Beam Degradation Inside the Samples.. .................................112 1. Choice of the Reaction.. .........................................I12 2. Experimental Technique ........................................ .I12 Other Factors Influencing the Precision ................................. 114
114 Conclusion.. ....................................................................
Appendix: Cross-Sections for 14-MeV Neutron Activation Analysis ...................I15 References. ............................................................................ .I37
I. INTRODUCTION There are in general several techniques to solve an analytical problem; however, when suitable, 14-MeV neutron activation analysis (NAA) presents many advantages; it is relatively easy to settle and requires little maintenance when sealed tubes are used; it is nondestructive, non-polluting (samples do not need to be isolated for a long time after the irradiation); it performs an analysis of the whole sample and not only of its surface or a thin layer, as is the case for X-ray or charged particles activation analysis; it may be instrumental and can be accurate when applied for routine analyses. Its main drawback is its low sensitivity as compared with reactor NAA. Since the first papers were published in 1956, 14-MeV NAA, through extensive literature, has developed its methods, procedures, and fields of applications, using whenever possible the technological progress of other fields. During the first 20 years, research was mainly concerned with the following topics: The development of the irradiation and counting facilities, such as neutron sources, transfer systems, rotators for irradiation. The sealed-tube neutron generators opened the possibilities for field and well logging applications and brought the method within the possibilities of relatively small laboratories. A better understanding of the basics of the method; hundreds of papers dealt with neutron output spectra and neutron flux distribution, measurement and monitoring studies, cross-sections measurements and calculations, standardization, attenuation effects, geometry errors, blank problems, sensitivity, precision, catalogues of garnmaray spectra. The application of the method to the different fields: 60 elements have been measured in matrices as varied as reactor fuels, biological samples, ancient coins, or air dust (oxygen being the most appropriate and convenient element, it has been analyzed in more than 130 different types of matrices besides its different routine industrial applications). 14-MeV NAA seems to have reached through the last 10 years its asymptotical technological development; to the knowledge of the author, no spectacular improvement is to
Volume 11
75
be expected in the near or mid-term future: there are no projects to construct accelerators producing much more than 5 x 10¹³n/s, transfer times will be hardly reduced much below the 18 ms already achieved; the large volume GeLi detectors, the fast electronic systems, the methods for dead-time corrections, the automatic control of the experiments, and acquisition of the data will probably not undergo any serious development. During this last 10-year period, cross-sections have been measured or remeasured, short half-life isotopes suitable for cyclic NAA have been and are being selected, radiative capture and fast neutron scattering continue to be studied beside different applications, such as therapy, radiation treatment, biophysical aspects, in vivo total body nitrogen analysis, thickness measurements, elemental determination (especially oxygen) in different samples, and applications in metallurgy, archaeology, environmental study, etc. As far as the techniques associated with 14-MeV NAA are concerned, three possibilities with high potentialities developed or grew over the last 10 years: the use of intense 14-MeV neutron sources, the use of very short half-life isotopes, and the use of a reference different from the sample for the analysis. The construction of neutron sources with fluxes of 10" n/cm2/s partially overcomes the main drawback of 14-MeV NAA which is its relatively low sensitivity. Such high fluxes supplement sometimes reactor NAA, since several elements are detectable when irradiated in these fluxes, but not with thermal fluxes. However, they are particularly interesting in places where reactors are not available and where there are enough needs to justify their relatively high cost. The new possibilities offered by KORONA, the intense neutron source, have been explored in a series of articles; other accelerators producing 5 x loL2nls are commercially available. Transfer systems with shorter and shorter transfer times made isotopes with shorter and shorter half-lives accessible to 14-MeV NAA and widened the field of cyclic activation analysis with reasonable times for the analysis. This increases the sensitivity of the method in a way different from high fluxes; a workshop on activation analysis with short-lived nuclei was held in 1980 in Vienna. Although mature, 14-MeV NAA seems to have some difficulties in competing, except in some special cases, with the routinely used methods of analysis. A method can only become applicable on a large scale when an automatic procedure of analysis can be applied in most cases. It is relatively easy to automatically drive the whole irradiation detection procedure, but not the production of good references. The method, using a reference different from the sample, offers the possibility of having the whole analysis performed automatically; this is one of the advantages of this method, which is discussed in detail in Section VII. The use of a reference different from the sample avoids the fundamental problem of activation analysis: in order to make a good reference, the composition of the sample must be known. NAA seems straightforward enough to apply. We irradiate and count a sample and a reference under the same conditions. The ratio of the masses in the sample and the reference is the same as the ratio of their count-rates; in fact, many reasons can interfere thus reducing the precision of the method. That is why this precision problem has been extensively treated in Section IX: the knowledge of the sources of errors is an a priori to the performance of a precise analysis. Beam degradation, self-shieldings, or interferences may introduce 50% errors or more in some cases if they are neglected. Since an exhaustive bibliography is not within the scope of this chapter, reference here is made to some of the general articles, books, or bibliographies on 14-MeV NAA;'-26 unfortunately we can not include the many other excellent references. Special emphasis is put on the methods developed over the last 10 years while subjects developed in the other chapters of this book are not treated in this chapter, even though related to 14-MeV NAA; this is the case of the computerized analysis of the y-ray spectra for example.
76
Activation Analysis D~aphragms
Constant f ~ e l dt u b e
,
-
--
D e f l e c t ~ n gm a g n e t
\
I
Trap
Target
FIGURE 1. Ion source and the associated optical focusing and separating systems (from IRELEC - France).
11. NEUTRON SOURCES Neutron fluxes can be obtained from reactors, accelerators, or isotopic sources; fluxes are of the order of 1012to 10" n/cm2/sfor reactors; lo6 to 5 X 10" n/cm2/sfor accelerators producing 14-MeV neutrons and lo4 to lo6 nlcm21s for isotopic sources. Accelerators can produce neutron fluxes by (d,n), (p,n), or (a,@ reactions; electron accelerating machines produce neutron fluxes through (y,n) reaction and the gamma flux is obtained by Bremsstrahlung effect. 14-MeV neutron fluxes are produced by:
reaction through different types of high-voltage generators: Cockcroft-Walton, insulating core transformers (ICT), electrostatic rotor machines, and Van de Graaff accelerators. Compact, sealed-tube neutron generators are also used for in situ or laboratory activation analysis. Many papers, for e ~ a r n p l eextensively ~.~~ describe these systems. A deuteron beam is proa penning (P.I.G.) ion s ~ u r c e , ' ~an. ~occluded ~ gas ion source," duced by an R.F. ~ource,~' or a plasma tube30.31and the associated optical focusing and separating systems (see Figure 1). This beam is accelerated through one to some hundreds kV accelerating electrodes. The beam may also be a mixture of 50% tritium and 50% deuterium. Typical beam intensities are of a few mA, but intensities as high as 150 mA can be found. 14-MeV neutrons are produced by interaction of such a beam with a relatively large surface tritiated target. This consists in general of a few hundred microns of titanium or zirconium evaporated on some 30-mrn diameter backing disk and saturated with tritium gas. This disk is water cooled and made out of heat-conducting material: silver or copper for deuteron beams, graphite-coated copper or titanium-coated silver for mixed tritium-deuteron beams; rotating targets are sometimes used to ensure heat dissipation. The target can also be saturated with a mixture of 50% deuterium and 50% tritium instead of tritium alone. The tritium target properties have been discussed in detail in two meeting^.^'.^^ Some accelerators provide a neutron source of variable surface (1.5 to 4 cm in diameter). Target half-lives (defined as the time by which the neutron output is reduced to one half of its original value because of target deterioration)
Volume I1
77
Annular High-Voltage High-Voltage Insulator Conductor Electrode Target Electrode Water coolant/ Oil Insulation b)
Scandium Target
Pressure Pulse Guide
\
/
/
Rabbit Guide \
Magnet Coil FIGURE 2.
\
Concentric Ion Beam
Vacuum
Annular target of the neutron source KORONA (from GKSS - Federal Republic of Germany).
may be of more than 1000 h. In sealed tubes, the pumping problem is suppressed since the vacuum is made by the constructor before sealing the tube. Fluxes of about lo9 to 10" n/s are routinely used in many laboratories. However, since one of the drawbacks of 14-MeV NAA is its low sensitivity which is due to the low fluxes available, the constructors made a great effort over the last years to increase these fluxes. A 14-MeV neutron generator with an annular ion source, an ion beam current of 150 mA and an accelerating voltage of 200 kV was constructed in 1980 (Figure 2);34its total continuous neutron flux is of 5 x 10¹² 111s. In order to study the material for fusion reactors, several intense neutron sources of about 1012 to 1013 n/s have been built or are under construction; the most intense D-T neutron source being RTNS-I1 which can supply 5 x 10¹³ n/s (see for example Reference 5). Such an accelerator producing a flux of 5 x loL2n/s for a deuteron beam intensity of 20 mA and an accelerating voltage of 430 kV is commercially available from IRELEC and a compact, sealed-tube neutron generator with a total output of 1012n/s is under construction by another constructor (SODERN) for field applications. Pulsed neutron generators are commercially available either in a compact form for field applications (Figure 3) or in laboratories for the study of short- or very short-lived isotopes. The impulse duration can be as low as a few microseconds and the pulse peak level can reach 5 x loL3n/s in recent generators.
111. NEUTRON REACTIONS AND CROSS-SECTIONS When irradiated in a 14-MeV neutron flux, the total activity induced in a sample (A) is the sum of the activities induced by the different reactions (r) with the different isotopes (i) of the different elements (e) of the sample
e
i
r
The number of activated isotopes is significant in compound samples because of (n,2n), (n,p), (n,a), (n,y), (n,nf), (n,na) . . . reactions. However, few of these isotopes only will produce measurable gamma rays (with commonly available irradiation facilities) because of the relatively low fluxes and cross-sections. We only consider here the cross-sections of the reactions useful for activating analysis.
78
Activation Analysis
FIGURE 3. Compact pulsed neutron generator for field applications (from SODERN - France)
Cross-sections of (n,2n) reactions are, by far, the most important ones in the case of 14-MeV NAA and can reach some barns. Cross-sections of (n,p) reactions vary from a fraction of a millibarn to about 350 mb, those of @,a) reactions from a fraction of a millibarn to about 150 mb and only a few millibarns for heavy elements. (n,y) reactions produce sometimes measurable activity with 14-MeV neutrons; however, the values of the crosssections are in general a few millibarns. Since the energy spectrum of the neutron flux is in general significantly widened inside the sample, we consider the average 5 ?p value which is equal to:
The neutron spectrum varies from one neutron source to another. It also varies with the material located between the neutron source and the sample or in their immediate vicinity (such as the rotator's) and with the material of the sample: the contribution of elastically and inelastically scattered neutrons to the total flux is more or less important. Very precise cross-section values are only useful when they are measured and used with a defined setup; they are necessary to study the feasibility of an analysis and in this case, a too high precision is useless. The analyses are in general performed using comparative techniques rather then cross-section values. The available cross-section data are either the results of measurements or calculations with one of the many semiempirical formulas or evaluations using heavy calculation codes. Such semiempirical formulas for the calculation of approximative values of (n,2n), (n,p), and (n,a) c r o s s - s e ~ t i o n sare ~ ~ given - ~ ~ below. Compilations of 14-MeV neutron cross-sections and excitation functions in the 14-MeV region have been regularly updated as mentioned in the Appendix. The main progress in the latest compilations is due to the development of statistical and pre-equilibrium decay models and to a better understanding of the nuclear density level problems. For the calculation of the cross-sections of (n,2n) reactions, the following formulas have been used as mentioned previously
Volume 11
for (N - Z)IA
79
> 0.07 and:
for (N - Z)/A < 0.07. These relationships hold for odd-even and for even-even nuclei. The maximum value of the a (n,p) cross-section is given by the next empirical formula in the 14-MeV regions
where i and j represent either odd (0) or even (e) nuclei with k(o,e)=0.28
and
k(e,e)=0.47
and u, ,(I4 MeV) = ~ ( 0l2A'I3 .
+ 0.21)2b
The cross-section for the (n,p) reaction is given by
where k(o,e) = 0.50 and k(e,e) = 0.83. Similar relationships have been developed for ( n p ) reactions. The maximum value of is given by the next empirical formula the cross-section &a),,
where k(o,e) = 0.55 and k(e,e)
=
0.92 and the cross-section by the next formula
where k(o,e) = 0.5 and k(e,e) = 0.83. It is also important to examine the energy dependence of the reaction cross-section to ensure that the threshold is not in the 14-MeV region, especially if samples of large volume are used or if the neutron beam is degraded between the source and the sample. Such a case will be studied in Section IX. In general, the excitation functions for (n,2n), (n,p), and (n,a) reactions vary smoothly around 14 MeV (see for example Figure 4 for 6 3 C (n,2n) ~ 62C~ rea~tion'~);however, the threshold can be at about 14 MeV as it is shown on Figure 5 for the Fe54(n,2n) 53Fereaction.39These threshold values are often used to measure the energy distribution of the flux but they can induce some errors if no special attention is paid during the analyses. In Table A of the Appendix, are reported the published cross-sections for (n,2n), (n,p), (n,a), and (n,y) reactions at a neutron energy of about 14.50 MeV. Note that
80
Activation Analysis
FIGURE 4. Cross-section dependence on energy of the reaction 6 3 C(n,2n) ~ 6 Z C ~(From . Cullen, D. E., Kocherov, N., and McLaughlin, P. K., IAEA-NDS 48, International Atomic Energy Agency, Vienna, 1982. With permission.)
14.00
14.25
14.50
E (MeV) FIGURE 5 . Cross-section dependence on energy of the reaction "Fe (n,2n) 53Fe.(From Alley, W. E. and Lessler, R. M., Neutron Activation Cross-Section, Academic Press, Orlando, FL, 1973. With permission.)
Also reported in Table 1 are reactions with half-lives shorter than 1 min, suitable for cyclic activation analysis.
IV. IRRADIATION FACILITIES AND PROCEDURES The samples are, in general, located as close as possible to the neutron sources in order to be irradiated in the maximum neutron flux. However, since short-lived isotopes and sometimes very short-lived ones (half-lives of the order of one second or less) are generally considered for 14-MeV NAA, a pneumatic rabbit transfer system (with a transfer time that can be as low as 20 ms or even less) is often used; this increases the distance between the sample and the neutron source.
Volume 11
81
TABLE 1 Most Favorable Activation Reactions for the Elements of Column 1 Element
Reaction
Isotopic abundance
Cross-section (mb)
Half-life (s) 13.81 7.13
26.76 11 1I
16.06 56.44 10.5 7.86 Note: The half-lives of the produced isotopes are shorter than one minute
------
Reference
Cams e l
!
Reference
_ _ - -- - _ _ '\
Sample
\
FIGURE 6. Irradiation configurations. (a) The reference is located behind the sample; (b) the sample and the reference are rotated around the axis of symmetry of the neutron source. (From Elayi, A. G., J . Radioanal. Chem., 76, 203, 1983. With permission.)
Precise absolute activation analysis method is very difficult to achieve because of the errors relative to flux Q measurement, to the cross-sections a, to the absolute efficiencies of the detector E, to the self-shieldings X , . . . A reference is usually irradiated with the sample in order to perform a relative analysis avoiding the determination of a, E, . . . which cancel between the sample and the reference. The position of the sample, the reference, and/or the flux monitor with respect to the neutron source depends upon the procedure of analysis which has been chosen. It is possible to successively irradiate the sample and the standard in the same position in the neutron flux and to monitor the flux with a neutron detector, such as a BF3 counter; however, this method does not seem to be much used in 14-MeV NAA, probably because a part of the neutrons reaching the BF3 counter are reflected towards it by all the surroundings of the neutron source. Moreover, the neutron counter does not take into account the flux variations during the irradiation: a burst of neutrons does not have the same effect whether it occurs at the beginning or at the end of the irradiation. The different other systems proposed in References 40 to 45 are no more in use to the knowledge of the author. Another way of monitoring the neutron flux consists of measuring the activity induced in a monitor run in general behind the sample (Figure 6a). The 6 3 C(n,2n) ~ 6 2 Creaction ~ is ~ generally used for this purpose and the 51 1-keV annihilation gamma rays from 6 2 C are measured for the monitoring. Here again a burst of neutrons at the beginning of the irradiation
82
Activation Analysis
may have a different effect upon the decay of the sample and the monitor during the irradiation . if the half-life of the isotope to be analyzed is quite different from the half-life of 6 2 C ~The use of a monitor placed behind the sample also supposes that the neutron shielding exerted by the sample and the standard on the monitor are the same. Moreover, much care must be taken to ensure that the degradation of the flux in the monitor due to the presence of the sample and the standard is the same, especially if the cross-section of the monitor-isotope has a sharp variation around 14 MeV. When the analysis is performed with a monitor (So) placed behind or near the sample (S), the procedure is the following. The monitor (So) is irradiated first with the sample (S) and, in a second run, with a reference (S,) having a geometry and a composition as identical as possible to the sample and placed at the same position as the sample with respect to the neutron source. Let m,, mso, m,,, A,, A,,, and A,, be the weights and the activities at the end of the irradiations, of the sample, the monitor and the reference; A,, can take two values A,,, when the monitor is irradiated with the sample and A,,, when it is irradiated with the reference. If the time of irradiation is the same, we have (see Formula 23):
m, = m,,
X
As As,
&so
-X Also
A,,, Also sample and the reference. A series of monitors So can be used if the decay time of the monitor is long; in this case, the weights of the monitors are also slightly different from each other and the previous formula becomes:
-is the monitoring ratio; it is theoretically equal to 1 if the same monitor is run with the
m,
=
As A,,, mlso m,, --As1 Also ~ , S O
where m,,, and m,,, are the weights of the monitors respectively run with the sample and the reference. Writing the previous equations supposes, however, that the standard S, is very similar to the sample. Except one type of neutron generators ( K ~ r o n a which ) ~ ~ presents a homogeneous flux in a volume large enough for the sample and the standard, 14-MeV neutron sources induce a flux gradient through the sample. Figures 7 and 8 represent the axial and transversal flux variation of a neutron generator with the distance and Figure 9 the neutron yield and neutron energy variations with 0 the angle with the deuteron beam which were first calculated by J. T. Pr~d'hornrne.~ An extensive literature has been devoted to the problem of the neutron flux study. In "Annotated Bibliography on 14 MeV NAA" published in 1971,24 86 references are given relative to the neutron flux distribution study, neutron output spectra, and absolute neutron flux measurements. The flux gradient presents many drawbacks if the sample, the standard, or the monitor, if any, are not homogeneous. If for example an abnormal concentration C, exists in a small volume inside the sample (Figure lOa), the activity induced inside this small volume depends upon the initial positioning of the sample with respect to
Volume 11
83
FIGURE 7. Experimental flux distribution from a 14-MeV neutron generator as a function of the distance to the external face of the generator. The neutron source is located at about 1.5 crn from this face. The two lower curves are taken on two lines parallel to the axis of the generator at 2.5 cm and 5 cm from it.
the neutron source: a rotation of an angle .rr around a longitudinal axis may change significantly the activity of C , (Figure lob). In order to minimize this effect, the sample may be rotated around its longitudinal axis making C, take all the positions of the elementary ring R of Figure 10c and the initial position of the sample with respect to the neutron source has no effect on the activity induced in C, during the irradiation. In some cases, the neutron flux may not be symmetrical with respect to the axis of the neutron source. This may have many reasons, such as a bad focusing and displacement of the deuteron beam or the unhomogeneity of the target. The effect of the flux anisotropy is lowered when the sample and the reference are rotated around the axis of symmetry of the neutron source (Figure 7b). A dual sample biaxial rotator combines the two previous types of rotation (Figure 11). On the other hand, the monitoring is not necessary since the sample and the reference are irradiated together in the average in the same neutron flux, their activities can be compared directly:
The suppression of the monitor has a positive effect, as far as the precison is concerned, since the analysis is made after a single irradiation for both the sample and the reference instead of two irradiations, one for the sample and the monitor and the other for the reference and the monitor. Errors associated with the monitor countings, with the presence of an accidental burst of neutrons during one of the irradiations, etc. are suppressed. We must, however, note that this biaxial rotator increases even more the distance between the irradiation positions and the neutron source. The method which uses a reference different from the sample (Section VII) suppresses also the use of a monitor.
84
Activation Analysis
I
Q> ncrn-2s-1
FIGURE 8. Experimental transversal flux distribution from a neutron generator at distances equal to 0, 1.5, 3, 4.5, 6, 7.5, and 9 cm from the outer face of the neutron generator.
FIGURE 9. Variation of the neutron yield and neutron energy with 8, the angle with the deuteron beam.
A. THE TEXAS CONVENTION FOR FLUX MONITORING Normalized conditions for flux monitoring of neutron generators have been proposed at the 1965 International Conference on Modem Trends in Activation Analysi~.~' These conditions consist of the following: a copper disk of 99.9% purity, either 1- or 2.5-cm diameter and 0.25-rnm thickness, is irradiated for 1 min and measured after a 1-min decay by a 7.5 cm x 7.5 cm NaI (Tl) detector at 3 cm from the top surface of the crystal. The 6 3 C ~ (n,2n) 6 2 Creaction ~ is produced by the irradiation of the copper disk. In order to ensure
Volume 11
85
Neutron source
b
c
a
FIGURE 10. Effect of sample rotation on a small nonhomogeneous ele-
ment (Co) of the sample. that all the p' emitted by the "Cu of the copper disk are annihilated in its near vicinity, the disk is mounted between two disks of polystyrene or lucite (0.95-cm thick by 3- or 4.5cm diameter, depending on which size of the copper disk is to be used). The resulting envelope provides about 1 g/cm2 of the plastic on all sides of the copper disk. The detector is connected to a multichannel analyzer incorporating an automatic lifetime correction circuit. The midpoint of the real counting interval is used to correct for the decay. The method of Heath48is used for the determination of the absolute disintegration rate. He calculated the detector response D with the next formula:
where Ap is the 0.5 11-MeV total absorption peak area in counts per minute and K is equal to 8.591 for the I-cm diameter copper disk and 8.703 for the 2.5-cm diameter disk; K takes into account the efficiency of the detector for the disk geometry, the branching ratio and the absorption in the plastic absorber. D' being the activity per square centimeter after correction for the 1-min delay, the absolute flux @ is related to D' by the next formula: a) =
D' 60uNI[1 - exp( - At,)]
where: u = activation cross-section for the reaction 6 3 C(n,2n) ~ 6 2 C ~N, = number of atoms = isotopic abundance of 6 3 C ~ T,,, , = half-life of 6 2 C ~ti ,= irradiation per cubic centimeter, I time. If the comparative methods previously described are used, this absolute flux measurement is not necessary for the analysis.
V. GROWTH OF THE ACTIVITY AND DETECTOR RESPONSE IN THE CASE OF A SINGLE IRRADIATION The radioactive isotopes produced in a 14-MeV neutron flux a) have in general short half-lives (T,,,). Let N, be the number of nuclei producing in the sample, through a nuclear reaction, a radioactive isotope X and N, the number of nuclei of isotope X. During the irradiation, the rate of variation of isotope X is
When writing this differential equation, No is considered constant during the irradiation and the rate of variation of the number of nuclei of isotope X is equal to their constant rate of production N o d minus their rate of decay AN,.
86
Activation Analysis
biaxial rotator
neutron source
FIGURE 1 1 . system.
1
(a) A biaxial rotator; (b) a sample and a reference configuration within a biaxial rotator
Assuming that ti is the irradiation time and that N,,o, the number of nuclei of radioactive isotope X present in the sample before the irradiation, is equal to zero: Nod N,(ti) = -[1 - exp( - At,)] A
(19)
The saturation factor [ I - exp(- At,)] varies from 0 to 1 and reaches practically this last value when ti is equal to some half-lives. At the beginning of the irradiation, N, is negiigible,
Volume 11
87
dN, and AN, also. In this case, N,(t) = N,u@t. At the saturation, - = 0 and the rate of dt production of isotope X, uN@, is equal to its rate of disintegration (AN,). After a delay time t, following the irradiation, the number of activated nuclei becomes
and the activity of the sample after the delay time t, is A
=
N,u@[l - exp(- At,)]exp(- At,)
(21
Let t, be the counting time. The detector response relative to this radiation is
Besides this basic case of one reaction producing one isotope, some other situations may occur in 14-MeV NAA. One of these is cyclic activation analysis which is treated extensively in the next chapter. The other frequent cases are the following ones. Two or more reactions produce the same radioisotope as is the case of interfering elements. For example, silicon gives aluminum through the '%i (n,p) 28A1reaction. If phosphorus and aluminum are present in the sample, three other reactions will produce "A1: ''Al(n,y), 31P( n p ) and 29Si(n,d). These reactions are independent. The subscript referring to the different isotopes produced and N to the total number of nuclei of these isotopes (28A1in this case), the following equations can be written.
and
Two or more reactions produce different radioisotopes having the same gamma ray. The reaction and the isotopes produced are independent from each other.
A computer program separates in general, the contribution of each isotope to the total absorption peak from the study of the decay curve. Two reactions produce the same radioisotope at its ground state and a metastable state, the metastable state (m) decays with a certain probability (F%) to the ground state (g). The differential equations:
88
Activation Analysis
and
Special case: if the half-life of the isomeric state is much shorter than that of the ground state, i.e., A, 9 A,, and the irradiation time ti much larger than T,, the expression of N, reduces to:
In this case, N, has the same expression as in Equation 19 where a, is replaced by (F am + a,). If in contrast the half-life of the metastable state is much larger than that of the ground state, i.e., A, < A,, and Ti S T, 9 T,, the expression of N, reduces to:
VI. CYCLIC 14-MeV NEUTRON ACTIVATION ANALYSIS The advantage of cyclic activation analysis over conventional single irradiation shortlived NAA is its better detection limits. When applied in laboratory, the sample is in general mechanically cycled between the neutron source and the counting station. For field applications, such as subsurface logging technique, it is used in conjunction with a pulsed 14-MeV neutron source; in this case, the cycling is electronic and not mechanical; however, electronic cycling may also be used in laboratory. The first experiments with successive irradiations and countings were carried out by Anders in 196V9 and 1961,50in order to increase the signal-to-noise ratio in the detector. The technique using a pulsed source of 14-MeV neutrons and cyclic counting of induced activities was first suggested by Caldwell et al.51in 1966 as part of a combination neutron experiment for remote elemental analyses of lunar and planetary surfaces. Cyclic activation analysis developed further with the use of very fast transfer systems (20 to 30 ms)52-54widening to shorter half-life isotopes the field of application of 14-MeV NAA with mechanical cycling. SpyroP gave a review on cyclic activation analysis in 1980 at the First International Workshop on Activation Analysis with Short-Lived Nuclei.56 In the same workshop, Fanger et aL5' and Dams5' gave two tables containing reactions suitable for cyclic activation analysis. We give also in Table 1 the reactions which are the most favorable for the determination of the elements listed in column one of this table; in these reactions, the half-lives of the isotopes produced are shorter than 1 min. The cross-section values are taken from References 59 and 60.
A. TIME FUNCTION IN CYCLIC ACTIVATION ANALYSIS The mathematical formalism of cyclic activation analysis was developed by Givens et
Volume 11
89
a1.61Let t,, t,, t,, ,t be the times of the irradiations, delays between the irradiations and the countings, countings, and waitings (between the countings and the new irradiations) and let T be the irradiation-delay-counting-waiting cycle time. T
=
t,
+ t, + t, + t,
The detector response for the first counting period being Dl given by Equation 23: D,
=
Dl
+ Dle-AT= Dl(l + ecAT)
and the detector response during the counting period number n is D,
=
~ , (+ 1 e-"
+
+-2"
+ + . . e - ( n - 1~ ) ~ ~
The sum of the terms of Equation 32 is 1 +
e-AT
+
e-2AT
+ ..,e-(n-l)AT =
1 - e-"AT 1 - e-XT
and
The cumulative detector response for n successive cycles is
The summation:
Finally, the cumulative detector response for n successive irradiations-delay-counting-waiting cycles is
Considering that the expression between brackets is equal to g, Equation 37 can be written in the following manner:
The following remarks must be associated with this basic relationship. Dl is the detector response after the first irradiation and g the multiplication factor due to the other (n - 1) cycles of irradiation, g can be written in the next form:
90
Activation Analysis
The first expression nDl corresponds to the summation of the detector responses from n independent irradiations and the second expression:
to the existence of an additional detector response when the cycle length is not long enough, with respect to the half-life T,,,, to assume that the activity becomes zero at the beginning of the following counting. If the number of cycles is significant, e-"'= becomes negligible and Equation 39 reduces to:
The expression between brackets in Equation 40 is of course identical to that in Equation 41. The delay and waiting times must have in general the minimum possible values since is maximum for a given the detector response decreases with these two parameters, D,,, total experiment time nT when t, = t, = 0 and t, = t, = since the optimum number of counts is obtained when ti = t,. The cycle period T that gives the maximum response is dependent on the total experiment time nT. Givens et aL61 considered as an example a case where two short-lived radioactive species with 0.1-s and 1-s half-lives are produced. They plotted the normalized detector response for the activity of these two species as a function of the repetition period T, with and for an arbitrary total experiment time nT = 100 s. They t, = t, = 0 and ti = t, = drew to the following conclusions: 1. 2.
3.
The period T that gives the maximum response for a given radioactivity is highly dependent on the total experiment time nT. The detector response decreases fairly rapidly for a repetition period greater than a few half-lives. The response curve has a maximum which depends on T, T,,,, and nT.
Beyond these general useful remarks concerning the detector response, it must be noted that every problem must be treated specifically. The choice of the value of T, the total time of one cycle, depends on the matrix composition: the other isotopes of the matrix may produce interference or significantly enhance the background. Since the precision of the result depends on the signal-to-noise ratio, the precision is often the parameter that must be maximized and not the detector response. Cyclic activation analysis may also be used for half-lives measurement. For large values of n, (1 - e-nAT)tends to unity and
Volume 11
This is a linear equation relating D,,,,,,, to n. If D,,,,,, line is given by
91
is plotted against n, the slope of the
and the intercept by:
where the ratio:
and, therefore, the half-life of the isotope studied can be deduced from:
Cyclic activation analysis, and high intensity 14-MeV neutron sources widen substantially the analysis possibilities of 14-MeV NAA.
VII. METHOD USING A REFERENCE DIFFERENT FROM THE SAMPLE As discussed in Section IV, the suppression of the monitor and the irradiation of the reference with the sample increases the precision of the analysis. This is possible either by using a double-axis rotator for the sample and the reference or by applying the method using a reference different from the sample which is developed in this section. This is one of the advantages of this method. If a double-axis rotator is used, the sample and the reference must have the same geometry in order to be in the average in the same neutron flux and be located at the same position with respect to the detector. Moreover they must have the same composition so as to have both the same energy flux distribution during the irradiation and the same neutron and gamma-ray self-shieldings. Making such a reference may be simple, difficult, or impossible. It is simple in routine analyses where samples with the same geometry and almost the same composition are regularly analyzed (industrial tests for example). It is difficult when a sample of unknown composition is to be analyzed with good precision. It is easy to reproduce in this case the geometry of the sample but not its composition. This means that a first irradiation with a first rough reference is necessary to have a first evaluation for the composition of the sample. A new reference better fitting the composition of the sample, and a new analysis may be made and repeated until the precision of the result is thought satisfactory. This procedure may require much experimental effort. Making a reference that would be very close in composition, structure, and geometry to the sample is sometimes impossible. For example, when ancient coins are to be analyzed, the density of these coins is different from the density of modem alloys because of the structure modification of ancient alloys due to their long presence in the earth.
92
Activation Analysis
Particularly in the two last cases, when making a reference is either difficult or impossible, the use of the following method will result in a substantial simplification in the experimental work. Moreover, simplification will not be gained against error increase since the main advantages of both comparative and absolute neutron activation analysis methods will be preserved. However, we define the domain of application of this method which does not cover the full range of 14-MeV NAA.
A. THE SELF-SHIELDING PROBLEMS When the sample and the reference are not identical, we have to correct for the differences (in neutron and in gamma-ray self-shieldings) between the sample and the reference. More than 70 papers have used different experimental or calculated methods to take into account the self-shieldings for e ~ a m p l e . ~However, '-~~ in order to be accurate, the total self-shielding cannot be a simple product of the neutron self-shielding times the gamma-ray self-shielding for different reasons: 1.
2.
The neutron self-shielding is not a property of the sample alone, it is a property of the sample irradiated in an experimental set-up. The gamma-ray self-shielding has a special meaning in 14-MeV NAA since we are not interested in the intrinsic or absolute gamma-ray self-shielding but in the change that it produces in the detector count rate.
It is not only a function of the sample itself but also of the detector and counting set-up. Moreover, the activity of the sample is not uniform because of the neutron flux gradient inside the sample. The gamma-ray self-shielding is not, in this case, a property of the sample alone, but of the sample which is irradiated in a defined set-up in a neutron flux and counted in a specific position with respect to a given detector. The use of a reference different from the sample requires the development of a formalism that can take into account not only the differences in geometry and composition between the sample and the reference but also the irradiation and counting set ups.
B. FORMALISM 1. Formalism Relative to the Activation Let us consider Figure 12, a disk neutron source, a cylindrical sample, an elementary surface dZSaround a point S of the neutron source and an elementary volume d3V around a point E of the sample. ES crosses in N the surface of the sample (since a straight line crosses a cylinder in two points, we consider the one located between the point E and the neutron source). The neutrons emitted by dS to reach d3V will be attenuated inside the sample along NE. In order to determine the attenuation inside the sample, two approaches are possible: (1) by considering a certain number of neutrons and by studying their behavior, by Monte Carlo method along NE, or (2) by using the theory of the total macroscopic cross-section for effective removal of 14-MeV neutrons which considers that the attenuation inside the sample has an exponential form. In this case, if I,, is the number of neutrons reaching N along SN, those who reach E are I,, exp( - I: X EN) where I: is the total macroscopic crosssection for effective removal of 14-MeV neutrons. A method has been proposed for 2 determinati~n~~.'~ and has been tested experimentally: the neutron self-shielding X, is defined as the ratio of the activity induced in the sample by a neutron flux and the activity which would have been induced in the same sample by the same neutron flux if there was no selfshielding in the sample. The logarithm of X, varies linearly with respect to E: lnx, = ax, a is a parameter that characterizes the irradiation facilities and configuration and the sample geometry and 2 takes into account the material of the sample. In the case of approach 2,
Volume 11
93
tz
FIGURE 12. A sample and a neutron source. (From Elayi, A. G . , J. Radioanal. Chem., 35, 377, 1977. With permission.)
the Monte Carlo method will be used to solve the multiple integral relating the detector response to the activation parameters. Method 2 will be used in this paragraph since the manner with which 2 is determined gives a direct link between calculation and experiments. Since the sample and the reference have neither the same geometry nor the same composition, the average flux inside the sample and the reference do not cancel. We shall use instead the average value of the intensity of emission of the neutron source by unit time Q which is independent of the sample, reference, geometry, position, and composition; it is a property of the neutron source itself. The average neutron yield is equal to SQ, S being the surface of the neutron source. The flux emitted by the elementary surface dZSof the neutron source and reaching the point E of the sample is72 d2
Qd2S ~IT(ES)'e x ~ ( -2 x EN)
----
Let 0, X , Y, Z, and O,, X I , Y, Z, be two rectangular coordinate systems (Figure 12) located, respectively, at the front face of the sample with respect to the neutron source and on the surface of the neutron source. p, Y, 8 and 5, D, a being the cylindrical coordinates of E and S with respect to 0, X, Y, Z, EN, and ES are, respectively, equal to
where X , Y, and Z are the coordinates values of N which is located either on the plane face or on the cylindrical face of the sample. The total flux, emitted by the sample and reaching the point E is
Let d3m be the mass of the element to be activated in the volume d3V, m its mass in the sample, and d3N, its number of atoms in d3V.
and
94
Activation Analysis
where N,, is Avogadro's number, f is the isotopic abundance, and A,,,, is the atomic weight. The number of activated atoms by unit time in d3V at a time t is
where
The total number of atoms activated by unit time in the whole sample is
[?I
= QmK
ll(,d3V11
;zs;
d2S - AN,
N, being the number of atoms activated in the sample at a time t. Let ti be the irradiation time. The activity of the sample is
Formula 50 gives a convenient way for flux distribution calculation, either in the air, by considering that 2 = 0 or inside a sample as it is shown in Figures 13 and 14. As mentioned in Section IV, many papers deal with this problem either using experimental techniques or calculations. When a monitor or a reference is located behind the sample, either against it (Figure 15) or at a small distance from it, Formula 56 can be adapted to calculate the activity inside the monitor or the reference and if necessary the neutron self-shielding exerted by the sample on the monitor or the reference. Such a curve is shown in Figure 16.73We must note, however, that these are intrinsic self-shieldings; the self-shieldings related to the decrease of the count rates in the total absorption peaks will be defined in Formulas 70 to 72.
2. Formalism Relative to the Detection The activity induced in d3V during the irradiation time ti is77
Let us consider the ray ENiSiSriof Figure 17 which is the central direction of an elementary gamma flux emitted by d3V in the elementary solid angle d2R. This flux is attenuated inside the sample along EiNi. The gamma flux d5N emitted by the elementary volume d3V in d2R is
where d2S' is the elementary surface of the detector that d2R intercepts and a the angle between the direction E,Si and a line perpendicular to the detector surface.
Volume 11
95
Activation Analysis
0.2
O.L Rcm
L
FIGURE 14. Transversal flux variation inside the sample of Figure 13. (From Elayi, A. G., Nucl. Instrum. Methods, 135, 157, 1976. With permission.)
4'
Sample standard
Ncut ron source FIGURE 15. Configuration for a sample and a reference (or a monitor) located behind it. (From Elayi, A. G . , Nucl. Instrum. Methods, 135, 157, 1976. With permission.)
Volume 11
FIGURE 16. Variation of the screening effect with the composition of the sample for the sample and reference configuration of Figure 15. (From Elayi, A. G . , J. Radioanal. Chem., 35, 377, 1977. With permission.)
FIGURE 17. A sample in the detection position in the case of a cylindrical crystal. (From Elayi, A . G . , DOE Symposium Series 49, Department of Energy, Springfield, VA, 1979. With permission.)
97
98
Activation Analysis
The flux transmitted by the sample is (d5N),,,.
=
d3Ad2S'coscu exp( - plr') 4vR:
where pl is the linear gamma-ray attenuation coefficient without coherent scattering of the sample for the energy of the gamma ray under consideration, R, is the distance between the elementary volume d3V and the elementary surface d2Srof the detector, and rr is the distance inside the sample along the direction R,. The ratio between the emitted and transmitted beams cannot give the gamma ray selfshielding as recorded in the total absorption peak. This can be seen from rays E,NIS,S'l and E3N3S3S1,of Figure 17. The latter is highly attenuated inside the sample but has a small path in the detector, whereas the former is almost unattenuated in the sample but has a longer path in the detector. In order to take this phenomenon into consideration, we will consider the gamma-ray attenuation coefficient as the ratio of the number of counts recorded in the photopeak and the number of counts that would be recorded if there was no gamma-ray attenuation inside the sample. The fraction of the flux emitted by d3V in d2Cl which is incident on the detector surface S' and which interacts at least once in the detector is
where p is the linear gamma-ray attenuation coefficient without coherent scattering inside the detector for the energy under consideration and I" the path inside the detector along the direction R,. The number of counts in the total absorption peak produced by the elementary volume d3V is (d3N) = (d3A)
Iexp - Atd(l - exp - At,) 4vA
x G /L,d2Srcos~exp - plr, (1 - exp - pi') R: where I = intensity of the gamma ray under consideration, td = time of the beginning of counting or delay time, t, = the counting time, G = the photofraction, probability for a photon interacting with the crystal to be recorded in the total absorption peak. The total number of atoms recorded in the photopeak is
and the final expression of (N), becomes
X
1 - exp - pi'
R?
Zr ILd2S
Volume 11 K, =
Iexp - At,(l - exp - At,) 4nX
99 (64)
The photofraction can be considered as constant for any point inside small samples used in activation analysis as it has been shown in References 77 and 78. Formula 63 becomes
where 1R (p, p,, 2) is the previous multiple integral. We shall call it the activation integral. A series of test experiments have been carried using the method of the reference different from the sample as well as an application in the field of nurnismati~s.~~ C. SIMPLE HANDLING OF THE FORMALISM
m, K, and K, are common to the comparative and to this method, while the average flux @, the detector efficiency E, and the similarity in geometry and composition between the sample and the reference are replaced by 0, G, and fl(k, p,, 2).The average flux @ is a function of the neutron yield, of the geometry of irradiation and of the composition of the sample. All these factors must be the same in order to have the same average flux in the sample and the reference. In contrast, is a function of the neutron yield only and is independent from the sample and the reference. The differences in geometry and in composition between the sample and the reference, as far as the irradiation is concerned, are accounted for through the multiple integral R(P, p I , 2).We have separated in this way the parameters relevant to the neutron source from those relevant to the geometry of the sample, composition, and to the geometry of irradiation. The situation is the same as far as the detection is concerned. The detector efficiency for the sample under consideration is a function of the detector, the sample (through the energy of the gamma ray on one hand and the composition of the sample on the other), and the geometry of detection. The photofraction G is (within the dimensions of the samples used in activation analysis) a function of the detector and of the energy of the gamma ray; the geometry of detection and the gamma-ray self-shielding are accounted for through the multiple integral p,, 2 ) . In this method, the factors characterizing the neutron source and the detector are separated from those characterizing the sample geometry and composition and the experimental setup for the irradiation and the counting. Let us define the characteristics of the reference which make the previous method easy to apply and yet avoid the necessity of having a sample identical to the reference. 0 is the same for the sample and the reference, G is also the same if the energy of the gamma ray is the same. The cross-section is often known with a poor precision. G and a will be the same if we have the same activated isotope in the sample and the reference: in order to make this method easy to apply, we use a reference containing all the elements (of the sample) that we want to analyze. However, this reference may contain other elements or not contain the elements of the sample that are not to be determined by the analysis, may
G
100
Activation Analysis
have another composition and geometry, may be irradiated in a different position in the neutron flux, and counted at a distance to the detector different from that of the sample. All these differences will be accounted for when computing the integrals as(p, p,, 2 ) and RR(p, p l , 2 ) where the subscripts S and R identify the parameters relative respectively to the sample and the reference. Formula 66 gives if the same element is present in the sample and the reference
, between the sample and the reference. The a,,N,,,, f, (1 - exp - At,), A, I I ~ I Tvanish application of this method is straightforward when
and V R
vs
been computed. As stated before, the multiple integral L ! (p, p,, 2 ) must be computed by the Monte Carlo method. In Reference 77, an internal test stops the program when the precision reaches a chosen limit (a few percent in general); the calculation takes about 30 s with Univac 1100l40 computer. Much care must be taken, however, for the evaluation of the different parameters of the integral. These are related, among others, to the use of precise positioning systems for the irradiation and the counting. It is more important to make an accurate evaluation of the differences between the values of the parameters of the sample and the reference than of the absolute values of the parameters which, however, must be accurate enough. Figure 18 shows the variation of a ( p , p l , E) as a function of the linear attenuation coefficient of the sample p,. The limitations of the method are mainly due to the degradation of the flux inside the sample and the reference. In some cases, this has little effect on the activity induced in the sample and the reference in others, mainly when the cross-section has a threshold value around 14 MeV, this can be important as shown in Section IX.
D. NEUTRON AND/OR GAMMA-RAY SELF-SHIELDINGS AS RELATED TO THE DETECTION COUNT RATES Intrinsic neutron and/or gamma-ray self-shieldings are mainly interesting for shielding calculations whereas in activation analyses, these self-shieldings must be related to the detection count rates as discussed previously. The intrinsic neutron self-shielding has been defined in the first part of this section. The neutron self-shielding as related to the count rate x , , is equal to the ratio of the real count rate and the one which would be obtained if there was no neutron self-shielding in the sample:
In a ( p , p,,O), Z has been given the value 0. The gamma-ray self-shielding as related to the count rate is the ratio of the real count rate and the one which would be obtained if there was no gamma-ray self-shielding in the sample:
Volume 11
101
Do = 2.3 cm 0, = 1.7 cm Diameter, 4 mm Height, 5 cm No shielding
-
FIGURE 18. Variation of the activation integral 0 (p, p , , 2 ) as a function of the gamma-ray linear attenuation coefficient without coherent scattering. (From Elayi, A. G., DOE Symposium Series 49, Department of Energy, Springfield, VA, 1979. With permission.)
p, has been given the value 0 in a(p, 0,
2).
The neutron and gamma-ray self-shieldings as related to the detection count rate in the detector are equal to:
where the zeros have the same meaning as previously. Figure 19 represents the variations of the neutron and gamma-ray self-shielding as a function of p,.
VIII. CHOICE OF THE IRRADIATION, DELAY, AND COUNTING TIMES The choice of the irradiation, delay, and counting times depends on the facilities available in the laboratory, the composition of the sample, and the parameters to optimize. The choice related to the facilities available in the laboratory concerns the procedure of the analysis: single irradiation, a few successive irradiations and countings, cyclic irradiations, etc. The choice related to the composition of the sample concerns the detected radiation. Are there interfering radiations from other elements and do we want to privilege one of the elements? Do we want to minimize the signal-to-noise ratio? Etc.
102
Activation Analysis
C
=
0.2cm-'
p = 0.234 cm-'
Do = 2.3 cm
-
Dl = 1 . 7 c m Diameter, 4 mm Height, 5 cm No shielding
-
FIGURE 19. The neutron and gamma-ray self-shieldings as related to the reduction of the count rate in the total absorption peak. (From Elayi, A. G . , DOE Symposium Series 49, Department of Energy, Springfield, VA, 1979. With permission.)
The third choice concerns the parameters to optimize. Is it the detector response or the signal-to-noiseratio? Do we want to have the optimum response for a specific total experiment time or do we want to have the largest response for a specific time of irradiation? Do we want to get the best possible sensitivity?
A. CHOICE OF THE IRRADIATION TIME 1. General Case Let A,, A,, and A, be the activities induced in a sample if the irradiations times were successively t,, ti + Ati, and At,; A, e-"b, A, ecAb,and A, e-"h the activities after a delay time t,; and Dl, D,, and D, the corresponding detector responses for a counting time t,. To compare the effect of At, in the two cases, we study the ratio:
(D, - D,) being the increase in the detector response when the irradiation time increases from ti to ti + At, and D, the detector response for an irradiation At, performed alone. Since a detector response D, is of the next general form (Equation 23)
the ratio is equal to: R = e-"; meaning that two successive irradiations give a larger detector response than a single irradiation with the same total irradiation time. For example, let us compare after an irradiation time 112 T,,, the next two cases: Continue the first irradiation up to TI,,. Perform a next irradiation with a time of irradiation 112 T,,,.
Volume 11
103
The ratio R between the detector responses due to the previous cases a and b is exp - hT112= 0.71. We must, however, note that in the second case, the total experiment time
2 is longer than the first one by (f,,,,, t, t,). We have assumed that the activity is negligible at the beginning of the irradiation. We can also compare the total detector responses after:
+ +
a single irradiation with an irradiation time 2t two irradiations with an irradiation time t In this case, the ratio of the detectors responses for the last cases is
if t = 112 T,,, as in the previous case, R' = 0.85. The choice of the irradiation time in the case of cyclic activation analysis is treated in the specific chapter.
2. Choice of the Irradiation Time in the Case of Interfering Elements In some cases, the radioisotopes produced by two reactions emit, by disintegration, the same radiation (the same gamma ray for example). This is the case: When the two reactions produce the same isotope. In such a case, we cannot determine the contribution of each reaction to the total absorption peak. An indirect evaluation of the contribution of one of the isotopes is necessary. When the two reactions produce two isotopes a and P with different half-lives (that we call T, and TB). In this case, the contribution of the radiations from a and p to the total absorption peak can be separated and the activities of a and @ determined by studying the decay curve of the radiation of interference issued from the source. The choice of the irradiation, delay, and counting times, plays an important role as far as the relative contribution of the two isotopes to the total absorption peak is concerned. Our aim is to optimize these parameters. Let No,, No,, a,, a,, I, and IP be the number of atoms, the cross-sections, and the intensity of the radiation from a and p. If for example we want to study isotope a and if the product N, X a, X h is much smaller than NOpX u p X Ip we choose the irradiation, delay, and counting times in order to have a maximum contribution from isotope a. We assume that at time t = 0, A, and Ap are both equal to zero (the samples are not yet activated) and we want to choose the irradiation time, t,, in order to privilege isotope a for example. The rates of variation of isotopes a and P are both functions of the time of irradiation and we can have two possible cases:
Case 1: at a moment during the irradiation that we call isotope a becomes equal to that of isotope
6 , the rate
of variation of
P.
Case 11: such a moment does not exist during the irradiation. Case I - the rates of variations of isotopes a and
p, i.e., dNO and dt
dN are equal to dt
104
Activation Analysis
If these two rates are equal at a time $, the value of t, is such that
t, exists if the second member of Equation 78 is positive. This is the case if Ia lnNOaa, - lnoPa, > 0
A, - Ap > 0
and
or if Ib InN,u,
- InNoBuP< 0
A, - hP < 0
and
this reduces to either I'a N,u,
> Nopa,
and
A, > A,
N,a,
< Nopap
and
h,
or to I'b
< Ap
dN, dN If we plot - and as a function of time, the curves representing these two functions dt dt will have their crossing point at P dividing the space into two areas: area I with t S t, and area I1 with t 2 t,. Case Ia - If N,a, > Nopupand A, > A, or T, < T,, this means that in area I, the rate of variation of isotope a is higher than that of isotope P and it is interesting to choose the time of irradiation in region I: ti should be such that ti S $, in order to privilege isotope a. If ti becomes greater than t,, the rate of variation of isotope p becomes higher than that of isotope a. Case Ib - If a, No, > a, No, and A, > A, or TB < TA, this means that the rate of variation of isotope p is higher than that of isotope a up to a time of irradiation equal to t, and then the rate of variation of isotope a becomes higher. It is interesting in this case to choose a time of irradiation larger than t, in order to advantage isotope a. Let us consider as an example the irradiation of a sample containing copper and silver and let us consider the 51 1-keV gamma ray, produced by the 6 2 Cfrom ~ the reaction 6 3 C ~ (n,2n) 6 2 Cand ~ by lMAg from the reaction lo7Ag(n,2n) lMAg. Let a be the silver (lMAg) TAeand TCuare equal to 23.96 and 9.73 min. Let us assume that and p the copper (62C~). No, = the ratio In . our sample, a , , = 800 mb and u,, = 500 mb. NKU 2
In this case, t, exists and its value is equal to 7.25 min.
Volume 11
105
Remark 1 - It is evident that these equations are not of straightforward use; they can lead sometimes to utopian situations from the physical point of view. One has to compare, for example, t, with the half-lives T, and T,. If for the previous case Ib, the time of irradiation ti must be larger than t, and if t, is equal to some half-lives of the isotope a, this condition is meaningless from the physical point of view. One must also take into account the fact that the activity must be in all cases large enough to produce reasonable statistical errors. Remark 2 - We must also be aware of the fact that the aim of the analysis is to determine No, and NOD.However, even if they are not known at the beginning of the analysis, the formulas developed will be helpful when we can estimate N, and No,. We conclude that a serious increase of the precision can result from a good choice of the irradiation time. Case I1 - The rates of production of isotopes CY and P are never equal. This happens in two cases, IIa
and IIb
In these cases, t, is negative in Formula 78 and of course such a time cannot exist. In the first case, IIa, whatever the irradiation time chosen, the rate of production of isotope u is higher than that of isotope P. In contrast, the rate of production of isotope P is higher than that of isotope u whatever is the irradiation time used in case IIb. If we consider again the case of 6 2 C and ~ lo6Ag and if No,, = 2 N,, t, does not exist. The ratio of the rates of variation of isotopes a and P is
If X, > A,, y is always increasing and if A, < A,, y is always decreasing. We choose a long or a short time of irradiation according to whether we want to maximize or minimize Y.
B. CHOICE OF THE DELAY TIME The choice of the delay time depends on many parameters; however, we study it here as a function of the interfering elements. In some cases, this choice is simple, in others it is difficult and a systematic study is of great help in all cases. The detector responses, as given by Equations 23 for isotopes a and P, are e - A,")
and
We note that we do not take into account the self-shielding. If necessary this may be included by using the appropriate formula. The rates of emission of isotopes u and P being functions of time, we have, here again, two cases. In case I, at a time that we call ti the rate of
106
Activation Analysis
emission of isotope a becomes equal to that of isotope P. In case 11, such a moment does not exist. Case I - The rates of emission of isotopes a and P become equal at the time (,, in which case ti is such that
6 exists if the second member of Equation 78 is positive. This is the case if Ia
and
In case la, the activity of isotope a is larger than the activity of isotope P between the end of the irradiation and time (, and then the activity of isotope p becomes larger. In this case, it is interesting to take a short delay time and to perform the different countings before time t;, in order to advantage isotope a. In case Ib, the activity of isotope a is smaller than that of isotope P between the end of irradiation and tb. In this case, and provided we want to privilege isotope a,it is interesting to have a delay time equal to t, = (,. However, one has to take into account, as we said in the previous remark, the physical point of view and consider the statistical errors that may take place when t, is relatively long. Case I1 - The rates of emission of the interfering elements are never equal. Here again two situations are possible. IIa
and IIb
In case IIa, the count rate for isotope a is always larger than for isotope P and is in contrast always smaller in case IIb. The choice of the delay time can be made, on the basis of the other requirements. We can consider the ratio y of the detector response for the two isotopes.
Volume 11
107 (95)
where
and
If A, 1 A,, the delay time should be as short as possible to privilege isotope a. dy/dt is always positive and the ratio (y) is always increasing. If A, < A,, dy/dt is always negative and the ratio y is always decreasing. The delay time must be long if we want to privilege isotope a.
C. CHOICE OF THE COUNTING TIME The counting time must be chosen in each case so as to be consistent with the delay time t,. In the absence of interferences, the limit of detection may be set by comparing the count rate with the noise from the matrix. In the case of interfering elements, the previous study concerning t, holds for the counting time since we can choose it according to whether we want to provide isotope a and Q as mentioned. However, these formulas may be meaningless if they are not subordinated to the physical reality of NAA (comparison of delay and counting times with TI,,, statistical errors, etc.).
IX. PRECISION OF 14-MeV NEUTRON ACTIVATION ANALYSIS Error evaluation is a matter of concern for all analysts and is treated more or less explicitly in most papers. Some of these are exclusively devoted to the evaluation of prec i s i ~ n . ~ ~ - ~is" tpossible to separate the errors into two categories, errors relative to the method itself and errors due to the specific problem under investigation. These may be due to the undefined shape of a coin, to a high background, or any other reason; they cannot be studied specifically but in general terms only. In contrast, we can focus better upon the different parameters related to the method itself, study their influence upon the precision of the result of the analysis, and give an estimate for these errors for specific examples. This will place some emphasis on the critical parameters influencing the precision of the method. The following formulas hold for both classical methods and the one using a reference different from the sample.
A. PROCEDURE AND PARAMETERS STUDIED A standard or a reference being commonly irradiated with the sample in 14-MeV NAA, some differences do exist between the sample and the reference, and the errors due to these differences must be assessed. If the method using a reference different from the sample is applied, we have to measure the parameters of the activation integral a(p, p,, C) and the errors due to these measurements must also be evaluated. The error calculation is difficult to perform; for example, if we position the sample with respect to the detector for counting its activity and then repeat the same operation for the reference and even if they have almost the same geometry, there will be some difference in their distance to the detector, ranging
108
Activation Analysis
from a fraction of a millimeter to a few millimeters. The relative error produced by this shift in positioning the sample and the reference is a function of the distance, among other factors; its evaluation is not straightforward. Nevertheless, whatever the procedure used in 14-MeV NAA, it will give a relation between the number of counts in the total absorption peak N, and the weight of the element studied in the sample m, on one hand and a similar relation between N, and rq, (the parameters of the reference) on the other. Some parameters will cancel between the sample and the reference; however, they must not be excluded from error study unless they are rigorously equal for the sample and the reference. For the other parameters Xi, mathematical formulas will be derived whenever possible from Equation 66 to estimate the error Am, relative to m, due to the error AX, relative to parameter Xi. For the cases where such a formula cannot be derived, the values of m, for two close values of the padmeter Xi will be calculated: the difference AX, between the two values of the parameter X, will be considered as the error relative to this parameter (experimentally, this can be the difference between the values of this parameter for the sample and the reference), while the difference Am, between the two calculated values of m, will be considered as the error relative to m,. When we have performed such calculations, we have considered cylindrical samples, 2 mm in diameter and 5 cm in height, a disk-shaped neutron source 1.6 cm in diameter. The linear attenuation coefficient of the gamma ray in the 7.5-cm x 7.5-cm crystal of the detector is 0.234 cm-' and in the sample 0.17 c m l . The total effective removal cross-section for 14-MeV neutrons is 0.12 cm-'. The distance between the sample and the detector is 2.5 cm. The axis of the sample is parallel to the surface of the neutron source. The sample is located at a distance of 2 cm from the axis of the neutron source and 2.3 cm from the surface of the neutron source. This configuration is typical when the sample and the standard are rotated with respect to the neutron source (double rotation) as described in Section IV. In the following section, m and Am will be used instead of m, and Am,.
B. ANOMALOUS ISOTOPIC ABUNDANCES Variations in isotopic abundances of a few percent have been reported by different authors. Since this is a multiplying factor in Formula 66, we can evaluate it easily.
Variations in isotopic abundances have been evaluated for the next elements: boron (3 to 4%) by Thode et a1. ,89sulfur (4% in the 32S/33S ratio and 8% in 32SI"S ratio) also by Thode et al.90and natural relative isotopic abundance of 4 8 C ~ 9(several 1 percent variations). Duckworth9' showed that the following elements have anomalous isotopic ratios: Ar, Sr, Sn, Ba, Ce, Nd, Yb, Hf, Os, TI, Pb, and the heavier elements. De Soete et aL6 reported
Besides the expensive enriched mixtures, the depleted ones are also sold and often without adequate warning that the product concerned is of a different isotopic composition." Such a difference is reported by De Goeij et a1.93who measured Li isotope ratio in a number of commercial preparations. Four samples out of nine had a very abnormal isotopic composition. Fractionation on an ion-exchange column probably induced some changes in isotopic abundance as mentioned by S a ~ t i for n ~ IS2Gd. ~
C. INFLUENCE OF THE NEUTRON AND GAMMA-RAY SELF-SHIELDING In this section, the influence of a difference of composition between the sample and the reference on the precision of the analysis is studied, assuming that all the other parameters are equal.
Volume 11
109
The difference in composition between a sample and a reference results in differences Ap and AC in the values of their gamma-ray linear attenuation coefficient p and of their total macroscopic cross-section for effective removal of 14-MeV neutrons 2,respectively responsible for their gamma ray X, and neutron xn self-shieldings. We consider that they are of the form
where X,, is a function of the geometry of the sample, the geometry of irradiation, and the surface of the neutron-source. X:, is a function of the geometry of the sample, the geometry of counting and the detector used. xn and X, are the ratios of the real count rate recorded from a sample and the count rate which would have been recorded from the same sample if there was no neutron or no gamma ray self-shielding. Equation 100 is valid in general for the samples used in activation analysis while Equation 101 is at least valid for a small interval around p . Let us call Am, and Am,, respectively, the errors in the determination of m due to the differences AC and Ap; A& and Am, are given by
AS1(p,pI,~)Z and AS1(p,pI,~),are the variations in the values of the activation integral fl(p,pI,e) due to variations A2 and Ap. From Equation 1 of Appendix I we get
We conclude from Equations 102 and 104 that the percent error Am,lm is equal to the percent error A z/C multiplied by lnx,. For cylindrical samples of 1 or 2 cm in diameter, Inx, is of the order of 0.2 (or less). The corresponding relative error in the determination of the mass m is about five times smaller than the relative error on C (i.e., the relative variation of the value of 2 due to the difference in composition between the sample and the reference). For the case of the gamma-ray self-shielding we have
lnx, may take much larger values than Inx,, especially for heavy elements and low energy gamma rays. Serious corrections for gamma-ray self-shielding may be necessary and may induce very important errors in some cases.
D. INFLUENCE OF THE POSITIONING OF THE SAMPLE AND THE REFERENCE WITH RESPECT TO THE DETECTOR If a reference and a sample which are identical are to be placed at the same distance, d, to the detector when measuring their count rate, and if in fact there is a difference of
110
Activation Analysis
TABLE 2 Activation Integral as a Function of the Sample to Detector Distance Sample to detector distance (cm)
Activation integral ( X lWcm3)
Note: Variation of the activation integral as a function of the distance d between the sample and the detector. The effect of a 1-mm change in the distance is shown for each value of d.
1 mm between their distances to the detector, we make an error A m,, in the evaluation of m. This error depends upon the value of d. We have calculated A m, for the sample described in part B of this section and for different values of the distance d, using the activation integral f l ( p , p , , ~ )(the count rate is proportional to f l [ p , p , , ~ ] ) The . results are shown in Table 2. An error of 1 mm in position may produce a 5% error in the result when the sample is located near the detector. It is also worthwhile to note that this problem can be encountered in many situations: when we study the reproducibility of an analysis for example, we introduce an error in repositioning the sample with respect to the detector.
E. INFLUENCE OF THE POSITIONING OF THE SAMPLE AND OF THE REFERENCE WITH RESPECT TO THE NEUTRON SOURCE The distance r between the sample and the neutron source is also a critical parameter as far as precision is concerned when its value is relatively small (from a few millimeters to a few centimeters). If an error Ar of 1 mm is introduced when positioning the sample or the reference, the corresponding relative error of measurement is of about 4% for r = 2.3 cm and for a sample and a neutron source having the features described formerly. This error can be larger for r = 2.3 cm when a smaller sample and neutron source disk are used. If these are small enough to be considered as punctual, we can use the formula; Am, 2Ar - - m
r
When a system for rotating the sample and the reference with respect to the neutron source is used, the sample and the reference may be located side by side with respect to the neutron source. Their axes, when they are cylindrical, will be parallel to the surface of the neutron source. In this case, these axes will be located at a distance r perpendicular to the surface of the neutron source and ro perpendicular to the axis of the neutron source. An error of 1 mm in the value of ro introduces a few percent error in the measurement of m for the sample as described above. In short, the positioning of the sample and the reference must be reproducible to a small fraction of a millimeter when the sample or the reference is located near the detector or the neutron source. This is an essential condition for performing precise 14-MeV neutron activation analysis. Absolute precise distance measurement is required when calculations are to be made.
Volume 11
111
F. INFLUENCE OF THE IRRADIATION TIME Since the activity A induced in the sample is proportional to the irradiation time.
an error A ti in the duration of the irradiation will produce an error A A in the activity of the sample:
This relative error is the same for the sample and the reference if they contain both the same element to be studied (of period T) and it cancels between them. In contrast, the error relative to the counting time is different for the sample and the reference.
G. INFLUENCE OF THE COUNTING TIME The detector response D is proportional to (eCAtl- ePAt2), where t, and t, are the times of the beginning and end of the counting
An error dt, relative to t, and dt, relative to t, produce an error dD
(a) general case: if dt, = A t,; dt, = A t,
(b) Particular cases: (i) if )A t,l = JA t2( = At
(ii) i f h t, 6 1 and At, 4 1 andA t, = At, = A t -AD =-
D
2At It, - t2l
(iii) If dt, = dt, = At, meaning that the time of counting is defined without error but the starting and stopping times of counting are both shifted by the same period of time At, the error formula becomes:
H. INTERFERING GAMMA-RAY AND NUCLEAR REACTIONS 1. Interfering Gamma Rays Two isotopes and sometimes more, may produce the same gamma-ray energy (especially
112
Activation Analysis
the 51 1-keV gamma ray) or energies too close to be separated. In such a case, a decay study of the ray of interest is necessary to separate the contribution of the two interfering isotopes to the total gamma ray. A computer program, such as the one which has been used in Reference 80, may control the whole starting-counting-waiting-spectrumtransfer into the computer - starting a next counting, etc. sequence, minimizing handling errors. Precise mathematical treatment to separate the contributions of the two isotopes to the total absorption peak is only possible if enough care is taken when applying the mathematical formulas (an error of few percent or less can be obtained). 2. Interfering Nuclear Reactions (n,y) reactions on an element Z and (n, 2n), (n,p), or (n,a) reactions on elements Z, (Z + I), and (Z 2) may produce the same isotope. In this case, decay study is useless. It is possible to determine the contribution of an interfering element by evaluating it from another ray or another reaction on this element. Though treated in many papers, this problem is discussed extensively in the next ones: nitrogen interference^,^^-^' oxygen one^,^^-'"^ total body countings,"''' multielement treatment. ln5-lo9 Secondary reactions (induced by gamma rays or charged particles available from [n,?], [n,p], [n,a]) and second order reactions (due to the enhancement or the decrease of the amount of the studied isotope because of nuclear reactions) have been considered as negligible in 14-MeV NAA; however, with the use of intense fluxes, it may become necessary to take these reactions into account in some cases.
+
I. BEAM DEGRADATION INSIDE THE SAMPLES Throughout this chapter we have stressed the fact that the beam degradation must be the same in the sample and the reference. The purpose of this paragraph is to show that in some cases, especially when the threshold of a reaction is around 14 MeV, the beam degradation may induce important errors.
1. Choice of the Reaction The reaction 54Fe (n,2n) 53Feis dependent upon the experimental conditions through beam degradation in the sample since its cross-section decreases very sharply around 14.5 MeV and becomes zero at about 13.8 MeV (see Figure 5). Since errors due to measurements performed in different conditions may be larger than the phenomenon to be studied, we have chosen a reference reaction taking place also in iron, that is 56Fe (n,p) 56Mn;the crosssection of this reaction increases very slightly around 14.5 MeV and thresholds at about 7 MeV. The main gamma rays produced by 53Feand 56Mnare 51 1 and 847 keV. The ratio of the activities produced by the two reactions will depend upon the experimental conditions under which they are performed because if a neutron of energy E (14.5 MeV for example) undergoes an elastic scattering inducing a loss of energy equal to AE and reaches a point M, its cross-section at this point depends upon the new value of its energy (i.e., E - AE). ~ If for example AE = 0.8 MeV, its activation cross-section for the 54Fe(n,2n) 5 3 Preaction will be equal to zero while it will be almost unchanged for the 56Fe(n,p) 56Mreaction. The ratio R of the activities induced by the (n,2n) and the (n,p) reactions will depend upon the neutron spectrum inside the sample. In the following experiments, we will measure this ratio R and show that its dependence upon beam degradation can be important.
2. Experimental Technique The aim of the experiment is to measure the ratio of the 5 111847-KeV gamma rays in the two following cases: 1. 2.
When the neutrons reach the sample without interactions When the neutrons reach the sample after having interacted within a specific shield
Volume 11
FIGURE 20.
113
Sample and shield configuration
In practice, a part of the neutron beam reaching the sample undergoes, in all cases, a certain number of interactions; however, we add a certain shield and we study its effect on the 51 11847-keV gamma-ray ratio. We proceeded experimentally as follows: in a first experiment, we compare the activities of 53Fe and 56Mn through the 51 1- and 847-keV gamma-ray peaks in thin samples. In a second experiment, we compare the same activities in thick samples. A variation in their relative value means that the activation cross-section has varied, provided that the problem of the gamma-ray self-shielding in the samples has not interfered. In order to avoid such an interference, we proceed as follows: we irradiate a thin, rigid iron wire in a 14-MeV neutron flux and we determine the ratio R of the activities from the 51 1- and 847-keV gamma ray peaks. We surround the same wire with a cylindrical shield and we irradiate it again in the same neutron flux. We remove the shield during the counting. The ratio R, of the activities measured from the 51 1- and 847-keV gamma-ray peaks is also computed, thus avoiding the problem of the gamma-ray self-shielding. The importance of the difference between R and R, measures the importance of the phenomenon of beam degradation. The samples, in the form of rigid iron wires, were 1 m n in diameter and 50 rnm high. They were irradiated in a double-axis rotational system described in Section IV using a sealed tube Kaman A 71 1 neutron generator. In order to fix the sample on the axis of the container, we use two perspex disks having the same diameter as the container (23 mm). Their thickness was 2 mm and they were partially hollowed at their center. This system fixed the samples as shown in Figure 20. The samples were irradiated for 500 s and the ratio R of the 51 11847 keV gamma-ray peaks was computed using a 3 in. x 3 in. NaI detector with the associated electronic circuitry. After sufficient delay to allow the 847-keV gamma ray to decay, we surrounded the samples with different shields consisting of cylinders of specific materials having a hollow in their center where the sample can fit exactly. These shields could have different external diameters; however, they were fixed around the samples which were fixed on the axis of the container by the two perspex disks shown in Figure A of Appendix; this cylinder was removed for counting. The ratio R, of the 51 11847-keV gamma ray was again computed. Due to the high accuracy required for these measurments, very precise geometrical positioning of the sample relative to the detector was made. The samples alone have been irradiated and the ratios R, of the 5111847-keV gammaray peaks have been computed from the average value of several irradiations. We then irradiated the samples after having surrounded them with different shields of different materials. Several experiments were performed for each material by changing the diameter of the shields. Shields 7, 10, 16, and 23 mrn in diameter were used; 2, 3, or more irradiations with the 23-mm diameter shields were performed.
114
Activation Analysis
TABLE 3 Activation Ratio from Two Reactions in the Same Shielded Sample as a Function of the Composition of the Shield Material of the shield
Carbon
Aluminum
Iron
Copper
Lead 0.99
TABLE 4 Elastic Cross-Section, Relaxation Length, and Logarithmic Decrement for the ~tudied~lements Element Carbon
Atomic weight 12.01 1
Elemental density
(b)
f
A cm
2.25
0.72
0.158
11.2
0.67
1.2
0.072 0.035
24 10.2
1.45 2.8
0.031 0.01
8.44 10.1
cr,
(graph)
Aluminum Iron Copper Lead
26.982 55.847 63.546 207.19
2.702 7.865 8.92 11.3
The shields used were perspex, carbon, aluminum, iron, copper, and lead. The average values of the ratios R, of the activities from the 51 11847-keV gamma-ray peaks alone and with different shields are shown in Table 3; the number of irradiations was carbon, 6 irradiations; aluminum, 15 irradiations; iron, 8 irradiations; copper, 5 irradiations; and lead, 7 irradiations. As expected, the difference between the ratios of the 51 11847-keV gamma-ray peak is larger for heavy elements. However, we can conclude from these experiments that this difference is small in the case of iron, copper, and lead and is significant in the case of aluminum and carbon. The results concerning perspex are not reproducible and are not reported. For the five elements studied the elastic cross-section, the relaxation length and the logarithmic decrement are shown in Table 4. It is clear that the example which we have chosen in this study is a critical one since the variations of the cross-section are very sharp around 14.5 MeV. However, it points out very clearly that care must be taken when the activation cross-section varies sharply around 14.5 MeV and when the matrix consists of light elements. In such special cases, the neutron self-shielding does not depend only upon the composition and geometry of the sample, but also upon beam degradation inside the sample.
J. OTHER FACTORS INFLUENCING THE PRECISION Some other factors, not specific to 14-MeV NAA, may also influence the precision of the results, such as statistical errors, dead-time corrections, or errors related to chemical separation or surface decontamination. However, these subjects are out of the scope of this chapter.
X. CONCLUSION What development can be expected in the future for 14-MeV NAA? The constructors develop neutron sources with high fluxes either through classical type Van der Graaff accelerators or through sealed-tube generators. These generators aim to make the analyses on the site when the object to be analyzed cannot be brought into the laboratory.
Volume I1
115
The construction of systems producing much more than 1013n/s for the analysis is costly and will probably not be achieved unless there are reasons to justify the high technological effort to construct them. Neutron generators are used in industrial plants: analysis of oxygen in aluminum for example. This type of utilization may develop in the future because accurate and quick results may be obtained when enough calibration effort is made; this effort is to be made once only. Studies of fusion reactor neutronics (radiation damage, tritium breeding ratio, neutron multiplication, etc.) have recently i n d ~ c e d " ~ ~and " ' will probably still induce much work. However, in order to make activation analysis applicable on a large scale, this method must become full: automated. This is possible if the method using a reference different from the sample is applied after it has been adapted for such utilization.
APPENDIX CROSS-SECTIONS FOR 14-MeV NEUTRON ACTIVATION
ANALYSIS 14-MeV neutrons can induce the following reactions: (n,y), (n,nr,y), (n,2n), (n,p), ( n p ) , (n,d), (n,t), (n,'He), (n,2p), (n,nlp), (n,nla) and, in the heaviest nuclei, (n,3n), and fission processes. Figure A shows a plot of 14-MeV neutron-induced nuclear reactions on medium and heavy mass nuclei from Reference A. However, only (n,2n), (n,p), and (n,a) reactions have been extensively studied so far. Compilation concerning their cross-sections has been regularly updated. In 1987, Manokhin et al.B published a compilation of fast neutron-induced activation reactions cross-sections, covering energies from threshold to 20 MeV. Body et al.c published in the same reference the results of the compilation of QaimD and of Bychkov et al." These compilations take into account the previous ones, such as those of References F, G , and H, and the different publications and neutron cross-sections files of individual, national, and international libraries. Table A contains 14.5-MeV crosssection values from Reference D; however, (n,2n), (n,p), and (n,a) cross-sections have been taken from Reference E when they are issued from an excitation function. These values have been published in Reference C.
116
Activation Analysis
I
'
50
. . . .
-
l
.
.
,
.
,
,
,
.
.
,
.
.
,
200 Moss number of the target nucl~de 100
150
FIGURE A. Relative contribution of nuclear reactions induced by 14-MeV neutrons. (From Qaim, S. M . , Proc. Conf. Nuclear Cross-Section Technology, NBS Special Publication 425, National Bureau of Standards, Washington, D.C., 1975, 664. With permission.)
TABLE A Activation Cross-Sections for the Formation of 14.5 MeV Neutron-Induced Major Nuclear Reaction Radioactive Products nuclide
Product
Cross-section
Cross-section
Product
Product
Cross-section
Product
Cross-section
(Tm)
Product (Td
'H (12 35 year) 'H (12.35 year)
6He(0.8 s)
'H (12.35 year) 6He(0.8 s) 8Li(0.84 s)
(5736 year) 'jC(2.5 s)
77
?
14
38
_t
3
I4C (5736 year)
40 i 3" 5.5 i 2
l6N(7.1 s)
2.3 i 0.5
17N(4.2 s)
(5736 year) ~ ( 5 S) 2 (5736 year)
I8F(110 rmn)
12Na(2.6year)
26A1(6.3s)
I6N(7.1 s)
33
+ 7=
Cross-section
TABLE A (continued) Activation Cross-Sections for the Formation of 14.5 MeV Neutron-Induced Major Nuclear Reaction Radioactive Products nuclide
Cross-section
Product
256 + 20" 1 2 9 + 15 95 + 20
28A1(2.2min) 29A1(6.6 min)
Cross-section
Product
Cross-section
Product
(% abundance)
28A1(2.2 min) "Al(6.6 min) 30A1(3.3 s)
27Mg (9.5 min) 28~1(2.2 min)
q ( 2 . 5 min)
134
+ 67a 32Si(280 year)
'%(87.5 d) 34C1(1.5 s) %TI (32.0 min) 37S(5.1 min) 37Ar(35.1 d) j9Ar (269 year) 38K(7.7 min) 38K(0.93 s)
)'%Z1(37.2 min) q l ( 1 . 3 min) 3.5 + 0.3 0.8 r 0.2
39Ar(269 year)
75 -c 1.5 16 + 2 354
+ 54
39C1 (56.0 min)
4oK(0.012) TI,': 1.28 x lo9 year 4'K(6.7)
18501 920 + I80
44K(22.2 min) *K(1.9 min) 48K(9 s)
153
?
20P
101
+
13
39 52
+ 4a +
18)
ISa
1.6
+ 0.2
35S(87.5 d) "S(5.l min)
38c1 (37.2 min) 37Ar(35.1 d) 39Ar (269 year)
33.5
t
2'
115 + 3Sa 1901 )~AI (269 year)
42K(12.4 h) 43K(22.2 h) 45K(16.3 min) 47K(17.5 s)
41Ar(1.8h) 4 3 ~ r ( 5 . min) 4
36+Sa 21 t 6'
42Ar(33 year) @Ar (1 1.9 min)
Cross-section
""Sc(3.9 h) MmSc(2.4d) 45Ti(3.1 h)
182 ? 15 116 -t 23a 39.4 +
45Ca(163 d) *Sc(84.0 d) *"'Sc(18.7 S) 47S~(3.4 d) %c(43.7 h) 49Sc(57.2 min) %c(l.7 min)
49V(330.0 d)
16.5 r 38
13501
49S~ (57.2 min)
51Ti(5.8 min) "CI (42.0 min) 5'Cr(27.7 d)
"Mn(312.2 d) 53Fe(8.5 min) 5SFe(2.7year)
58Co(70.8 d) 58mCo(8.9h) 57Ni(36.0 h)
20 357
809 8 440
+ 4= +
301
+ 35a + 1.6 + 40
52V(3.7 min) 53V(1.6 min) "V(43 s) 55Cr(3.6 min) "Mn(312.2d) "Mn(2.6 h) 57Mn(1.7 min) 58Mn(65 s)
788 ? 230. %e(44.6 d) 473 + 1401 58Co(70.8 d) 30 r 3a 58mCo(8.9h) q o ( 5 . 3 year) 60mCo(10.5 min)
102 + 48 2 18 r 44 1 365 -t 106 ? 56 2 7+
%1(12.7h)
52V(3.7 min) 53V(1.6 min)
12 3
?
3
5bMn(2.6h) 57Mn (1.7 min)
11
+ 2.4
+ 0.8
"Ti(5.8 min) 52V(3.7 min) "Cr(27.7 d)
Wr(3.6 min)
60 r 10. 526 r 45
85
b3Ni (lOO.0 year) 'Qu(9.8 min)
20a 7 3 13' 30a 30s l6= 1.5
-C
25=
22 r 7. [25]
55Fe(2.7 year)
-0
(10.5 min) b1co(1.6 h) b 3 ~ o ( 2 7 . s) 5
7 2 1.4 15 ? 1
59Fe(44.6 d) b1Fe(6.0 min)
[I0501
b2Co(14.0 min) MCo(0.4 s)
+
63Ni(100.0year)
q o ( 5 . 3 year)
40 r 1
21 r 6'
b5Ni(2.5h)
60mCo (10.5 min) b2Co (14.0 min) 6?0(l.5 min)
550
lla
%8+30a
7.2 2
+
2.1a "Co(1.6 h)
+ 0.5
TABLE A (continued) Activation Cross-Sections for the Formation of 14.5 MeV Neutron-Induced Major Nuclear Reaction Radioactive Products Target nuclide (% abundance)
Product (Tuz)
Cross-section (mb)
Product (Tud
642n(48.9) %n(27. 8)
(38.4 min) 65Zn(244.0d)
Cross-section (mb)
Product (TIIZ)
178
?
27= 64Cu(12.7h)
690
+
70a
Cross-section
Product
MCu(5.l min)
67Zn(4.1)
67Cu(61.9 h)
66Cu(5.1 min)
68Zn(18.6)
"Cu(30 s) "Tu(3.8 min) 7"Cu(42 s)
67Cu(61.9 h)
7@Zn(0.62)
69zn (56.0 min) %n(13.9 h) %a (68.3 min) 7"Ga (21.1 min)
Cross-section
Product
Cross-section
63Ni (100.0 year)
[271
Product
63Ni (100.0 year) 65Ni(2.5h)
11.6+2.3a
754 + 96 7"C~(5s) 945 + 501 %n(56.0 min)
1146
?
69m~n(13.9 h) 70" 71mZn(3.9h) 7'Zn(2.4 min)
605 1022
? ?
40a 7"Ga(21.l min) 3001 72Ga(14.1h) 8
5
1.5 69zn (56.0 min) *Zn(13.9 h)
74Ga(8.3min)
73Ga(4.8h) 75Ga(2.1 min)
7'Zn(3.9 h) 71Zn(2.4min) 73Zn(23.5s) 72Ga(14.1 h)
73As(80.3d)
71Ge(11.2d)
Cross-section
76As(26.4 h) 77As(38.8 h)
79As(8.2min)
lrngr(4.9 S)
450
?
80
19.51 7 2 1 6.652
81As(34.0s)
8'Se (18.0 min) 81mSe (57.3 min) 7RBr(65 min) (17.6 min) -Br(4.4 h)
75Ge (83.0 min) 75mGe(48.0s) %e(11.3h)
665
+
50a
81mSe(57.3min) 77Br(56.0 h) lPmBr(49 s)
82Br(35.3h) 82mBr (6.1 nun) 83Br(2.4 h)
85Br(2.9min)
s5Kr
(10.8 year) 85mKI(4.5h) 84Rb(34.5 d)
87Rb(27.83) T~,,: 4.7 x 101° year
350 t 35 1123 2 100a 85Kr(10.76 year) s2mBr (6.1 mid 84Br (3 1.8 min) @ ~ r ( 6 . 0min)
1.8 2 0 . 2 2.0
2
0.4
83~r(2.4h)
TABLE A (continued) Activation Cross-Sections for the Formation of 14.5 MeV Neutron-Induced Major Nuclear Reaction Radioactive Products Target nuclide (96 abundance)
Product
Cross-section
Product
Cross-seetion
Muct
Cross-section
Roducl
Cross-section
Product
Cross-section
Roduct
(Td (1.0 min) 83Sr(33.0h) 83mSr(5.0 S)
227
* 70
"Rb(34.5 d) "mRb(21. 0 min)
85Sr(64.9d) s5mSr (67.7 min)
85Kr (10.8 year) 85mKr(4.5h) "Rb(18.7 d) &Rb
87mSr(2.8h)
s8Y(108.0d)
89Zr(78.4h) 8AnZI (4.2 min)
%Y(19.0min) 93m~b
95Zr(64.0) 92Nb(10.2d)
(13.6 year) 91Mo(15.5 min)
93Sr(7.5min) q ( 6 4 . 1 h)
4.0
?
0.3
2.3 9
? '_
0.3 1
%r (28.5 year) 92Sr(2.7h) 8%(16.0 s)
Cross-section
6k1.5
""'Nb
31 + 4
%"'Nb
(13.6 year) (6.3 min)
V c (rahoactive) Tli2: 2.1 x I d year
V c ( 6 . 0 h)
1230
+
102m~c(4.3 min) 146 'wTc(18.0 min)
IoZRh (206 0 d)
522
?
45
102fi
435
+ 35
(2.9 year) 1°'Pd(8.5 h)
637
+ 45
Io3Ru(39.4d) 216
2
26
'03Ru(39.4 d)
IOlR,,
'02Rh(206.0 d) 102Rh(2.9year)
103Pd(17.0d)
19501
Io4Rh(42.0 S)
2.7
1
1°4m~h(4.4 min)
31
+6
(3.0 year) lO'Rh(4.4 d) '03Rh (56.1 min)
TABLE A (continued) Activation Cross-Sections for the Formation of 14.5 MeV Neutron-Induced Major Nuclear Reaction Radioactive Products Target nuclide (5% abundance)
Product
Cross-section
Product
Crm-section
Cross-section
Produet
Produet
Cross-section
Product
Cross-section
Produet
l"Rh(5.9 min) "ORh(27.7 s)
lWm~g (44.3 s)
304 r 116
losmPd (4.7 min) l"~g (24.0 min) '06Ag(8.3 d)
l @ " " ~ ~
420 r 80
108~g
(39.6 s)
(2.4 min) losm~g (127.0 year) '05Cd(5S min)
R Q hl' (42.0 s) lM"Rh (4.4 min) l"Rh(30.0 s) I-Pd(4.7
min)
l"Ag(24.0 min)
losmAg (127.0 year) "OAg(24.6 s)
11.3 2 3.4= lo3"'Rh (56.1 min)
Cross-section
Volume 11
125
126
Activation Analysis
123Te(0. 87)
I2'"Te (154.0 d)
890
+ 100 122mSb(4.2 min)
Iz3Te (1 19.7 d)
980
?
IZ3"Te (1 19.7 d)
T ~ , 1.24 ~ : x lo1' year 100
124Sb(60.3d)
121Sn(27.0h)
lNmSM1.6 min) I24m~b
I2'Sn(50 year)
(20.0 min) 125Sb(2.8year)
(58.0 d)
I2'Te(9.4 h) 127"Te(109d) I2qe (69.6 min) I2+e
1291(radioactive) 1.57 I"Xe(O.lO)
X
lo7 year
1281(25.0min)
126m~b 780 t 60 940 -c 100 570 885
5 5
30 45
0.8 2 0.1
12'Sn(27.0h)
0.6
?
2.7
+ 0.2
0.2
1NmSb (1.6 min) IxmSb (20.0 min) I2%b (2.8 year)
IZ1Sn(50year)
(19.0 min) 128Sb(9.0h) 128~b(10.4 min) IMSb(40min) IMSb(6.5 min)
1490 2 190 Iz9Te(69.6min)
Iz5Sb (2.8 year)
TABLE A (continued) Activation Cross-Sections for the Formation of 14.5 MeV Neutron-Induced Major Nuclear Reaction Radioactive Products nuclide (% abundance)
Roduct (Td
Cross-section (mb)
Product (TIIZ)
Cross-seetion
Product
Cross-seetion
lzsXe(16.8 h) 125mxe
(57.0 s) 127Xe(36.4d) I27mxe
1446 c 140 1281(25.0min) 317 ? 25
(70.0 s) '281(25.0 min) I2%Xe(8.9 d) lMI(12.4 h) min) l*1(9.0 131mxe
"'I(8.0 d)
(12.0 d)
'33Xe(5.3 d) 133mXe(2.2d)
805 c 90 665 c 80
'"I(52.0 min) min) l""'I(3.5
[I5501 783 ? 56
l"Cs(2.1 year) lMmCs(2.9h)
135Xe(9.2h) 135mxe
(15.3 min) 13?s(6.5 d) 129(2.2h) lZ9(2.1 h) I3l(ll .5 d) 13lmBa (14.5 min) "'Ba (10.5 year)
12Pre (69.6 min) I2qe (33.6 d) I3'Te (25.0 min) I3lTe (30.0 h) I3'Te (12.5 min) 133Te (55.4 min)
135mga
136C~(13.0d)
8 r 3
(2.1 year) l"mCs(2.9 h) L3SmCs
"'Cs(30.1 year)
[4.5]
(53 min) L36Cs(13.0d)
138Cs(32.2min)
2.6 2 0.4
(28 7 h)
137mga
1020 + 70
(2.6 min)
138"Cs(2.9 min)
"'CS (30.1 year) 137mga
L38La(o.oY) T ~ ~ ~x : l oI l .l year ~
(2.6 nun) %a(83
min)
4.4
2
1.6
0.8 I3'Ba (10 5 year) IS3Ba(38.9 h)
?
0.2
15.21
13Smga
(28.7 h) (34.4 h) 139Ce (137.5 d) 139mCe (56.5 s) 14'Ce(32.5 d) 140pr(3.4min) I4lNd(2.5 h) 141mNd(62 s)
1750 f 70a ImLa(40.2 h) %3 + 120a
1760 r 1660 r '1701 f 59 1 -t
70a l20a 120a 45
142La(92.5min) I4lCe(32.5 d) 142pr(lY.2h) 142pr(14.6min)
4.8 5 0.8 9.0 r 1.5 13 * 2
1122
l 4 I ~ a ( 3 . h) 9
142Pr(19.2h) (14.6 min)
1"4~r(17.3min) 1"mpr(7.2 min) '45pr(6.0 h)
9.8 + 1.5 7 f 1.3
2
0.2
139Ba(83min) 139Ce (137.5 d) 139mCe (56.4 s)
142mh
lMNd(23.9) TIl2:2.1 x 10ISyear 148d(8.3)
1.3
L43pr(13.6d) '"h (17.3 min)
2.3
?
0.6
6 + 1 2 2 1
'"Cs (2.06 year) 1MmCs(2.9h) L3smC~ (53 min)
Activation Analysis
-g
0
o f &s
3
:a
yay g
TIl2:1.1 x 10¹⁴ year 1995
Is4Gd(2.2)
?
152E~(9.3 h) 152mE~(l .6 h) 280 154E~(8.5 year)
151Sm (93 year) 161
155Eu(5.0year)
155Gd(14.9)
[5]
lS4Gd(20.6) 5.4
lS7Gd(15.7)
1.1
2
'"Eu (8.5 year) IS5Eu (5.0 year) lS6Eu(I5.2 d)
Is8Gd(24.7) ImGd(21 .7)
IS9Gd(18.6 h)
15%( 100)
1 5 8 ~ ~
(150 year) I 5 8 q
(10.5 s) 155Dy(10.2h) 156%(5.4 h) 156"'rq24.4 h) 1990 2 167 '58Tb(150 year) 158%(10.5 s) 2020 -+ 218 l W ( 7 2 . l d)
[8] 7
2
IS7Tb (150 year)
1.2
l6I'Ib(6.9 d) 162Tb(7.6min) 163Tb(19.5min)
'MHo (29.0 min) lMmHo (37.0 min) I6lEr(3.1 h)
831 2 123 l"Dy(2.4 h) 1050 2 3001 % y ( 1 . 3 min)
1927
2
130 '62Ho(15.0 min) 1 6 2 m ~ ~
163k
(75.0 min)
1824
? 270
(68.0 min) IMHo(29.0 min) IMmHo
163H0 (-33 year) 163mHo(l. l S)
131 151Sm (93 year) 0.5
153Sm(46.7h)
2. l
ls5Sm (22.4 m n ) IS7Sm (8.0 min) 156Eu(15.2d)
1.2 -+ 0.3 2
?
l
2.2 -c 0.5
lSSm(9.4 h) ISSEu (5.0 year)
TABLE A (continued) Activation Cross-Sections for the Formation of 14.5 MeV Neutron-Induced Major Nuclear Reaction Radioactive Products Target nuclide (8abundance)
(0,
n' Y)
Product
Cross-section
(n, 2n) Product
(n, P)
Cross-section
Product
(n, n' P)
Cros-section
4.5 3.4 2.8
?
+
(n, d)
(n, a )
Cross-section
Product
(n, n' a )
Cross-section
Product
0.7
+ 0.3 ?
Product
0.4
IaHo(26.7 h) 167Ho(3.1h)
l"Dy(2.4 h) 1 6 5 m ~ ~
2.0 1.0
2 2
0.3 0.2
(1.3 min) 135 I7%o(42 s) 17%o(2.9 min) ImTm(93. l d) 2070 -t 600a ImEr(9.3 d) 167n 1913 ? 217 168Tm(93.1d) (17.7 min) IWYb(32d) 1 9 8 5 5 151 170Tm(128.6d) I 6 % ' b ( 4 6s) I7lTm(l .9 year) lWEr(9.3 d)
1900
?
1.13 + 0.12 1.8 t 0.5 [51 [7.5]
[51 [4.5]
1 7 6 m ~ ( 1S)2
17%(4.2 d)
2166? 230
174Lu (3.3 year) 174mLu(142d)
1276 -t 146 17%(4.2 d) 558 + 17W
176mLu(3.7h) T1/2:33 x 1010year '74Hf(0.18)
(3.81 [3.51 131 4.0
+ 0.7
l"Tm(9.3 d)
1886
+
145 '74~u(3.3year)
0.18
?
0.02
167~y
+ 0.05
0.65
(4.5 min) IaHo(26.7 h) 16SEr(10.3h)
1.6
'72Tm(63.6 h)
1
166Dy(81.5h)
+
0.15 [3]
I7OTm (128.6 d) I7lTm (1.9 year) 172Tm(63.6h) 173~m(8.2 h) '75Tm (15.2 min)
I7%'b(12 S)
173Hf(23.6h)
(5 1 min)
173Tm(8.2h) I7%n(5 .4 min) 176Tm(1.9min)
IWHo (4.6 min)
173Lu (1.4 year)
2
0.13
I7lTm (1.9 year)
Cross-section
178mHf(4.3s)
177Hf(l.I s)
178m~f
177m~f
178Lu(28.4min) 178L~(22. 7 min)
(31 year) I7%Hf(18.7 s) 179mHf(25d)
(51 min) 178mHf(4.3s)
179L~(4.6 h)
[3.5]
178m~f
(31 year) I-Hf(5.5
h)
I q a ( 8 . l h)
12.4 c 1.0
179mHf(18.7s) 179mHf(25d) I7'?a(600 d)
I79w(38 min) 179mW(6.7 mid 181W(121d)
131
I8OLu(5.7 min) [I7001
I7sLu (28.4 nun) I78Lu (22.7 min) 179L~(4.6 h)
1 7 7 ~ b ( 1 .h) 9 22 ?0.2 177mYb(6.5S) '17Lu(6.7 d) 177mL~(161 d) I78Lu 0.14 c 0.04 (28.4 min) 0.3 c 0.1 178Lu (22.7 min) l S) 177mHf(l.
I h ~ f ( 5 . 5 h)
2100 e 6001 1 q a ( 8 . 1 h) 490 145 2020
?
ISZmTa( 16 min) 4.1
183mW(5.3S) ls5W(75.1 d) 185mw (1.7 min) IWRe(38d) IWmRe(165d)
Tliz:2.0 x 10¹⁵ year 1870s(l.6) 1880s(13.3)
790 190 I V a ( 8 . 7 h) 1840 ? 5 5 8 I8?a(10.5 min) 642 + 60 1500 300
+ 4501 1W
Is5W(75.1 d) Is5W(1.7 min)
176mL~(3.7 h) Il7Lu(6.7 d) 177mL~(161 d)
177m~f
bOOa 1 8 2 ~ a ( l 1 5 .d) 0
'S3"'W(5.3 s)
17bmYb(12S)
+ 0.5
2.9 ? 0 . 3 1.4 c 0.2
Ig2Ta (115.0 d) lSzTa (16 min) Is3Ta(5.O d) Ig5Ta(49min)
1.3+0.5
(51 min) 179m~f(18.7 s) 0.12 c 0.02 178mHf(4.3S) 178m~f 179mHf(25d) (31 year) ImHf(5.5h) 0.22 1 0 . 0 3 179m~f(18.7s) I7%Hf(25 d)
TABLE A (continued) Activation Cross-Sections for the Formation of 14.5 MeV Neutron-Induced Major Nuclear Reaction Radioactive Products
5.0 -c 1.8
188Re(17.0h) l 8 8 m ~ ~
'%(26.4) I9%s(41 .O)
I%s (9.9 min) 192mOs(5.9s)
I9lIr(37.4)
I9lIr(4.9 s)
1931r(62.6)
193mIr(11.9d)
11 k 1 . 5
(18.6 min) I8Qe(24.3 h)
la-(6h)
' q e ( 3 . 1 min) IhRe(3.0 h) 1910s(15.4 d) 1993 + 200 Ig2Re(16s) 1910s(13.0h) 1067 + 318 ' W 1 2 d) 1716 + 125 1910s(15.4d) 190"Ir(1.2h) 191mOs(13h) ' y 3 . 2 h) 220 r 26 2048 % 150P 1930s(30.0h) '%(74.0 d)
188Re(17.0h) 188mRe
(1.4 min) 192mh
(241 year) 18&(1 1 h)
IwmAu(7.8s)
280
lr
64
5
1 W 1 2 . 1 d) 1-Ir(1.2 h) '90"Ir(3.1 h) 168 1921r(74.0d) 1 9 2 m 1.4 ~ min) 193mIr(241year) I9"Ir(19.4 h) '%f171 d)
1.0 1 0.15 L2.11
197m~
I%Ir(52 s) I%Ir(1.4 h) 970 -c 164 L981r(8s) 910 60
(86 min) IwAu(6.2 d)
1990 2 150 197Pt(20.0h)
2.5
197Pt(20.0h)
I8Qe(24.3 h)
[I9001
2026
195mPt(4.0d)
+ 0.3
(18.6 min) I%e (3.1 min) '-Re (3.0 h)
192mh
'%(0.013) T1,2:6.1 X 10¹¹year
24
460 5 55
+
1951r(2.5h) '951r(3.8 h) ' % ( 7 min)
19'os
(6.5 min) k
0.5
10.821
I%
(6.0 year)
rn
k:
'%mAu(8.2 s) l%"'~u(9.7 h) 195Hg(9.5h) lPSmHg(40h) Iy7~g(64. 1 h) 197mHg
197Pt(81 min) 133 2 40a 363 2 54 lSAu(6.2 d) 1617 t 160 1 % m ~ ~ ( S) 8.2 Au(9.7 h) 1010 r 140 1 y 8 ~ ~ ( d) 2.7 910 2 85 '98mAu(2.3 d)
(23.8 h) I-Hg (42.6 min)
<80
I9Au(3. 1 d) 19Hg (42.6 min)
789
2
120
200Au(48.4min) 2ahnAu(18.7 h)
(81 min) 1.8
?
0.3
[2.4]
lOdn 51
~r10
(3.8 year) 2 0 3 ~ q 5 2 . h) 1 2O3"'Pb(6.2 s)
1480 207mPb(~.8 s)
1990
~r280
m A ~ (48.4 min) -Au (18.7 h) 201Au (26.4 min)
205Hg(5.2min)
197Pt(20.0h)
<1
I97m~
(81 min) 1.0 r 0.1 (30.8 min) 199mPt(14s) m'Pt(2.5 min) 2mAu (48.4 min) 2mmAu (18.7 h) m 2 ~ ~ (S) 28
[0.75] 2.2 2 0.4
0.75
%(I 1.5 h) 199Au(3.1 d)
-C
0.35 201Au(26.4 min)
2
0.2
I737 2 140 20dTI(3.8 year) 860 2 180 206T1(4.2 min) 207Tl(4.8min) Z07m11(1.3s) 1340 f 174 2°8Tl(3.0 min)
205~g(5.2 min) %(4.2 min) 2 2 3 ~ n ( 4min) 3
2%i(lW) 2xRa(radioactive) T1,2:1600year 2%(radioactive) T1,27.7 x lo4 year 231Ac (7.5 min)
1.6
0.6 Ir 0.1 10.661
2 2 2 ~ n ( 3 .d) 8
228~. (5.7 year)
TABLE A (continued) Activation Cross-Sections for the Formation of 14.5 MeV Neutron-Induced Major Nuclear Reaction Radioactive Products Target nuclide
(n, a ' Product
TI^: 1.4 X 10lo year 23'Pa(radioactive) T;~z:3.25x 10⁴ year 234U(0.0055) T112:244x lo5 year 235U(0.720) 235mU(26min) Tl/z:7 x lo8 year
r)
Cms-section
(n, n' P) + (n, d)
(n, P)
(a, 2n) Product
Cross-seetion
Product
Cross-section
Product
Cross-section
(n, a ) Product (T112)
(n, n' a )
Cross-seetion (mb)
228A~(6. 1 h)
2mPa(17.4d)
Product (Tud
Cross-section (mb)
2 2 7 ~ ~
(21.8 year)
745
+
30a
2"Pa(6.7 h) 234mPa(1 .2 min) 235Pa(24.2min)
1.9
+ 0.4
238Pa(2.3min)
1.5
+ 0.4
Tl/2:4.47 x lo9 year 237Np(radioactive) x 106 year T&!.14
23'111(25.6 h) '%Pa(6.7 h) 2"m~a (1.2 min) 237Pa (8.7 min)
231Th(25.6h)
235111
Z34Pa(6.7h) 234mPa ( 1.2 min)
238pll (87.75 year) T1l2:2.4 x lo4 year 24'Am(radioactive) T1,2:433 year This is a value of the respective excitation function at 14.5 MeV.
245
+
10
"'pll(l4.9 year)
0.6
+ 0.15
2%(24.1
d)
(6.9 min)
238Np(50.8h)
233Pa(27.0d)
Volume 11
137
REFERENCES TO THE APPENDIX A. Qaim, S. M., A survey of fast neutron induced cross-section data, in Proc. Conf. Nuclear Cross-Section Technology, NBS Special Publication 425, National Bureau of Standards, Washington. D.C., 1975, 664. B. Manokhin, V. N., Paschenko, A. B., Plyaskin, V. I., Bychkov, V. M., and Pronyaev, V. G., Activation cross-sections induced by fast neutrons in, IAEA, Handbook on Nuclear Activation Data, IAEA-TER-273, International Atomic Energy Agency, Vienna, 1987, 305. C. Biidy, Z. and Csikai, J., Data for 14 MeV neutron activation analysis, in IAEA Handbook on Nuclear Activation Data, IAEA-TER-273, InternationaI Atomic Energy Agency, Vienna, 1987, 261. D. Qaim, S. M., 14 MeV neutron activation cross-sections, in Handbook of Spectroscopy, Vol. 3, CRC Press, Boca Raton, FL, 1981, 141. E. Bychkov, V. M., Manokhin, V. N., Paschenko, A. B., and Plyaskin, V. I., Cross-section for neutron induced threshold reactions, Energoizdat, Moscow, 1982. F. Evain, B. P., Smith, D. L., and Lucchese, P., Compilation and evaluation of 14 MeV neutron activation cross-sections for nuclear technology applications, S et I, ANLINDM-89, April 1985. G. Brookhaven National Laboratory, Neutron cross-sections, Rep. BNL-325, 2nd ed., 1966. H. Borman, M., Neuert, H., and Schobel, W., Tables and graphs of cross-sections for (n,p), (n,a) and (n,2n) reactions in the neutron energy region 1-37 MeV, in, Handbook on NuclearActivation Cross-Sections, Tech. Rep. Ser. No. 156, International Atomic Energy Agency, Vienna, 1974.
REFERENCES 1. Adams, F. and Hoste, J., Non-destructive activation analysis, At. Energy Rev., 4, 113, 1966. 2. Adams, F., Op de Beeck, J. P., Van den Winkel, P., Gijbels, R., De Swte, D., and Hoste, J., Activation analysis with neutron generators, CRC Crit. Rev. Anal. Chem., 1, 499, 1971. 3. Barschall, H. H., 14 MeV D-T sources, in Neutron Sources for Basic Physics and Applications, Cierjacks, S., Ed., Pergamon Press, 1983, 57. 4. Berzin, A. K., Bespalov, D. F., Zaporozhets, W. M., and Kanton, S. A., Leipunskaya, D. E., Sulin, V. V., Feldman, I. I., and Shimelevich, Yu. S., Present state and use of basic nuclear geophysical methods for investing rocks and ores, At. Energy Rev., 2 , 59, 1966. 5. Czikai, J., Handbook of Fast Neutron Generators, Vol. I and 11, CRC Press, Boca Raton, FL, 1987. 6. De Soete, D., Gijbels, R., and Hoste, J., Neutron Activation Analysis, Chemical Analysis, Vol. 34, Wiley-Interscience, London, 1972. 7. Dietrich, F. S., What can be learned with fast neutrons, Rep. KID-19828, Lawrence Livermore National Laboratories, Livermore, CA, 1983, 24. 8. Ehmann, W. D., Non destructive techniques in activation analysis, Fortschr. Chem. Forsch., 14, 49, 1970. 9. Gibbons, D., Fast neutron activation analysis, in Activation Analysis Principles and Applications, Lenihan, J. M. and Thomson, S. J., Eds., Academic Press, London, 1965, 113. 10. Girardi, F., Some recent developments in radioactivation analysis. A review of improvement in the analytical technique, Talanta, 12, 1017, 1965. 11. Guenther, K., Biophysical aspects of the efficacy of fast neutrons, sitzungsber. Akad. Wiss DDR, Math, Natur WISS., Tech. (SAWTDU), Akad Verlag, Berlin, 1982, 98. 12. Guinn, V. P., Neutron activation analysis with small accelerators, in Proc. Conf. Use of Accelerators for Teaching and Research, Oak Ridge, TN, April 8 to 10, 1968, 1. 13. Hislop, J. S. and Wainerdi, R. E., Extraterrestrial in situ 14 MeV neutron activation analysis, Int. Ser. Monogr. Anal. Chem., 35, 1970, 195. 14. IAEA, Properties of neutron sources, IAEA-TECDOC-410, International Atomic Energy Agency, Vienna, 1987. 15. Iddings, F. A., Application of activation analysis in the petroleum and chemical industries, in Analysis Instrumentation. Plenum Press, New York, 1964, 139. 16. Japan Atomic Industrial Fomm Inc., Report of the committee on utilisation of compact 14 MeV neutron generators, Japan Atomic Industrial Forum Inc., Tokyo, Jan. 1970. 17. Laverlochere, J., Activation analysis with fast neutrons, in, Techniques of Metals Research, Vol. 111, Bunshah, R. F., Ed., Interscience, 1970, 755. 18. Pepelnik, R., Fanger, H. V., Michaelis, W., and Anders, B., Advances in 14 MeV neutron activation analysis by means of a new intense neutron source, J. Radioanal. Chem., 72, 393, 1982. 19. Qaim, S. M., A survey of fast neutrons induced reactions cross-sections data, in, Proc. Conf. Nucl. CrossSections Technology, NBS Spec. Pub. 425, National Bureau of Standards, Washington, D.C., 1975, 664. 20. Reynolds, P. M., The potentialities of non-destructive neutron activation analysis with special reference to generally available neutron sources, Research Report A1461, The British Non-Ferrous Metals Research Association, London, October 1963.
138
Activation Analysis
21. Savosin, S. I., Portable neutron generators in nuclear geophysics, A collection of articles edited by Savosin, S. I., Gosatomizdat, Moskva, 1962. 22. Schulze, W., Fast neutrons in activation analysis, in I'Analyse par Activation et ses Applications a m Sciences Biologiques, 38me Colloque International de Biologie de Saclay (1963), Presse Universitaire Paris, 1964, 118. 23. Strain, J. E., The use of neutron generators in activation analysis, in Progress in Nuclear Energy, Ser. IX, Analytical chemistry, Vol. 4 Part 3, Pergamon Press, Oxford, 1965, 137. 24. Van Grieken, R. and Hoste, J., AnnotatedBibliography on 14 MeV Neutron Activation Analysis, Eurisotop, Information booklet, Series Bihliographics - 8, Bureau Euristope, Information and Documentation Section, Brussels. 25. Vogt, J. R., Accelerator systems for activation analysis. A comparative survey, in Developments in Applied Spectroscopy, Vol. 6, Plenum Press, New York, 1968, 161. 26. Wood, D. E., Some principles of activation analysis, Kamn Nuclear Report KN-68-71-R, Kaman Science Corporation, Colorado Springs, CO, February 1968. 27. Moak, C. D., Reese, H., Jr., and Good, W. M., Design and operation of a Radio-Frequency ion source for particle accelerators, Nucleonics, 9(3), 18, 1951. 28. Penning, F. M. and Moubius, J. H. A., Eine neutronemohre ohne pumpvomchtung, Physica, 4, 1190, 1937. 29. Keller, R., Etude d'une source d'ions du type Penning, Helv. Phys. Acta, 22, 78, 1949. 30. Garr, B. J., Kaman tube: three different ion sources, Nucleonics, 18(12), 75, 1960. 31. Gow, J. D. and Ruby, L., Simple pulsed neutron source based on crossed field tapping, Rev. Sci. Instrum., 30, 315, 1959. 32. Accelerator targets designed for the production of neutrons, Euratom Report EUR 1815, d,f,e, Brussels, 1964. 33. Accelerator targets designed for the production of neutrons, Euratom Report EUR 2641 d,f,e, B ~ s s e l s , 1966. 34. Anders, B., Pepelnik, R., and Fanger, H A . , Application of a novel 14 MeV neutron activation analysis system for cross-section measurements with short lived nuclides, GKSS, Geesthacht, 83, E, 29. 35. Flerov, N. M. and Talyzin, V. M., Inelastic collision cross-sections of various elements for 14.5 MeV neutrons, J . Nucl. Energy, 4, 529, 1957. 36. Schulze, W., Fast neutron activation analysis, 3bme Congr8s International de Biologie de Saclay, September 1963. 37. Bayhust, B. P. and Prestww, R. J., (n,P), and (n,a) excitation functions of several nuclei from 7 to 19.8 MeV, J . Inorg. Nucl. Chem., 23, 173, 1961. 38. Cullen, D. E., Kocherov, N., and McLaughli, P. K., The international reactor dosimetry file (IRDF82) in energy dependent form, Internal Report, IAEA-NDS 48, International Atomic Energy Agency, Vienna, 1982. 39. Alley, W. E. and Lessler, R. M., Neutron Activation Cross-Section, Nuclear Data Tables A, 11. 8-9, Academic Press, Orlando, FL, 1973. 40. Iddings, F. A., A study of flux monitoring for instrumental neutron activation analysis, Anal. Chem. Acm, 31, 206, 1964. 41. Lowe, K., Faure, P. K., and Steele, T. W., Compensating for flux variation in neutron activation analysis, NIM Report N 177, Project C 65/65, National Institute for Metallurgy, Johannesburg, July 3rd, 1967. 42. Mathew, P. J. and Pohl, K. P., A simple cheap continuous flux monitor for 14 MeV neutrons, Anal. Chem. Acta. 51, 336, 1970. 43. Nikolenko, 0. K., Kommissarov, V. A., and Shtan, A. S., Neutron monitor with the application of R. C. integration circuits, in Radiation Technology, 5th ed., Atomizdat, 261, 1970. 44. Tokyo ShibauraElectric Co., Japan, Principle, design and operation of an automatic control system including a three channel pneumatic transfer system and a RC flux monitoring circuit, British patent No. 1,055,657 and Brevets d'inventions No. 1,396,135. 45. Gilmore, J. T. and Hull, D. E., Neutron flux monitoring for activation analysis of oxygen, Anal. Chem., 35, 1623, 1963. 46. Prud'homme, J. T., Neutron Generators, Texas Nuclear Corporation, 5820, Austin, TX, 1962, 6. 47. Proc. Modern Trends in Activation Analysis, Texas A and M College, College Station, TX, April 19 to 23, 1965. 48. Heath, R. L., Scintillation Spectrometry Gamma-Ray Spectnun Catalogue, Atomic Energy Division, Phillips Petroleum, Idaho Falls, August 1964, Research and Development Report IDO-16.880, I and 11. 49. Anders, 0. U., Determination of fluorine by neutron activation, Anal. Chem., 32, 1368, 1960. 50. Anders, 0. U., Use of very-short-lived isotopes in activation analysis, Anal. Chem., 33, 1706, 1961. 51. Caldwell, R. L., Mills, W. R., Allen, L. S., BeU, P. R., and Heath, R. L., Combination neutron experiment for remote analysis, Sciences, 152, No. 3721, 1966. 52. Heydron, K. and Westermann, J., Fast transportation system evaluation at the Danish Mach I irradiation facility, J. Radioanal. Chem., 61, 69, 1981.
Volume 11
139
53. Salahi, A. and Grass, F., A rapid transportation facility for irradiation with thermal and fast neutrons, J. Radioanal. Chem., 61, 63, 1981. 54. Megitt, G. C., 214 MeV neutron activation analysis using short lived products, J . Radioanal. Chem., 4 8 , 105, 1979. 55. Spyrou, N. M., Cyclic activation analysis - a review, J. Radioanal. Chem., 61, 211, 1981. 56. Workshop on activation analysis with short lived nuclides, Vienna, February 4 to 8, 1980, published in J. Radioanal. Chem., 61, 1981. 57. Fanger, H. U., Pepelnik, R., and Michaelis, W., Fast-neutron activation analysis with short-lived nuclides, J . Radioanal. Chem., 61, 142, 1981. 58. Dams, R., Selection of short lived isotopes for activation analysis with respect to sensitivity, J. Radioanal. Chem., 61, 13, 1981. 59. Qaim, S. M., 14 MeV neutron activation cross-sections, Handbook of Spectroscopy, Vol. 3, CRC Press, Boca Raton, FL, 1981, 141. 60. Bychkov, V. M., Manokhin, V. N., Paschenko, A. B., and Plyaskin, V. I., Cross-sections for neutron induced threshold reactions, Energoizdat, Moscow, 1982. 61. Givens, W. W., Mills, W. R., and Caldwell, R., Cyclic activation analysis, Nucl. Instrum. Methods, 80, 95, 1970. 62. Hogdahl, 0. T., Radiochemical methods of Analysis I, in Proc. of Symp. Salzburg, Oct. 19 to 23, International Atomic Energy Agency, Vienna, 1964, 23. 63. Anders, 0. U. and Briden, D. W., Rapid nondestructive method of precision oxygen analysis by neutron activation, Anal. Chem., 36, 287, 1964. 64. Anderson, G. H. and Algots, J. H., The effect of sample bulk density on the determination of nitrogen by fast neutron activation analysis, J. Radioanal. Chem.. 3, 261, 1969. 65. Brune, D. and Jirlow, K., Determination of oxygen in aluminum by means of 14 MeV neutrons with an account of flux attenuation in the sample, J. Radioanal. Chem., 2, 49, 1969. 66. Crambes, M. R., Nargolwalla, S. S., and Suddueth, J. E., Self-absorption corrections in photopeak analysis of gamma photons from nuclear emission and positron annihilation in 14 MeV neutron activation analysis, Trans. Am. Nucl. Soc., 11, 97, 1968. 67. Twitty, B. L. and Fritz, K. M., The determination of oxygen in magnesium, steel and titanium: internal standard techniques in 14 MeV activation analysis, in the Society for Applied Spectroscopy National Meeting, Chicago, Illinois, June 17, 1966, CONF-660611-3. 68. Nargowalla, S. S., Crambes, M. R., and Suddueth, J. E., Photon self absorption corrections for the minimization of systematic errors in 14 MeV neutron activation analysis, Anal. Chem. Acta. 49, 425, 1970. 69. Nikolaenko, 0. K. and Shtan, A. S., The calculation of attenuation and self-absorption effects upon the determination of oxygen in metals by fast neutron activation analysis, Radiation Technology, 4th ed. Atomizdat, Moskva, 1969, 175. 70. Van Grieken, R., Nondestructive Analysis of Iron and Steel by 14 MeV Neutron Activation Analysis, Ph.D. Thesis, Ghent University, May 1971. 71. Tamura, M. M. and Taira, S., Self-shielding and self-absorption effects in oxygen analysis by 14 MeV neutron activation, Radioisotopes, 19, 1970. 72. Elayi, A. G., Mtermination par le calcul des coefficients d'attknuation des neutrons de 14 MeV, Nucl. Instrum. Methods, 135, 157, 1976. 73. Elayi, A. G., Calculated screening effect in 14 MeV neutron activation analysis, J. Radioanal. Chem., 35, 377, 1977. 74. Elayi, A. G., Calculated gamma-ray andlor neutron attenuation coefficients in 14 MeV neutron activation analysis, J. Radioanal. Chem., 76, 203, 1983. 75. Elayi, A. G., A method to compare calculated and experimental 14 MeV neutron attenuation coefficient and to determine the total removal cross-section, J. Radioanal. Chem.. 45, 181, 1978. 76. Elayi, A. 6. and Goreil, R., Experimental 14 MeV neutron attenuation coefficient measurement, in Conference on Spectroscopy and Analytical Chemistry, Birmingham, July 1977, unpublished. 77. Elayi, A. G., A theoretical treatment of nonidentical samples and standards in 14 MeV neutron activation analysis, in, Proc. of the conference computers in activation analysis and gamma ray spectroscopy, Mayaguez, Puerto Rico, April 30 to May 4 1978, W E Symposium Series 49, Conf-780421, Department of Energy, Springfield, VA, 1979. 78. Elayi, A. G., Study of the variations of the photofraction with the distance, J. Radioanal. Chem., 97, 131, 1986. 79. Elayi, A. G., Experimental verification for the use of nonidentical samples and standards in 14 MeV neutron activation analysis, J. Radional. Chem., 5 2 , 427, 1979. 80. Elayi, A. G., Damiani, P., Collet, P., Gruel, K., Widemann, F., Grenier, G., and Parizot, D., Analysis of Gaulish silver alloyed coins with 14 MeV neutron activation analysis, J. Radioanal. Chem., 90, 113, 1985.
140
Activation Analysis
81. Doty, W. H., Munson, A., Wood, D. E., and Schneider, E. L., Comparative analysis of the variance of the kjeldahl nitrogen and a neutron activation nitrogen technique, J. Assoc. Off. Anal. Chem., 53, 801, 1970. 82. Hans, A., Tyon, Ph., Lacomble, M., and Collette, F., Determination of oxygen in steel by neutron activation 111. Results of the experiments carried out in the first half of 1967 with the equipment installed at the L. D. steel plant of S. A. Cockeril - Ougrie - Providence, CNRM Met. Rep. No. 13, Centre National de Recherche Metallorgique, Brussels, 1967, 37. 83. Mott, W. E. and Orange, J. M., Precision activation analysis with 14 MeV neutrons, Anal. Chem., 37, 1338, 1965. 84. Wood, D. E., Problem in precision activation analysis with fast neutrons in Proc. Conf. Use of Small Accelerators for Teaching and Research, U.S. Atomic Energy Commission, Oak Ridge, TN, April 8 to 10, 1968, 56. 85. Lacomble, M., Collette, F., and Hambucken, J., One years experience in activation analysis. Its application to the normal control in steelmaking for the determination of oxygen and silicon, in Conf. Automatic Determination of Oxygen and Other Elements in Steel, Essen, Germany, March 3, 1969. 86. Van Grieken, R., Speecke, A., and Hoste, J., On the precision of oxygen determination in steel by 14 MeV neutron activation, Anal. Chem. Acta, 52, 275, 1970. 87. Nargolwalla, S. S., Crambes, M. R., and De Voe, J. R., A technique for the evaluation of systematic errors in the activation analysis, Anal. Chem., 40, 661, 1968. 88. Elayi, A. G., Precision in 14 MeV neutron activation analysis, J. Radioanal. Chem., 90, 137, 1985. 89. Thode, H. G., Macnamara, J., Losing, F. P., and Collins, C. B., Natural variations in the isotopic content of boron and its chemical atomic weight, J. Am. Chem. Soc., 70, 3008, 1948. 90. Thode, H. G., Macnamara, J., and Collins, C. B., Natural variations in the isotopic content of sulfur and their significance, Can. J. Res., 27B, 361, 1949. 91. Corless, J. T. and Winchester, J. W. The Society of Applied Spectroscopy, 2nd national meeting, San, Diego, CA, October 14 to 18, 1963. 92. Duckworth, H. E., Mass Spectrometry, Cambridge University Press, New York, 1958. 93. De Goeij, J. J. M., Houtman, J. P. W., and KanU, J. B. W., Errors in activation analysis due to variations in isotopic ratio, Radiochim. Acta, 5, 117, 1966. 94. Sautin, A., Analyse par activation d'un m6lange de terres rares, Thesis, Universiti Claude Bernard, Lyon 1965. 95. Chong, C. S., Kostalas, H., and Jervis, R. E., Correction for carbon and oxygen interference in the 14 MeV neutron activation analysis of nitrogen, J. Radioanal. Nucl. Chem., 99, 359, 1986. 96. Ndiokwere, C. L. and Jerabek, P., A study of some nuclear reaction interferences in determination of nitrogen content of plant materials by 14 MeV neutron activation analysis, Talanta, 30(5), 377, 1983. 97. Gilmore, J. T. and Hull, D. E., Nitrogen 13 in hydrocarbons irradiated with fast neutrons in, Proc. Int. Conf. Modern Trends in Activation Analysis. Texas A & M University, College Station,TX, December 15 to 16, 1961, 32. 98. Schmidt-Honow, M., Interferences in the oxygen determination by fast neutron activation analysis and investigation on the cross-sections of the involved nuclear reactions (German), Dissertation University of Koln, 1970. 99. Wood, D. E., Born interference in fast neutron activation analysis for oxygen, Kaman Nuclear Technical Note TN-105, June 10, 1965. 100. Voigt, A. F., Clark, R. G., and Stensland, W. A., Activation analysis with 14 MeV neutrons, IS-1600, Ames Laboratory Annual Summary Research Report, July 1966 to June 1967, C98-C99, Iowa State University of Science and Technology, Ames. 101. Nargolwalla, S. S., Suddueth, J. E., and Rook, H. L., Determination of pulse pick-up and nuclear interferences in 14 MeV neutron activation analysis for trace oxygen, Trans. Am. Nucl. Soc., 13,78, 1970. 102. Dugain, F. and Andre, M., Determination of the oxygen content of aluminium by 14 MeV neutron activation. Effect of surface removal after irradiation, Radiochem. Radioanal. Lett., 412, 35, 1970. 103. Anders, 0. U. and Briden, D. W., Trace oxygen determination in cesium metal and the problem of recoils from the atmosphere during fast neutron activation, Anal. Chem., 37, 530, 1965. 104. Battye, C. K., Tomlinson, R. W. S., Anderson, J., and Osborn, S. B., Experiments relating to wholebody activation analysis in man in vivo using 14 MeV incident neutrons, Proc. IAEA Symp. Nuclear Activation Techniques in the Life Sciences, Amsterdam, May 8-12, 1967, 573. 105. Anders, B. and Pepelnik, R., Sedimentanalysen mit schnellen Neutron an Korona, GKSS 85lW41, Geesthacht, 1981, 1. 106. Mathur, S. C. and Oldham, G., Interferences encountered in 14 MeV neutron activation analysis, Nucl. Energy, September-October, 136, 1967. 107. Scholes, P. H., Fast neutron reactions and their possible application to the activation analysis of steelworks material, BISRA Report MGID1329, British Iron and Steel Research Association, Sheffield, 65, OctoberNovember, 1965.
Volume 11
141
108. Steele, E. L. and Meinke, W. W., Fast neutron activation analysis, in Proc. Int. Conf. Modern Trends in Activation Analysis, Texas A & M University, College Station, TX, December 15 to 16, 1961, 161. 109. Body, Z. and Csikai, J., Data for 14 MeV NAA, IAEA Handbook on 14 MeV neutron activation data, IAEA-TER-273, Vienna, p. 261, 1987. 110. Cheng, E. T., Nuclear data leads for fusion energy development, Fusion Technol., 8, 1423, 1985. 111. Jung-Chung, J., Youssef, M. Z., Cheng, E. T., and Lee, J. D., Nuclear data base assessment for US Intor, Fusion Technol., 10, 382, 1986
Volume 11
143
Chapter 3
PROMPT ACTIVATION ANALYSIS WITH CHARGED PARTICLES Max Peisach
TABLE OF CONTENTS Introduction ..................................................................... 144 A. Kinematics of Nuclear Reactions ........................................145 B. Advantages and Disadvantages of Prompt Analysis .....................146 C. Considerations of Experimental Conditions ..............................147 Particle-Induced Gamma-Ray Spectrometry .....................................149 A. Sensitivity of Analysis ..................................................150 B. Nomenclature of Prompt Gamma Rays ..................................151 C. Catalog of Prompt Gamma Rays ........................................151 D. Application of PIPPS ....................................................168 E. Isotopic Analysis ........................................................172 Prompt Particle Spectrometry ...................................................173 A. Calculation of Depth Profiles ............................................ 175 B. Some Applications of Charged Particle Spectrometry ...................177 1. Hydrogen ........................................................ 177 2. Helium ........................................................... 177 3. Lithium ..........................................................178 4. Beryllium ........................................................178 5. Boron ............................................................179 6. Carbon ...........................................................179 7. Nitrogen .........................................................179 8. Oxygen ..........................................................181 9. Heavier Elements ................................................183 Prompt Neutron Spectrometry by Time-of-Flight ............................... 183 A. Energy Resolution .......................................................183 B. Concentration Profiles ................................................... 188 C. Application of Pulsed Beams of Charged Particles ...................... 189 I. Hydrogen ........................................................189 2. Lithium ..........................................................189 3. Beryllium ........................................................190 4. Boron ............................................................191 5. Carbon ........................................................... 192 6. Nitrogen .........................................................193 7. Oxygen ..........................................................193 8. Calcium ..........................................................193 The Use of Nuclear Resonances ................................................ 196 A. Hydrogen ................................................................ 199 B. Helium ..................................................................199 C. Boron ...................................................................199
144
Activation Analysis
Carbon ..................................................................199 Nitrogen.. .............................................................. .I99 Oxygen.. ................................................................200 Fluorine .................................................................201 Neon ................................................................... -202 Sodium.. ............................................................... .202 Magnesium. .............................................................203 Aluminum.. ............................................................ .204 Other Elements.. ....................................................... .204 The Use of Analog Resonances ........................................ .204 1. Titanium .........................................................205 2. Chromium .......................................................205 3. Nickel.. ..........................................................205
VI.
Coincident Measurement of Complementary Particles (CMCP) ................ .205 Applications of CMCP ................................................. .207 A. 1. Hydrogen ....................................................... .207 2. Lithium ......................................................... .208 3. Beryllium ....................................................... .208 4. Boron.. ......................................................... .208
References. .............................................................................2 12
I. INTRODUCTION Since nuclear reactions lie at the core of activation analysis, it is well to form a picture of what might occur when the nucleus of an atom is placed in a flux of bombarding particles. A diagrammatic representation' is shown in Figure 1. Since the nucleus of the atom is small compared to the atom itself, it presents such a small target to the bombarding flux that the probability for interaction is very low. For some time the target could, therefore, exist in the bombarding flux entirely unaffected by the bombardment, until an incident particle passes close enough for interaction. When this happens, part or all of the energy of the bombarding particle is rapidly transferred to the target nucleus, which becomes excited, often highly excited, and immediately proceeds to shed the excitation energy by emitting particles and/or gamma-ray photons to attain a more stable state. After about a picosecond or so, the excited nucleus would have produced a variety of product particles and/or radiations all of which would have been formed promptly. At the same time the target nucleus will generally have undergone transformation. The transformed state could still be unstable, and one which could decay to a more stable configuration through the further emission of particles or radiation in one or more stages. These latter decays require reorganization within the nucleus and the decay process is delayed, proceeding according to the well-known decay rate of radioactive species with the characteristic half-life of the nuclide. There are thus two different stages at which emission of nuclear particles and radiation can occur, one is prompt and the other delayed. Both can and have been used for analytical purposes. Since both stages are the result of energy transfer, both may be termed activation.
Volume 11
145
FIGURE 1. Diagrammatic representation of a nuclear reaction. Emission of particles and photons in the upper row represents prompt products. Similar emissions in the lower row refer to radioactive decay. (Reprinted from Peisach, M., J . Radioanal. Chem., 61, 243, 1981. With permission from Elsevier Sequoia S.A.)
In principle, therefore, activation analysis can be divided into two kinds, depending on which of these stages is used for analysis: prompt activation analysis where the early stage is used and the particles and radiation are measured during the irradiation of the material and, delayed activation analysis which is the well-known radioactivation analysis. In practice, the line of demarcation between these two groupings is determined by the minimum half-life acceptable in one group or the maximum half-life acceptable in the other. Currently, half-lives less than microseconds are taken as the boundary region, so that emission from long-lived nuclear states are taken as "delayed", while the decay in very short-lived radioactive states is considered "quasi-prompt". In this chapter, the discussion is confined to prompt activation analysis using nuclear reactions induced by accelerated charged particles. Analytical procedures using elastic scattering will not be included.
A. KINEMATICS OF NUCLEAR REACTIONS When a nuclear reaction between a target nuclide and a bombarding particle yields one light and one heavy product, the reaction can be considered in lab-coordinates as if the bombarding particle with energy El and mass M I was incident on a stationary target nuclide, mass M,. After reaction, the light product, of mass M, is emitted with energy E, in a direction 0 to the incident beam. From the Laws of Conservation of momentum and energy, it can be shown that
where M, is the mass of the heavy product and Q is the reaction Q-value. At the same time, the heavy product will be emitted in a direction b, given by
146
Activation Analysis
and energy E, given by
dE, = vr + V' W'
+ W'
(v')~
= COS+VM,M,E;I(M, = (M3Q
+ M,)
+ M3E, - M,E,)/(M3 + M,)
(4)
B. ADVANTAGES AND DISADVANTAGES OF PROMPT ANALYSIS When compared with conventional delayed activation analysis, the measurement of prompt emission in principle offers several advantages: Because the light reaction product or radiation is measured instead of the emissions from the product nucleus, reactions leading to stable or very long-lived nuclides can be used for analysis. The method can be applied to reactions yielding very short-lived products without requiring specially constructed rapid transfer equipment. The duration of the bombardment need not be unnecessarily extended to build up any concentration of a long-lived product. The rate of acquisition of data depends on the reaction probability, the mass of the target material, and the bombarding flux, but not on the rate of radioactive decay. Data can, therefore, be accumulated at a constant rate throughout the measuring period. This is in contrast with delayed activation analysis where the highest rate of counting is obtainable as soon as possible after the end of the irradiation. The rate of prompt particle emission is equivalent to that of an activated sample immediately after the end of an irradiation that lasted long enough to produce the saturation level of radioactivity. Prompt activation analysis usually involves determining the energy of the prompt particle. By energy spectrometry similar particles from other target nuclides can be distinguished. Nuclear reactions which yield the same product, need not interfere. The reaction of interest often involves a single excited state of the product nucleus, the excitation functions of which may be a rapidly changing function of the bombarding energy. The energy of bombardment can, therefore, frequently be chosen so as to enhance the yield of a required reaction or depress the yield of an interfering one. These advantages have to be weighed against the following disadvantages: 1.
2.
Prompt particle spectrometry implies counting particles from a particular excited state of the product nucleus, whereas radioactivity counting measures the yield of the radioactive nucleus irrespective of the excited state in which it was produced. The cross-section for prompt particle production will only constitute a fraction of the crosssection for radioactivation. Since the energy of a prompt particle depends, among other parameters, on the direction in which it is emitted, resolution is improved if the detector views a well-defined direction. Accordingly, unless multiple or annular detectors are used, the number of counts recorded will be a small fraction of the particles emitted. By contrast, radioactivity measurement is possible with a geometrical arrangement of high efficiency.
Volume 11
147
-
X
product
knock on particle
- rav
J
rays
scatter
0 RGURE 2. Diagrammatic representation of some analytically important interactions between a charged particle beam and a bombarded target. In this work, only the generation of reaction products, gamma rays, and neutrons, will be discussed.
3. 4.
Reaction of even a single nuclide may often result in a complex energy spectrum of prompt particles. Since the prompt particles are emitted during the bombardment of the target, it is not possible to use other techniques to enrich the product in order to enhance the sensitivity of the measurement.
C. CONSIDERATIONS OF EXPERIMENTAL CONDITIONS When charged particles are used to bombard a target material, apart from atomic excitations and scatter events, a number of different nuclear reactions can occur during the irradiation. Usually several of the reactions may have analytical application (see Figure 2). The selection of the nuclear reaction will then depend on the kind of measuring equipment the analyst wishes to use, the extent of interference that may result from other sample components, the intensity of the background, and the cross-section of the reaction. Frequently the nature of the target material may influence the selection. The measurement of prompt gamma rays, which can escape from the vacuum system of the irradiation site, with little or negligible attenuation, is experimentally a very simple technique. It also has the advantage that the energy of the measured photons is not determined by the depth within the target material where the reaction occurred. This property, however, precludes the use of this technique from measuring concentration profiles. When a monoenergetic beam of charged particles is used to generate prompt particles from a very thin target, in which the energy loss of both the bombarding particle and the prompt reaction product is negligible, the energy spectrum of the prompt product will consist of a series of peaks superimposed on a background continuum. The full width of the peaks at the half maximum height (FWHM) will be determined by the resolution of the spectrometer and will include the energy spread in the supposedly monoenergetic bombarding beam. Each peak will represent a group of particles from nuclear events in which the heavy product nucleus is left in the same excited state. Usually, but not always, the highest energy group is associated with the heavy product in its ground state. The count rate dC/dt of a selected group from a target containing N nuclei, bombarded by a beam of energy E, is given by
148
Activation Analysis
where 4 is the flux of bombarding particles and a is the cross-section of the nuclear reaction producing particles of the required group in the direction 0 to the incident beam. The detector has an efficiency E and subtends a solid angle (n at the target. In practical units, if the current, I, is measured in microamperes, the cross-section in b/sr and the weight of the required target nuclide, W, in pg/cm2 of the beam area, then an irradiation with a beam of cross-sectional area, A, lasting for t seconds will produce C counts of the required group where
and v is the number of electronic charges carried per ion of the bombarding beam. If a zero superscript is used to denote corresponding parameters pertaining to a standard sample containing a known amount of the nuclide under investigation and irradiated under the same conditions, then
In practice, such near-ideal conditions pertain even for targets in which the energy loss is several tens of kiloelectronvolts provided the reaction cross-section is constant or varies negligibly in the energy region concerned. Targets between 0.1 and 1.0 mg/cm2 can still be considered as thin targets when irradiated with proton or deuteron beams of a few MeV. To be able to cope with thicker samples for which the energy loss approaches the resolution of the spectrometer, and especially if the cross-section does not remain constant in the energy region around that of the bombarding beam, the particle yield may be corrected by using the effective cross-section as that value pertaining to the average energy of the beam through the sample. Such a simplification ceases to be valid if the sample is so thick that the energy loss of the incident beam is greater than the resolution of the measuring system, when not only the height but also the shape of the peak in the spectrum would be altered. In the case of a thick target, there is an appreciable degradation of the energy of the bombarding particle beam within the target material. The energy of the particle produced by such a degraded beam will depend on the energy of the bombarding charged particle at the point at which reaction occurs. Clearly, this will result in spreading the energy of the particle group from its maximum value, when reaction occurs at the surface of the target, to zero in an 'infinitely' thick target. Furthermore, because the cross-section is also a function of the energy of the incident particle, the rate of particle emission will vary through the target material, and hence, the energy spectrum of the particles from a selected particle group should provide information about the concentration of the target nuclide as a function of the depth to which the bombarding particle has penetrated. The energy of an incident monoenergetic charged particle beam in a thick target matrix will be a function, E(x), of the distance, x, to which the particle has penetrated, and
dE where -represents the stopping power of the matrix; its value can be derived from table^.^ dx Equation 5 can now be rewritten to give the rate of particle production from a layer of thickness dx at a depth x below the surface:
Volume 11
149
p{E,,E(x)) is the straggling function representing the probability of a bombarding particle arriving at a depth x with an energy E(x) and N, is the number of target nuclei in the layer concerned. The energy of the emitted particle can then be calculated from Equation 1 but corrected for energy loss on its path from the site of generation to the detector. Straggling functions can be calculated from t h e ~ r y and , ~ useful coefficients have been t a b ~ l a t e d . ~
11. PARTICLE-INDUCED GAMMA-RAY SPECTROMETRY There is little doubt that the technique of particle-induced prompt photon spectrometry (PIPPS), or as it is sometimes called particle-induced gamma emission (PIGME), is experimentally the easiest form of prompt activation analysis with charged particles. This is due to the fact that gamma rays are sufficiently penetrating to be able to escape, from the vacuum line where the irradiation takes place, to an external detector, and because the gamma-ray photons, even though a fraction may be absorbed by matter in their path, reach the detector without energy change. Accordingly, gamma-ray spectrometry does not readily lend itself to determination of concentration profiles, except when the excitation function shows sharp resonances. Among the earliest applications was the determination of beryllium in air-borne dust by measurement of the gamma rays emitted during the irradiation with alpha particless from 2LoPoand the determination of fluorine in glasses by measuring the energetic gamma rays emitted under proton bombardmenL6 Since then interest in the technique has grown apace. Accelerated protons, and to a lesser extent, helium ions were at first the favored means of excitation, but with improved accelerator techniques more attention was given to heavier ions as well. A comprehensive bibliography7 which included the literature published to the end of 1976 revealed that most investigations made use of proton beams and of these, many of the investigations were confined to studies on low-Z elements, such as fluorine, sodium, aluminum, and silicon. Furthermore, relatively low bombarding energies were used in these investigations. A notable exception was the use of cyclotron beams8 of up to 8 MeV. More recently, there has appeared a series of surveys each extending the knowledge of prompt gamma-ray spectrometry to areas of application that had previously been poorly documented. Thus the prompt radiations from a wide range of elements under bombardment with protons up to 4 MeV were studied9 and attempts were made at estimating the attainable sensitivities. The data obtained from the wide-ranging investigation from the Belgium group ' ~ a survey covering the elements Ti and Zn, bombarded as thick targets were s ~ m m a r i z e din with protons up to 3.5 MeV. Subsequently, a complete survey of 77 elements was carried out with protons between 3.5 and 6.0 MeV aimed specially at the analytical applicability of this technique." The relative yields reported" were those measured under identical conditions so that direct comparisons could be made for spectra of different elements, and the values may be applicable for the analysis of complex matrices under changed experimental conditions. The paucity of analytical data for alpha particle (4He+) bombardment was largely remedied by a systematic surveyI2 in which the gamma rays induced by 5-MeV beams were summarized. Further data were also reported for beams of 11 and 16 MeV.I3 The nuclear reactions induced by particles with low binding energies are highly exoergic with the result that prompt gamma-ray spectra measured under such conditions are likely to be complex because of the many nuclear energy levels that are available for the decay of excited product nuclei. No systematic study of prompt gamma-ray emission has yet been reported for deuteron bombardment, although possibilities of analyzing light elements were among the earliest applications of this technique.14,15Only 1 application of this technique with triton beamsI6 appeared in the literature prior to the publication of a systematic study
150
Activation Analysis
covering over 30 elements and providing information for irradiations with tritons up to 3.5 MeV." Similarly, the possibility of using 3He-ion beams to determine light elements in metals was indicated,'* but no systematic study was undertaken. With heavy ion beams, the nuclear interactions most likely to be useful for analytical purposes are Coulomb excitation reactions for incident energies below the Coulomb barrier. Bombardments at energies near or above the Coulomb barrier will result in a variety of nuclear reactions with a complex mixture of residual nuclides, each of which will contribute its characteristic decay gamma rays, causing complex gamma-ray spectra and introducing the possibility of extensive nuclear interference.I9 A survey of the possible use of 55-MeV 3sC1-ion beams showed most elements could be determined at concentrations often well below the mglg range."
A. SENSITIVITY OF ANALYSIS The sensitivity of analysis, based on the measurement of a particular gamma ray will depend on the integrated counts under the relevant spectrum peak, but, since every peak has to be measured against a background continuum, the intensity of the background will determine the sensitivity of analysis. If C , , and C,, refer respectively to the nett integrated counts under the spectrum peak of interest and the integrated background under the same peak, then three regions of concentration may be considered for which the sensitivity is given2' by
1.
2.
3.
A concentration region where the nett peak is sufficiently precise to enable quantitative analysis to be carried out with a relative standard deviation of less than 10%. In this region r 2 10. A lower level of concentration where the nett peak is sufficiently intense for qualitative analysis but where quantitative analysis become more inexact. In this region 10 > r 2 3.29. The lowest concentration region where the definition of the nett peak is indistinct and qualitative analysis becomes unreliable. In this region 3.29 > r 2 1.64.
Most workers accept as a rule of thumb, that the sensitivity is given by
A flux of monoenergetic gamma rays interacting with a detector will produce a spectrum containing a photopeak, representing the energy of the gamma ray, and a continuum caused mainly by Compton events in the detector. The background under a selected peak would thus consist largely of the sum of the continua generated by every gamma ray of higher energy. Such a background is unavoidable and in the case of a pure element, the background would be of the lowest attainable intensity. Since the yield of prompt gamma rays from the bombardment of a thick target increases with the bombarding energy, it may be expected that the attainable sensitivity would also improve with increased energy. However, with higher bombarding energy there is an increase in the flux and in the number of different prompt gamma rays that may result from the increased number of modes of decay available to the excited product nuclide. Accordingly the intensity of the Compton continuum is also - -
barding energies have to be determined experimentally for each case, but experience with protons has shown that for multielemental analysis, an energy of 4.5 MeV is a good compromise.22
i
Volume I1
4
151
B. NOMENCLATURE OF PROMPT GAMMA RAYS Although a prompt gamma ray is emitted from the de-excitation of the product nucleus of a reaction, the analyst is really concerned with the target nuclide on which the nuclear reaction was carried out, since it is the target nuclide which is a component of the sample being analyzed. It is, therefore, much more meaningful to the analyst to label prompt gamma rays with the target nuclide. In defining the conditions of analysis, the nature of the bombarding beam becomes known and need not be stressed again. Thus the nuclear reaction is uniquely identified if the target nuclide and the light reaction product are given. Accordingly, the following Analyst's Convention is used for gamma-ray assignment.16 1.
2.
3. 4.
In the nuclear reaction A(a,b)B, the gamma ray is written as A b(r,s) where b is the prompt light product of the reaction and the gamma ray is emitted from the de-excitation of the heavy product (B) from level r to level s. If particle b is the same as particle a, as for example in Coulomb excitation, it may be omitted. When the target nucleus may be inferred unambiguously from the context, it may be omitted. When a prompt gamma ray arises from a reaction not directly induced by the bombarding particle, both incident and product particles are specified.
Thus for example, if magnesium is bombarded with protons, the 1637-keV gamma ray from the reaction 26Mg (p,a) 23Naproduced by the decay of 23Nafrom the second excited state at 2076.4 keV to the first at 439.9 keV is labeled 26Mg a ( 2 , l ) . The same gamma ray produced from 23Naby Coulomb excitation under proton bombardment is labeled 23Na(2,1) (according to rule 2). Fast neutrons, from neutron-generating reactions in the target, interacting with Ge of the detector may also produce prompt gamma rays. According to rule 4, the 834-keV gamma ray produced in this way is labeled 72Gen,nf(2.0). All prompt gamma rays referred to below are labeled according to the Analyst's Convention.
C. CATALOG OF PROMPT GAMMA RAYS In order to make proper analytical use of particle-induced prompt gamma-rays information is required, not only of those gamma rays which are produced with high yields, but also of low yield gamma rays which may be generated in relatively high intensities if the target element is a (major) component of the matrix. Furthermore, the analyst requires yield data from many elements obtained under the same experimental conditions in order to be able to judge the plausibility of using PIPPS to advantage and to evaluate the effect of interferences from other target components. For protons, a bombarding energy of 4.5 MeV is a good compromise for multielemental analysis.'* Prompt gamma-ray yields induced by 4.5-MeV protons are listed in Table 1 in increasing order of photon energy, except that frequently, gamma rays of close-lying energies emitted from the same element, are grouped together." The yields are expressed in counts per unit solid angle and unit current, in order to allow the analyst to judge the applicability of particular gamma rays directly, as they would appear in the gamma-ray energy spectrum. The data were collected with a 50-cm" Ge(Li) detector. Absolute yields were not calculated because the low efficiency of detectors for high energy gamma rays would result in relatively weak spectral peaks even if the absolute yield were appreciable. Furthermore, since most of the data were obtained from pure elemental targets, corrections for differences in stopping power have to be applied when analyzing materials of complex matrices. For helium4 ions similar yields are given in Table 2 for bombarding energies of 5, 11,
152
Activation Analysis
TABLE 1 Yields of Proton-Induced Prompt Gamma Rays At E, = 4.5 MeV EkeV
Assignment
Ho-165 (1,O) Dy-163 n(l .O) Cd-111 (2,l) Ru- 104 n(2,O) U-235 n(6,2) Ti-48 n(4.2) Ag-107 (3,2) U-235 n(5,l) W-183 (2,O) W-182 (1,O) W-180 (1.0) Cd-106 (4,2) Tb-159 (3,2) Zr-91 n(1,O) Gd-155 (3,2) Pr-141 g(4,2) Ge-76 (6,s) U-235 n(7,4) Te-125 (2,l) 0-18 g(l ,O) Eu-151 (3,O) Tm-169 (2,l) F-19 (1,O) Nb-93 n(3,2) Eu-151 (4,2) Br-79 n(6,4) W-184 (1,O) Ni-61 a(3,O) Fe-58 n(3,O) 0s-187 (5,l) As-75 n(1,O) U-235 n(6,l) Th-232 (2,l) Ga-71 g(8,6) Pd-109 (1,O) Te-125 n(1.0) 0s-189 n(2,O) Lu-175 (1,O) 1-127 n(4,2) Dy-163 (3,2) Sn-122 n(7,2) Cu-65 n(2,O) Ho-165 (2,l) In-115 n(2,l) Re-187 n(5,O) Sn-115 (2,l) La-138 (2,l) Tm- 169 (2,O) Rh-103 n(1,O) Ba-135 n(1,O) 0s-184 (1 ,O) Ru-96 n(6,4) Ge-76 n(3,O)
i
Counts (sr-lnC-')
EkeV
Assignment
Tb-159 n(3,l) Sm-147 (1,O) Sn-122 n(3,O) Ca-48 n(2,O) Tb-159 (5,3) Sm-152 (1,O) U-235 n(7,3) W-186 (1,O) Fe-57 (2,l) Hf-179 (1,O) Gd-154 (1,O) Nb-93 g(7.5) Hf-174 g(4.0) 1-127 n(1,O) Re-185 (1,O) Mn-55 (1,O) Ru-101 (1,O) Fe-57 n(3,2) Ru- 104 n(3,O) h-I91 (2,O) Ru-104 g(1.0) Tm-119 (3,2) Br-79 n(1,O) Nd-150 (1.0) Ca-48 n(1,O) Hf-177 n(3,O) Th-232 g(12.3) Se-74 g(1,O) Te-120 g(2,O) U-235 n(5,O) As-75 n(2,O) Hf-179 n(2,O) Re-187 (1,O) Eu- 151 n(5,O) AS-75 (5,2) Ta-181 (2,O) Hf-180 g(2,O) Tb-159 n(2,O) Hf-177 (2,l) Re-185 g(1,O) Tb-159 (2.0) Lu-175 (2,l) Ir-193 (3,O) Mo-98 n(5,O) La-139 g(1,O) Mo-98 g(1.0) As-75 n(5,3) Ga-71 g(2,l) Ag-109 n(12,l) Br-79 n(4,2) R-141 (1,O) Bi-209 n(8,5) Ga-69 n(2,l)
Counts (srlnC-')
Volume 11
153
TABLE 1 (continued) Yields of Proton-Induced Prompt Gamma Rays At E, = 4.5 MeV Counts
Counts EkeV
Assignment
Gd-155 (2,O) Hf-179 (3,l) 1-127 (2,l) Ni-62 n(4,2) Br-79 n(2,O) Se-74 a(2,O) Rh-103 n(3,l) Se-77 n(4,O) Se-78 n(4.1) Zr-92 n(3,l) Ru-99 g(3.0) Rb-85 (1,O) U-235 n(7,2) Ti-49 n(2,O) Cu-63 n(3.1) Cr-52 a(2,O) Ho-I 65 (5,3) 0s-188 (1,O) Re-187 g(1,O) Ba-132 n(1,O) Cr-54 n(2,O) 0s-187 (8,4) Re-187 n(4,3) Se-77 a(1,O) Hg-199 (1,O) Sn-117 (1,O) Hf-180 g(3,O) Sb-123 n(1,O) Re-185 (2,l) Ni-64 n(1,O) Ti-49 (2,l) Sn-122 g(1,O) Sb-123 (1,O) CS-133 (2.0) Br-79 n(4,l) Se-77 (1,O) Zr-90 n(3.1) Th-232 g(8,O) Zr-92 n(5,2) Ta-181 (4,2) Hf- 180 g(4,2) Ge-76 n(4,O) U-235 n(7.1) Re-187 (3,l) Sn- 122 n(6,O) Dy-164 (2,l) Th-232 g(9,O) Ba-130 g(3.1) Se-76 a(4,2) Zn-67 n(1,O)
(sr- 'nC- ')
EkeV
Assignment
A1-27 (2,l) Hf-177 n(4,O) 1-127 n(2,l) 1-127 (3.2) Te-125 (7.5) I%-192 (3.2) Au-197 n(4,l) Eu-151 (2,l) Zn-68 n(1,O) Ga-69 g(2.1) Te-125 (3,O) Yb-174 (2,l) Ba-138 n(6,2) Er- 167 n(5,O) Zr-96 n(2,O) Ru-104 n(4,O) Hf-179 n(3,O) Mo-98 g(3.0) Ru-101 n(2,O) Ba-132 n(2,O) U-238 n(6,O) Br-79 n(3,O) Ni-64 n(3,l) Zn-67 (2.0) Dy-162 (2,l) TI-205 n(5,3) Lu- 175 n(3,O) 0s-187 n(3.0) 0s-189 n(4,2) 0s-190 (1,O) 0s-187 (6,O) 0s-187 (7,O) 0s-188 n(3,O) 0s-189 (4,l) TI-205 n(5,3) Pd-109 (2.0) U-235 (25,13) AS-75 (6,3) Lu-176 (2.1) Br-81 n(1,O) Pd-110 n(2,O) Au-197 (2,l) Zn-64 g(1,O) Pd- 108 (4,O) Tm-169 (4,3) Pr-141 n(1,O) Cu-63 n(1,O) Sn-122 n(9,l) Pd-106 g(1,O) Bi-209 n(9,5) Zr-92 n(6,3) Se-80 a(1,O) Bi-209 n(6,4)
(sr-Id-')
154
Activation Analysis
TABLE 1 (continued) Yields of Proton-Induced Prompt Gamma Rays At E, = 4.5 MeV EkeV
Assignment
Counts (sr-kc-')
EkeV
Assignment
R-195(4,O) Se-80 n(10,5) Sb-121 n(1,O) h-191 (4,2) Hf-180 (2,l) I- 127 (4,2) Se-80 a(2,O) Se-74 (2,l) Se-80 n(3,l) Mo-97 n(2,O) RU-96 (5,4) Br-79 n(6,3) Ir-193 (5,2)
Os-189 n(5,l) TI-203 n(4,3) Ti-50 n(1,O) Ti49 a(3,O) MO-96 g(3,l) Tm-169 (5,2) Sm-147 n(1,O) As-75 n(13,7) La-138 (5,O) Sb-121 n(3,l) Rb-85 n(1,O) Sr-88 n(1,O) Gd- 154 (6,4) U-238 n(14,5) Ga-69 n(2,O) Zr-96 n(3,O)
]
Se-76 a(5,3) w-180 (2,l) Pd-110 n(4,O) Nb-93 (7,3) TI-205 g(6,4) Ge-76 n(8,3) As-75 n(9,5) Hf-179 n(4,O) Pd-l 10 n(5,O) Zn-68 g(5,3) Rb-85 n(2,O) Pt-195 (5,O) U-238 g(9,O) Dy-164 (2,O) Mo-92 (3,2) Bi-209 n(7.3) 1-127 (5,3) Rh- 103 n(2,O) Se-80 n(5,l) Sb-121 n(2,O) Ba-130 g(6,3)
Counts (srrlnC-I)
Volume 11
155
TABLE 1 (continued) Yields of Proton-Induced Prompt Gamma Rays At E, = 4.5 MeV Assignment Bi-209 g(2,l) C d - I l l (1,O) Ag- 109 n(7.4) Ga-69 (13.9) Se-82 n(3,I) Hg-199 (5,2) Sb-123 n(2,O) Pd-1 I0 n(6,O) Cu-63 n(2,O) Hf-177 (2,O) Au- 197 n(3,O) Cr-54 n(4,2) LU-175 (2,O) Zr-94 n(6,2) Ge-73 n(3,O) La-139 n(1.0) Sn-122 n(9,O) Cd-113 n(2,l) Ag- 109 n(5,2) TI-205 n(2,I) Se-80 g(2,I) Br-79 (3,O) Ru-99 n(4,2) Cd-113 (1,O) As-75 (2,O) Ni-61 n(5.4) K-41 (3,2) Pd-100 n(7,O) Rh-103 n(3,O) Nb-93 g(9,5) AU-197 (6,3) Au-197 (2,O) Hf-197 (3.0) Se-76 a(6.3)
Sn-119 n(1,O) Sn-115 n(1,O) Sn-117 n(2,l) Se-80 n(4,2) Tl-203 n(6,3) Th-232 g(16,O) Ni-64 n(2,O) Br-81 (1,O) Se-80 g(1,O) Br-79 n(9,2) Cs-133 (4,2) cs-133 n(2,1)1 Hf-177 (5,l) Cd- 114 n(2,O)
1
Au- 197 (6,2) A"-197 (3,O) Cs-133 n(3,l) Tl-208 (1,O) Ba-137 (1,O) AS-75 (3,O)
Counts (sr-kc-')
Assignment Pd-105 (1,O) Os-188 n(5,O) Sb-123 n(3.1) OS-192 (2.1) Re-185 (2.0) Hg-199 (6,2) Ag- 109 (5.4) Se-76 a(8.4) Cs-133 n(5,3) EU-151 (4.1) As-75 n(3.0) Ga-69 n(3.2) Ag-I09 n(3,l) Cd-116 n(9,l) HO-165 (5,2) Th-232 g(17,O) La-139 n(5,4) Cs-133 n(4,l) Nd-93 g(3.2) Se-80 g(4.1) Se-82 n(3,O) Se-86 n(8.2) Cs-133 n(3,O) W-183 (4.0) Bi-209 g(3,l) Sc-45 n(3.1) As-75 n(4,O) LU-176 (3,2) Zr-94 n(7,l) Sb- 121 n(3.0) Mo-95 n(3.2) Rh-193 (3,O) Ge-73 (5,3) Tl-205 n(8,4) Gd-156 (3,2) Ho-165 n(6,O) Os-186 (2,l) Ru-102 g(3,O) Bi-209 n(8,3) Dy-160 (3,l) MO-94 g(2, I) Dy-163 n(2,O) Cd-113 n(2.0) Au-197 n(4,O) Se-82 n(4.2) lr-193 (5,O) Re-187 (3,O) Ta-181 (4,O) Hf- 180 g(4,O) Nd-148 (1.0) Ge-76 (3,2)
i
"'"0'1
Cs-133 (3.1) cs-133 Br-79 n(7,2)
Counts (sr-kc-')
156
Activation Analysis
TABLE 1 (continued) Yields of Proton-Induced Prompt Gamma Rays At E, = 4.5 MeV EkeV
Assignment Ba-130 g(4,O) Th-232 g(20,O) AS-75 (4,O) Zr-96 (4.3) Ru-101 n(3,O) Br-79 (4,O) Hf-178 (2,O) Ru-101 (2,O) Ga-69 (6,4) Eu-151 (4,O) Au-197 n(5,O) Se-82 g(5,2) TI-203 g(5,2) Ti-48 n(1.0) Se-76 a(5,2) Th-232 g(23.3) Zr-96 (3,1) Cd-114 g(2,O) Ag-109 (3,O) Co-56 n(4,3) Ni-61 a(4,2) AS-75 (13,7) Se-80 n(6,O) Hg-202 n(2,O) V-51 n(5,3) As-75 n(5,l) Cd-113 (3,O) T1-205 g(7.4) 1-127 (3,l) Ba-137 g(9,4) Ga-69 (1,O) Nb-93 (8,3) Zn-68 g(1.0) Ti-50 g(1,O) Br-79 n(7,l) Th-232 g(24,4) V-5 1 (1,O) Ti-50 n(2,O) 211-68 n(5,l) 1-127 n(3,O) Hf-177 (3,O) Pd- 104 g(3,l) Gd-155 (4,O) Se-74 a(4,3) Re-187 g(2,l) 211-67 g(2,O) Mo-97 n(3,O) Pd-106 g(3,O) Ag-107 (2,O) Ag-107 n(2,O) Nb-93 g(6,4) Sm-149 (3.1) Pt-194 (1,O)
Counts (sr-lnC-I)
EkeV
Assignment Zr-94 n(10,4) Se-76 a(5,l) Se-80 n(7,l) Se-82 n(4,l) Hg-201 n(1,O) Sn-124 g(1,O) Sb-121 (4,l)
I
Sm-150 n(l,O)l sm-144 (1,O) Sr-88 (5,3) Ba- 130 g(8,4) Se-78 n(12.1) Mo-95 n(2,O) In-115 (1,O) W-180 (2,O) Hf-180 (3,2) AS-75 (9,3) T1-203 n(8,3) Nb-93 (5,l) Cs-133 n(6,3) Hf-180 g(5.0) Co-59 n(1,O) Ni-62 a(4,l) Ba-138 n(7,l) Au-197 n(7.1) W-186 (3,2) Cd-111 (2.0) Dy- 164 (5,3) h-191 (5,O) Se-80 a(6.2) n(8,1)l Se-76 Hf-179 n(6,O) Zr-94 n(7,O) Cd-116 g(3,l) Pd- 105 (4,O) S-33 (3,2) Gd- 154 (3,2) Pd-105 n(3,O) Se-82 n(5,2) Sc-45 (7,4) Ag-109 n(3,O) Tb-159 (4,O) Te-130 (6,3) Ni-62 n(4,l) Sm-149 (3,O) Se-82 g(7.2) Ge-72 (5,l) Br-79 n(8,3) Hg-202 n(3,O) W-I82 (3,2) Dy-163 (4,O) k-191 (6,O) Fe-56 (3,l)
Counts (sr-Id-')
Volume I1
157
TABLE 1 (continued)
Yields of Proton-Induced Prompt Gamma Rays At E, = 4.5 MeV EkeV
Assignment Mo-98 n(9,O) Cr-53 g(4,l) 0s-186 (12,7) Ge-73 (4,O) Ti-48 a(2.1) Au-197 n(11,2) Rb-87 n(3,2) Ru-101 n(4,O) In-1 15 g(4,2) R-196 (1,O) Hf-179 n(7,O) CS-133 (4,l) Se-82 g(1,O) Ho-165 n(8,O) Zr-92 n(4,O) Y-89 n(3,2) Ba- 130 (1.0) Rh-103 (4,O) Ru-104 (1,O) Ir-193 (6.0) Se-74 a(3,2) Re-187 n(8.3) Zn-67 n(2,O) 1-127 (4.1) Ho-165 (4,O) Se-74 a(3,l) Ag-107 (4,3) Hg-202 g(4,O) Sc-45 (2.1) CU-63 (3,1) Ag-109 n(4.1) Fe-58 n(4.0) Se-80 n(7.0) Fe-57 (3,O) Hg-200 (1,O) Ti-48 a(2.0) CU-65 (3,l) 1-127 (9,3) Tb-159 (6,l) Te-125 n(4,O) Ca-43 (1,O) Ni-61 (3,2) As-75 (7,l) Ga-69 n(3,O) 0s-192 (3,l) 1-127 (3,O) Hf- 179 (5,O) Cd-114 n(5,O) Ca-44 g(2,O)
Counts (sr-'nC-')
EkeV
Assignment Sc-45 (2.0) Se-82 n(4.0) Cr-53 n(1.0) Pd-110 (1,O) Pb-85 g(6,3) Rh-103 n(4,l) Th-232 g(27,3) Fe-57 n(5,2) Rb-87 n(4,2) Sn-122 g(2.1) Sb-121 n(9,I) sb-123 Cs-133 (3.0) K-41 (6,2) Te-130 g(6,2)
I 1
Br-79 n(10,4) n(5,0) Mn-55 n(3,2) Rh-103 n(5,l) Hg-196 g(1,O) Rb-87 n(1,O) Sr-87 (1,O) Mg-25 (2,l) Dy-163 (5.0) Ga-71 (1,O) Hf-177 (5,O) Lu-176 (4.2) Se-78 n(13,O) Ir-I91 (7,O) Ag-109 (5.3) Cd- 113 n(1,O) Ti-49 n(5.3) Te-130 (6.2) Se-76 a(5,O) 0s-190 (5,2) As-75 (12,6) Ca-43 (3,2) Ga-69 n(4,O) Se-82 n(6,2) As-75 (5,O) TI-203 (2,l) Br-79 n(6,O) Rb-87 (1,O) K-41 (7,2) Cr-54 n(4,O) Se-80 n(16,6) Pt-198 (1,O) Te-125 (4,l) T1-203 n(3,2) Ru- 104 g(4,O) 1-127 n(4,O) Mn-55 n(1,O) Fe-54 (4,2)
Counts (sr-'nC-I)
158
Activation Analysis
TABLE 1 (continued) Yields of Proton-Induced Prompt Gamma Rays At E, = 4.5 MeV EkeV
Assignment
Hg-198 (1,O) B-10 (3,2) Sc-45 n(4,2) 1-127 (5,2) Be-9 g(3.2) Ag-109 (4,O) As-75 (9.1) 1-127 (4,O) Y-89 g(4,2) 0s-192 (5,2) Hf-179 (6,O) Dy-163 (7,O) Ru-101 (6,O) Ni-58 g(2.1) Pd-106 g(4,O) Ag-109 n(4.0) Se-76 a(7,2) SC-45 (13,8) Au-197 n(9.5) AS-75 (14,9) Hg-196 (1,O) Hf-178 (4,3) Hf-177 (7.0) Ru-99 n(3,O) As-75 n(5,O) Te-125 (5,l) B-10 a(1,O) Se-76 a(6,O) N-15 g(2,O) Li-6 g(1,O) Li-7 n(1,O) Se-80 n(9,l) Co-59 n(8,5) SC-45 (6,3) Pd- 105 (5,O) Pd- 105 n(5,O) Pd-108 (1,O) 0s-186 (4,2) Nb-93 g(5.3) Ba-138 n(9,l) Sb-121 n(4.0) Rb-85 g(8,4) Sn-120 g(4.2) Hg-202 (1.0) Na-23 (1,O) Mg-26 a(1,O) Dy-163 n(3,O) Sb-123 n(3,O) TI-205 n(4,2)
Counts (sr-'nC-I)
EkeV
Assignment
Ru-96 (6,5) Ge-73 n(5,l) Pd- 105 (5,O) 1-127 (12,7) Te-125 (4,O) Au-197 n(9.2) In-1 15 (7.2) Br-81 n(8,3) Br-81 n(5,l)) Pb-208 n(1,O) Th-232 g(26,O) Ag-109 (6,4) Ba-137 n(1,O) CU-63(4,2) ZI-96 (4.2) Te-130 g(3,l) Tm-169 (6,2) Nd-146 (1,O) Te- 125 n(5,O) Se-80 n(10,l) Br-81 n(2,O) SC-45 (1 1,6) As-75 (1 1 3 ) 1-127 n(5,l) 0s-188 (4,2) Ag-107 (4,2) Ag-109 n(5,O) Te-125 (5,O) Sb-121 n(6,O) Co-59 n(2,O) As-75 (12,5) Fe-57 n(4.1) Se-80 n(9,O) As-75 (6,O) Se-82 n(7,2) Sb-121 (2,l) As-75 (14,7) Ho-165 (7,l) Ru-102 (1.0) Au- 197 n(7,O) Sb-121 n(7,O) Ni-61 n(1,O) Br-79 n(9,3) Mn-55 n(4,2) Li-7 (1,O) 0s-188 (3,l) La- I38 (8,O)
Counts (sr -'nC -I)
Volume 11
159
TABLE 1 (continued) Yields of Proton-Induced Prompt Gamma Rays At E, = 4.5 MeV Counts
Counts EkeV
Assignment
Rb-87 n(2,l) AS-75 (13.5) 0s-188 (5,2) 0s-188 n(7,O) 0s-192 (2,O) 0s-186 (1 1,6) 0s-187 (8.1) In-155 n(4,l) 1-127 p(17,9) Hg-202 (4,O) Ni-58 g(1,O) Se-80 n(10.0) Nb-93 g(4,2) Er-167 (6,l) 0-16 g(1,O) Ru-101 n(7.3) In-1 15 n(1,O) Pd-108 (2,l) Sn-115 (1,O) La-139 n(3,l) Ga-69 (7.4) Rb-85 n(3,2) Rh- 103 n(5.0) Te-123 (5,O) Ag-107 n(4,O) Y-89 n(2,l) Sb-121 (2,O) Pr-141 g(2,l) Zn-70 n(1,O) Cu-65 (4,2) Ge-73 n(5,O) Pb-208 n(2,O) La-138 (9,O) Br-81 n(6,l) Ga-71 (3,O) Re-187 (6,O) Pd-105 (1.0) Eu-151 n(7,l) Br-79 n(9,2) 1-127 (8,2) C d - I l l (7.2) Ho-165 (6,O) Th-232 g(30.1) Ca-40 n(4,3) Bi-209 n(12,7) Ga-71 (4,l) Mn-55 n(2,l) Se-71 (7,O)
(sr-'nC-')
EkeV
Assignment Br-79 (6.0) Pr-141 g(3,l) Ag-107 (5,3) Sn-117 n(1,O) Th-232 g(3 1,O) 0s-187 n(13.5) Sc-45 (3.1) Sb-121 n(8,O) Rh-103 n(6,O) Er-167 (5.0) Ga-69 (5,2) Zr-96 (6,3) Ho-165 n(13,O) Mo-100 (1,O) Sb-121 (3,l) Rb-85 n(5,l) Br-81 n(8,2) Dy-156 (3,l) Cd-111 n(1,O) Se-80 g(3,O) Br-81 (2,O) Te-123 (6,l) Ru-100 (1,O) Sn-122 g(2,O) Sb-123 (2,O) Se-82 a(2,l) Ti-48 a(3,O) Hg-203 (4,O) SC-45 (3,O) Ru-101 (10,O) Bi-209 n(1,O) Ge-76 (2,l) Ru-101 n(7,2) Au-197 (6.0) Hf-180 (3,l) Br-81 n(3,O) Rb-85 n(9,5) Sm-148 (1,O) Pd- 106 g(8,4) Se-80 g(8,l) Pd-104 (1,O) Pd-102 (1,O) AS-75 (1 1,4) AS-75 (10.2) As-75 g(1,O)
I
0s-190 (1276)1 (3,O) Os-lS6 Cd-I14 (1,O) Se-76 (1,O) CS-133 (7,1) Tb-159 (9,l) Zr-92 (3,l) Te-120 (1,O)
(sr-'nC-I)
160
Activation Analysis
TABLE 1 (continued) Yields of Proton-Induced Prompt Gamma Rays At E, = 4.5 MeV EkeV
Assignment
Counts (ST-'nC-I)
EkeV
Assignment Mo-95 (3,l) Ca-43 (2,O) Ho-165 (10,2) 1-127 (7,l) Sb-121 n(9,O) Ti-49 n(3,2) Ga-71 (6,3) As-75 (11,2) Hf-176 (3,O) Lu-175 (4,O) Pr-141 n(9,3) SC-45 (15,ll) B-10 a(2,l) 1-127 (15,5) K-41 (4,l) Sr-84 (4,2) Te- 124 (1,O) 1-127 a(1,O) Pb-208 n(3,O) As-75 (12,2) V-51 n(4,l) Ba-134 (1,O) CS-133 (5,O) Br-79 (7,O) As-75 (13,3) 0s-189 n(l1,l) Pt-194 (5,2) Rh-103 (7,l) Hg-196 g(2,O) Br-81 n(4,O) Hf-174 (3.0) Ho-165 n(15,O) Ge-74 (2,l) V-51 (2,l) Ru-102 g(6,O) Hg-196 (2,l) CU-65 (5,2) Th-232 (6,2) Pt-192 (2,O) In-1 15 n(2,O) Ag-109 n(7,l) Se-78 (1,O) Hf-180 g(9,O) W-186 (3,l) As-75 n(7,O) Zr-96 (4,l) Cd-106 (2,l) Br-79 g(1,O) Ru-101 (1 1,O) Tb-159 (9,O) Ru-99 (6,O) Cd-112 (1,O) AS-75 (9,O)
Counts (srrlnC-I)
Volume 11
161
TABLE 1 (continued) Yields of Proton-Induced Prompt Gamma Rays At E, = 4.5 MeV EIkeV
Counts (sr-'nC-')
Assignment AU-191(7,2) TI-205 (2,O) 0-18 n(5,3) Ga-71 (6,2) Cd-110 (4,O) As-75 (10.1) Ag-107 (15,2) Tm-169 (7,l) Rh- 103 n(7,O) Th-232 (12,3) 1-127 (6,O) Mo-95 n(3,O) OS-188 (3,O) Hf-178 (3,0) Cd-108 (1,O) CS-133 (6,O) Ag-107 g(1,O) Se-74 (1,O) Se-82 n(8,O) Te- 125 n(6,4) Cu-63 n(4,O) Zr-94 n(10,O) La-138 (11,O) Sn-124 g(2,O) AS-75 (14,s) Sn-119 n(2,O) Se-82 n(9,l) Cd-114 (3,l) Se-80 g(5.0) Zn-70 n(2,O) Cu-63 n(5,O) Cu-65 n(4.2) RU-98 (1,0) Ba-135 (7.1) Se-82 (1.0) Ni-61 (3,O) As-75 g(3,l) Cd-100 (1,0) Ti-46 g(4,O) 0-18 n(5,2) 1-127 (8,l) Cd-166 g(3,O) As-75 (1 1,l) Tl-203 g(4.1) Th-232 (4,l)
I
ElkeV
Assignment
Counts (sr-lnC-')
162
Activation Analysis
TABLE 1 (continued) Yields of Proton-Induced Prompt Gamma Rays At E, = 4.5 MeV EIkeV
Assignment Hf-176 (4,2) N- 15 g(3.0) Zn-68 g(4,l) ~L.203n(7,2) Th-232 (4,O) Cu-65 n(4,l)
1
1-127 (12,3) (890) Ba-135 (5.0) B-10 (1,O) Be-9 g(1,O) Ru-99 (8,O) In-115 n(6,O) Sn-117 n(2.0) Ru-101 (16,O) SC-45(4,O) Nb-93 g(5,3) A1-27 (6,l) Ag-109 (8.0) Ag-107 (7.3)) Mo-98 (3,l) Sn-115 n(1,O) Th-232 (6, I) Se-74 (4,l) Ca-43 n(5.1) Br-81 n(7,I) Cd-114 n(7,O) Ag-107 (8,3) TI-203 n(6,l) Cd- 112 n(8,O) CU-63(4,l) Te-128 (1.0) Ga-69 g(8,3) Nb-93 (3,O) 1-127 (9,O) Ti-48 g(3,O) V-51 n(1.0) 1-127 (13,3) Ni-62 (6,3) 3 - 9 4 (4,l) Cu-65 n(5.4) Ba-135 n(12,l) Bi-209 g(5,2) La- 139 n(3,O) CU-63(9,3) Si-29 (2,l) Pr-141 n(2,O) Co-59 n(11,4) Sc-45 (9,3) Ba-136 (3,l) TI-205 n(4,O) Dy-164 (4,O) 0-18 n(5,l)
Counts (sr-kc-')
WkeV
Assignment
Counts (sr-'nC-I)
Volume 11
163
TABLE 1 (continued) Yields of Proton-Induced Prompt Gamma Rays At E, = 4.5 MeV Counts
Counts EkeV
Assignment Cu-63 g(2.1) V-51 n(6,l) Nb-93 (4,O) S-32 g(1,O) Fe-58 (1,O) Ga-69 n(5,O) Se-80 (3,l) Bi-209 n(13,3) Cd-1 10 (2,l) As-75 (10.0) Th-232 (9,l) Ru-100 (4.1) CO-39 g(2,l) Cd- 114 n(9.0) Ni-60 (2,l) Mn-55 n(7,3) Zn-67 n(3,O) Se-80 g(7.0) Se-82 (1 1,O) Se-74 a(4,O) Se-74 a(7.2) Cu-63 a(2,l)
I
Ag-107 n(lO.l)) (8.2) Ag-lW Ga-71 g(2,O) Zn-66 (2,l) Br-81 (7,O) n(971)~ Cr-54 n(5,O) Cu-65 a(2,l) 1-127 (11,2) S-33 (1 ,O) Co-59 a(1,O) Ba-138 n(l5,O) Sr-88 n(7.0) Zn-67 n(5.2) Mo-96 (2.1) Dy-164 (6,l) A1-27 (1.0) Mg-26 g( 1,O) Si-30 a(1,O) As-75 (14,l) Fe-56 (1,O) Mn-55 g(1.0) Ge-76 (3,l) Hf-180 (6,2) Nb-93 g(7,2) Ru-101 n(7,O) CU-65 (4,l) Cu-65 n(7.1) Cr-54 n(6,2) Ba-135 (6,O) 1-127 (18,4)
(sr-'nC-')
EkeV
Assignment
(sr-kc-')
164
Activation Analysis
TABLE 1 (continued) Yields of Proton-Induced Prompt Gamma Rays At E, = 4.5 MeV EIkeV
Assignment
Counts (sr-'nC-I)
ElkeV
Assignment
Counts (sr-'nC-I)
Volume 11
165
TABLE 1 (continued) Yields of Proton-Induced Prompt Gamma Rays At E, = 4.5 MeV EIkeV
Assignment As-75 (14,O) 1-127 (11.0) Cu-65 n(8,O) Cu-65 n(10,3) CU-63 (7,2) Ba-136 (4.1) Hf-180 (5,l) Sn-119 n(5,O) Ti-49 n(5,l) Zn-67 n(6,2) 1-127 a(5.1) Sc-45 (16,6) Th-232 (20,l) Cd-108 g(12,l) Ti-49 n(6,l) 1-127 (13,l) 1-127 n(7.1) Th-232 (18.1) Rb-85 g(1,O) Zn-68 (1.0) In- 115 (4.0) 0-18 n(3,O) Zr-91 n(2,l) Nb-93 (8.0) Hf-180 (7,l) Sn-119 n(7,O) Ti-47 (2,l) 1-127 (12,O) Ga-69 g(11,3) CO-59 (1,O) Cd-l 1 1 n(3,O) Sb-121 (6.1) Ga-69 (5,O) Br-81 n(10,O) Zn-68 g(5,O) S-36 a(3,l) Hf-180 (9,l) 1-127 n(9,4) Ga-69 g(4,l) Cu-63 (9.2) Cr-53 n(6,2) Ti-46 (2,l) Sc-45 (4.1) Hg- 199 n(3.0) W-182 (4,l) Th-232 (18.0) 0-18 n(4.0) Y-89 g(7,2) 1-127 (14.1)
Counts (ST-'nC-')
EkeV
Assignment Pr-141 (3,O) Zr-90 (6,3) Cd-113 n(4.0) In-1 15 (9,O) Cu-65 n(10.2) 1-127 (24,3) Bi-209 g(7,l) Ti-49 n(5,O) Ga-69 g(6.1) Th-232 (21,O) 1-127 g(3,l) V-51 n(10.3) Ti-49 n(6,O) Ca-44 (1.0) Zn-67 n(7,2) 1-127 (15,l) V-5 1 n(3,O) Mn-55 (3,l) Sn-120 (1,0) Ni-62 ( 1,O) Ba- 130 g(l l,O) Cu-65 a(1,O) Co-59 g(3,l) Cu-63 a(4,l) 1-127 n(8,l) Ga-69 n(13,2) 1-127 (14,O) CO-59 (2,O) Zn-67 n(8,2) A1-27 (3,2) 1-127 n(7,O) Zn-69 n(5,O) Zr-91 (1.0) Zn-68 g(7,l) Ga-69 (7.1) Sn-119 n(6,O) Cr-52 (3,l) Bi-209 n(4,O) 1-127 n(L0,3) Mn-55 n(7,2) Ga-69 g(2,O) Cd-116 (2,O) 1-127 (15.0) Cl-35 (1,O) Pr-141 n(3.0) Fe-57 n(2,O) Mn-55 n(11.3) Rb-87 n(3,O) Cu-65 n(12,2) Sr-87 (3,O)
Counts (sr-kc-')
166
Activation Analysis
TABLE 1 (continued) Yields of Proton-Induced Prompt Gamma Rays At E, EkeV
Counts (sr-'nC-')
Assignment 1-127 (16,O) Mo-98 (5,l) Ga-71 g(5.2) Sn-118 (1,O) La-139 n(12,3) Ba-136 (6,l) F-19 (3,l) Fe-56 (2,l) SC-45(8,O) Rb-87 n(7,2) Mn-55 g(2,l) Cu-65 n(13,2) 1-127 n(18.3) F-19 (4,2) Ba-136 (7,l)
cu-65 n(11,O) Cu-65 n(14*3' P-31 (1,O) Co-59 n(8,2) Si-29 (1.0) In-115 n(5,O) Cr-53 n(2,O) SC-45(9.0) CO-59 (3,O) Sn-116 (1,O) K-41 (2,O) Rb-87 n(8,2) Sn-114 (1,O) Co-59 n(5,O) Ga-69 n(12,O) Ba-136 (8,l) Cu-63 g(2,l) Ti-48 (2,l) Ni-61 (3,O) Mn-55 (3.0) La- 139 n(5,O) Ni-58 (3,l) 1-127 n(18,3) Bi-209 n(5,O) CU-63(3,O) Fe-58 a(4,2) Cu-63 a(1,O) Cr-52 (4,l) co-59 g(1,o) Ga-69 g(13,4) Ni-60 (1.0)
I
)
Zn-68 g(6,O) zn-66 (391) V-51 g(3,l) CI-53 (8,l) Ga-69 (6,O) Co-59 n(6,l) Th-232 (26.1)
EkeV
= 4.5 MeV
Assignment
Counts (sr-kc-')
168
Activation Analysis
TABLE 1 (continued) Yields of Proton-Induced Prompt Gamma Rays At E, = 4.5 MeV EkeV
Assignment
Counts (sr-kc-')
EkeV
Assignment
Counts (srrlnC-')
and 16 MeV, but in this case the data are arranged in order of atomic number of the target element,I3 and except for the case of carbon, only those gamma rays are listed which were observed with 5-MeV beams. As before, the data were recorded using a 50-cm3 Ge(Li) detector, and the relative intensities are recorded as counts per unit current.
D. APPLICATION OF PIPPS Some applications of PIPPS are listed in Table 3. Since the method as a whole is largely applicable to determinations involving concentrations of the order of mg g-', the major
170
Activation Analysis
TABLE 2 (continued) Relative Intensities of Alpha-Induced Prompt Gamma Rays 5 MeV
I (counts per mC) 1.6 El 3.1 El 3.6 El 5.6 El 3.8 E2 9.1 El 7.7 El 5.1 E2 6.3 El 1.3 El 4.3 El 6.9 El 3.0 El 1.4 E3 6.2 EO 1.O E2 1.6 E2 4.0 El 7.4 EO 2.9 El 9.7 El 3.1 EO 7.4 EO 1.6 EO 4.7 El 1.0 EO 1.0 EO 3.6 EO 3.2 El 2.8 EO 1.6 EO 1.4 El 4.3 El 1.1 El 3.9 E2 1.6 El 4.0 E l 5.1 EO 3.2 El 1.0 El 6.2 E2 7.5 E- 1 2.5 EO 8.4 EO 8.2 EO 3.5
EO
3.7 E3 3.6 EO 5.9 El 7.0 El 8.6 EO 1.6 EO 2.5 EO
11 meV
s (%o)
I (counts per mC)
16 MeV
S (%d
18 6.2 4.6 25 4.6 17 21 3.4 22 100 32 21 50 0.87 120 9.2 3.8 12 0.38 26 9.0 E4 0.35 4.6 3.8 Ed Not resolved from %Si(1.0)
I (counts per mC)
S (%o)
Volume 11 TABLE 2 (continued)
Relative Intensities of Alpha-Induced Prompt Gamma Rays 5 MeV
11 meV
16 MeV
I (counts per
I (counts per
I (counts per
Assignment
mC)
mC)
mC)
58Fe(1,O) 63Cu(1 ,O) (2,O) 6 s ~ ~,o)( 1 (2.0) %n (1,O) %Zn (1.0) (1 ,o) (290) (1,O) 79Br(2,O) (3.0) (49) (5,O) (6.0) ( 7 , ~ 8'Br (1,O) (3,O) 85Rb(1.0) %Zr(l,O) 9 5 (1 ,o) ~ ~ (2.0) 9RMo(2,0)} %Mo (1,O) ~'MO(1 -0) 99Ru(1,O) I0ORu ( 1,O) ln'Ru (1,O) 'O2Ru (1,O) lWRu(1,O) lo3Rh(3,O) (4,O) I"Pd (1.0) In5Pd(1,O) IO8Pd (1-0) "OPd (2,l) (1 70) Io7Ag(2,l) (1rO) (2,O) Io9Ag( 3 3 (290) (3.0) "OCd (1,O) "'Cd (2,O) IL2Cd(1,O) ")Cd (2,O) (6.0) ""Cd (1,O) I6'Er (2,O) I7OEr (2.1) "'Hf (1.0) '19Hf (1,O)
5.4 E - 1 9.6 EO 2.3 EO 1.8 EO 5.6 E-1 6.2 EO 2.0 EO 6.2 EO 3.6 El 9.0 E- l
1.4 E3 2.7 E3 1.4 E3 7.2 E2 7.7 E3 8.6 E3 6.3 E3 1.3 E3
1.3 E2 1.2 El 3.3 El 2.5 EO 1.6 E l 9.3 E- l 1.1 E2 4.3 EO 8.2 El 2.6 E- 1 5.7 El 1.5 EO 1.5 EO 1.9 EO 3.8 El 3.7 EO 4.8 El 2.5 E l 9.4 El 1.0 E3 6.9 E2 1.1 El 8.8 EO 1.3 E2 1.3 E l 1.5 E2 2.0 El 3.1 E2 1.2 E2 1.8 El 3.8 E2 1.4 E2 2.2 EO 1.7 El 8.2 EO 2.5 El 3.3 EO 2.0 El 1.6 El 3.6 EO 4.1 El 2.8 El
1.4 E3 2.6 E3 1.2 E4 7.6 E2 1.2 E3 1.0 E4 8.5 E3
8.9 E3 1.4 E5 7.0 E4
2.4 E5 1.2 E4 1.1 E4 1.O E3
2.6 E3 1.3 E3
1.1 E4 1.4 E3
9.4 E2 8.9 E2
2.2 E3 3.8 E3
4.4 E4 3.7 E4 3.2 E3 9.5 E2 2.1 E4
3.0 E4 3.0 E4 2.7 E3 1.8 E3 1.9 E3
1.5 E4 2.9 E3 1.2 E4 1.4 E4 1.4 E3 1.1 E4 1.6 E4 1.1 E3 1.8 E3 2.3 E3 3.9 E3 2.0 E3 5.1 E3
9.2 E3 6.8 E3 1.1 E4 5.7 E3 7.4 E3 9.9 E3 2.3 E3 4.3 E2 3.3 E3 1.1 E3 8.2 E2 7.7 E3
171
172
Activation Analysis
TABLE 2 (continued) Relative Intensities of Alpha-Induced Prompt Gamma Rays 5 MeV
16 MeV
I (counts per
I (counts per
I (counts per
mC)
mC)
mC)
1.2 E3 6.2 El 3.9 El 1.1 E2
2.9 E4 3.7 E3 3.8 E3 1.6 E3
5.3 E4 9.7 E3 4.5 E3 1.5 E4
2.6 E2 4.0 E2 6.5 E2 4.5 El 5.8 EO 1.1 E3 5.7 El
1.0 E3 3.1 E3 1.8 E4 1.9 E3 1.6 E2 5.4 E3 6.9 E3
2.0 E4 2.6 E2 8.0 E3 2.2 E3 3.5 E2 1.2 E4 4.0 E3
6.4 EO
7.5 E2
8.4 E2
2.9 E2 6.4 EO 1.3 El 1.4 El 5.1 E2 9.9 EO 4.5 E2 1.9 El 2.9 EO 2.8 EO 7.0 El 4.1 EO 3.2 EO 6.7 EO 6.5 El 2.3 El 3.0 El 3.0 EO 1.9 E2 1.5 El 2.0 EO 7.0 El 1.2 EO 1.5 EO 1.6 El 2.7 EO 3.5 EO 1.9 EO
6.8 E3
5.0 E3 2.6 E2
1.2 E2
7.8 E3 2.1 E3 1.3 E4 1.1 E3 1.2 E4 5.7 E3 4.3 E3 1.1 E4 1.3 E4 3.5 E2 1.8 E2 2.7 E3 1.2 E3 7.1 E3 1.2 E3 2.4 E4 6.8 E2 1.8 E3 4.9 E3 2.0 E3
1.7 E3
7.8 E3 7.8 E3 2.6 E3 8.8 E3 6.7 E2 5.0 E2 4.0 E3 1.2 E3 5.2 E3 8.7 E2 1.8 E3 2.4 E2 5.8 E3 2.9 E3
usefulness of the technique is the determination of minor components. Within this limitation, the method is capable of multielemental analysis as is shown in Figure 3 for a standard reference material, steel D837.
E. ISOTOPIC ANALYSIS Since the nuclear properties of isotopes are not related, the isotopic nuclides can be treated as separate entities and analyzed in the same manner as if they were different elements. The simultaneous determination of stable isotopes by PIPPS has the advantage that the data obtained for each isotope are unaffected by errors that may have been incurred in a separate
Volume 11
173
TABLE 3 Some Applications of Prompt Gamma-Ray Spectrometry Beam Energy P
1800 2000
2000 3000 3500
3695 4000
4500 4750 5000 d 2000 2300 4He+ 3500 3500 5000
5000
Matrix Geological standards Bowen's kale Comparison with spectrophotometry Airborne particles Vegetation Foods Chalcogenide glasses Archaeological artefacts Steels Steels Coal Silicon Biological material Niobium metal Single crystals Boron carbide Geological standards Cements, ores Steels
Elements determined
Ref.
Li, Na, Mg, A1
23
N, F, Na, Mg F
24
F S, As, Ge, Te B, F, Na, Mg, Al, Si, Cu Si, Cr, Co c, 0 S 0 C, N B, Li, F, Na Li, F, Na B Li, F, Ti, Mn, Te F V, Mo
25 26 27 28
29 30 22 31 32 33 34 35 19 37 38
analysis of another isotope. Since the same irradiation produces data for every stable isotope, experimental errors may be minimized by determining isotopic ratios. Furthermore, the total elemental concentration may be derived from data without assuming that the element under investigation has the isotopic composition as the naturally occurring element. An example of such an analysis is the simultaneous determination of the stable boron nuclides, I0B and llB through measuring the yield of gamma rays under proton bombard' B is ment.39A typical gamma-ray energy spectrum obtained from a sample enriched in O shown in Figure 4. Gamma rays from 'OB are the 428-keV a(1,O) and the 718-keV (1,0), while that from "B is the 2124-keV (1,O) gamma ray. The experimental conditions for analysis have to be selected with a knowledge of the excitation functions of each gamma ray in this case,39 the bombarding proton energy of 3450 keV was suitable for measuring isotopic concentrations in thin targets in which the proton beam did not lose more than 120 keV. A relative precision for isotopic analysis was 2.6% with a sensitivity limit of 0.50 at%. Elemental concentrations of isotopically enriched material could be obtained with a relative precision of 3.7%.
111. PROMPT PARTICLE SPECTROMETRY When a nuclear reaction takes place in which the main reaction products are a heavy nucleus and a single light product, usually accompanied by prompt gamma rays, the energy of the light product is given by Equation 1. If the energetics of the reaction permit, the heavy product may be formed in different nuclear excitation states, each of which may have associated with it a light product of well-defined energy, the yield of which is proportional to both the reaction probability and to the concentration of the target nuclide. The energy spectrum of the light product will thus contain a pattern of peaks which is characteristic of the nuclear reaction and the conditions under which it occurred. Prompt particle spectrometry has been used by physicists for a long time to measure nuclear properties, but in the hands of the nuclear analytical chemist, it has become a powerful tool for analysis of surfaces and near-surfaces. Unlike gamma-ray spectrometry, prompt particle spectrometry can seldom be
Activation Analysis STEEL 0837 Ep= 4 W
I
I
h
I
2000
2100
2200
2300
I
I
I
2500 2600 2400 CHANNEL NUMBER
I
I
I
I
2700
2800
2900
3000
FIGURE 3. Prompt gamma-ray spectrum from proton-bombarded Standard Reference steel D-837. The peak used for the analysis of silicon is numbered 45, for chromium, 10, 17, 21, and 32, and for cobalt, 8, 20, and 28. (Reprinted from Gihwala, D. and Peisach, M., I.E.E.E. Tram. Nucl. Sci., NS30, 1349, 1983. With permission from I.E.E.E. Publishing Services.
used for multielemental analysis, but it can be very specific for a single element, or, more Prompt particle spectrometry can be used to measure concentration profiles, i.e., the variation of the concentration of the target element as a function of its depth below the surface, when charged particles of a few MeV are involved in the reaction, either as the bombarding particle or the prompt product or both. The thickness of material accessible for analysis will depend on the range of the charged particles within the sample material. The yield as a function of the bombarding energy, referred to as the excitation function, is frequently an irregular relationship, the plot of which often shows sharp peaks or resonances correspondingly to energy levels in the nuclear species involved in the reaction. Accordingly, the energy spectrum of the prompt particles from a selected reaction, even in a thick homogeneous solid, will most likely be a complex curve, reflecting the changes in the crosssection as a result of the changes in energy of the charged particle within the solid. The
Volume 11 1 5 s z- .'d a
-
175
10
0
a
B 52.1 atom % B,O, t h ~ ntarget Ep = 3L50 keV
-.,
-.
e a
-
, a
s
P
;.
Q L
Y
,o
.
.. .. .... .::..*.::. . .- . . ... .r.:.:.... . . . .... . . . .................. . .. . .. ........ .. ....... ... ................................................. . .................................... .............................................. . . . . . . . . . . . . . . . . . . . . . . . . . . . ...-..,. . . . . . ...... ... ........................................................ .................................................
1
lo0 0
I 200
I 400
I 600
I 800
1 1000
I
1200 CHANNEL NUMBER
I
1400
I 1600
I
1800
I
2000
FIGURE 4. Prompt gamma-ray spectrum from a thin target of boric oxide containing 52.1 at% 1°B, bombarded with 3450-keV protons. Shaded peaks are due to boron isotopes. (Reprinted from Cohen, M., Porte, L., Thomas, J.-P., and Tousset, J., J. Radioanal. Chem., 17, 65, 1973. With permission from Elsevier Sequoia S.A.)
deconvolution of the spectrum to obtain the concentration profile will thus require a knowledge of the excitation function of the reaction and the stopping power of the target matrix. If a suitable standard material with the same or closely similar matrix is available, the experimental shape of the concentration profile can be obtained by a procedure described in the next section. In exoergic reactions, the Q-value energy is available to the reaction products in the form of kinetic energy, most of which will be carried off by the light product. Under such conditions, the light product is produced with energies, which are usually much in excess of those of the bombarding particles. However, in addition to the reaction products, there are always bombarding particles scattered into the direction of the detector. Since the crosssection for scatter usually far exceeds that for the reaction, the flux of scattered particles would make it difficult to measure the energy spectrum of the reaction products. These unwanted particles may be effectively removed, either electronically, by including a threshold amplifier for rejecting the low energy pulses or physically, by interposing an absorber of suitable thickness between the target and the detector, as shown diagrammatically in Figure 5. The absorber technique has the advantage of simplicity, but it causes a decrease in the energy of the measured particle and a spread of the particle energy as a result of straggling in the absorber. The absorber technique finds ready application in analyses using exoergic reactions, such as (a,p) reactions, some (p,a) reactions, and especially, (d,p) reactions.
A. CALCULATION OF DEPTH PROFILES The energy of a light reaction product, E,, at the time of its formation from a bombarding particle of energy E, is given in Equation 1. If we consider that this reaction occurs in an incremental sample slice dx at a depth x below the surface, from a bombarding beam with energy E, at the sample surface, incident on the target at an angle 0, to the normal, then the path length of the beam to depth x is xtcos 0, and
where s,(E,) is the stopping power for the incoming beam at an average energy Bin.If more accurate calculation is required, S, may be computed by summation of energy losses over
176
Activation Analysis
BOMBARDING BEAM
SAMPLE
FIGURE 5. The absorber technique for measuring prompt c h g e d particles from exoergic reactions. Scattered bombarding particles are absorbed in the appropriate thickness of absorber, while energetic product particles pass through with a small energy loss.
narrow incremental path lengths along the incoming beam path. Similarly, if the outward particle path makes an angle 0, to the target normal, the outward path length is dcos 0, and the measured energy, E, at the detector is
where s2(E0,,) is the stopping power for the outward particle at an average energy B , . It has been shown40that the yield Y(E,,,E) from a depth x is given by
where dE,/dE, is evaluated for E, at the depth of interest, I is the number of incident particles, N(x) is the atomic density of the target element, dR is the solid angle subtended by the detector, and C = cos 0,/cos 0,. Using the notation
for the component i of the target, and the factors E, which correct for the differences in stopping powers because the incident and the product particles are different, the complex target may be considered as consisting of two types of atoms, for which the Bragg rule of summation of stopping powers may be applied. Most of the atoms can be called A, being those contributing to the stopping power, but not the measured signal, and B, those for which the nuclear reaction yield is required for analytical purposes. Thus
Volume 11
177
and (17)
Hence
from which RBA(x)can be calculated if stopping powers are known.
B. SOME APPLICATIONS OF CHARGED PARTICLE SPECTROMETRY Most analyses using energy spectrometry of charged particles from nuclear reactions were applied to the determination of the light elements. Some examples are discussed below in order of the atomic number of the analyte. 1. Hydrogen The determination of 'H is usually carried out by the use of resonance reactions (q.v.). However, in some studies, such as those requiring channeling, a nonresonant nuclear reaction would be preferred because that would prevent strong changes in the reaction yield as a result of stopping power variations near channelling directions. For such studies the reaction
was
to determine the concentration profile of hydrogen implanted in metals. Deuterium is more often determined through the reaction 'H (jHe,p) 4He
Q
=
18.354 MeV
which produces protons of about 13 MeV (at 135') as well as energetic alpha particles with a beam energy of only 750 keV. With such energetic products, a thin gold-coated mylar film is sufficient to exclude backscattered 3He+ ions.43Concentration profiles of deuterium were determined by this reaction in studies on the behavior of implanted deuterium into metals at and room43temperatures, and the oxidation of Fe/Cr alloys by moist carbon dioxide using H,O as well as Dz0.44 Because 3He gas is relatively expensive, the deuterium-induced reaction 2H
3H
Q
=
4.033 MeV
may sometimes be preferred. This reaction has been successfully applied to determine the concentration profile in deuterium-implanted metals such as Pd, using 2-MeV deuteron beams.45 Prolonged irradiation could, however, obscure the result because of deuterium implantation by the bombarding beam. 2. Helium The reaction
3He (d,p) 4He
Q
=
18.534MeV
was used for determining 3He concentrations and profiles in material^^^.^' implanted with He. Because the product particles are so energetic, electrostatic rejection of the backscattered deuterons may be achieved through the use of a wedge, 3.46"formed by two condensor plates, 174 mm long with an opening at the entrance of 1.5 mm.
178
Activation Analysis 1800 1600 I400 1200 -
40
I
I
l
l
I/
.YGE .. . 0
60
I
I
2 **
ELASTIC
1
1
I
I
( -
-
.
100
80
I
'Be'
(!.dl
120
140
160
180
200
220
(A%)
(%'3 d GROUP
Q GROUP
CHANNEL
FIGURE 6. Energy spectrum of a beryllium target bombarded with 300-keV protons and measured at 30' without an absorber. The break-up of the excited 6Li is clearly in evidence. (Reprinted from Pronko, P. P., Okamato, P. R., and Wiedersich, H.,Nucl. Instrum. Methods, 149, 7 7 , 1978. With permission from Elsevier Science Publishers B.V.)
3. Lithium The deuteron-induced reaction 6Li (d,a) 4He
Q
=
22.374 MeV
produces very energetic alpha particles, suitable for analysis. The deuterons scattered from the target can easily be eliminated by electrostatic deflection, as described for helium above.46 4. Beryllium Since the coulomb barrier for protons is low it is possible to use beams of 300 keV to induce the nuclear reactions 9Be (p,d) 8Be
Q = 0.560 MeV
9Be (p,a) 6Li
Q = 2.125 MeV
and
for the determination of beryllium and its concentration profile.48 Absorber foils of 2.5pm Mylar@were used to remove the backscattered deuterons. In the case of the (p,a) reaction, excited 9Be decays both to the ground and the first excited states, each of which gives off alpha particles. The first excited state of 6Li may break up into a deuteron and an alpha particle, as is observed in the energy spectrum of proton-irradiated beryllium (see Figure 6). Both the deuteron and alpha groups have been used for profiling,48the former having the advantage of deeper penetration to about 1 km. With deuteron beams in a nuclear microprobe, beryllium concentration profiles in metals have been measured49through the use of the reaction 9Be (d,p) 'OBe
Q = 4.587 MeV
Volume 11
179
Because this reaction is relatively less exoergic than the corresponding reactions on other light elements, the extent of interference from reactions, such as B, N. Mg, Al, Si, S, and P was determined. In the absence of interfering elements, the method is suitable for determining beryllium in the concentration range of 0.02 to 2.0% by mass. 5. Boron Proton bombardment has been used to determine boron concentration in Si:H filmss0 by means of the nuclear reaction
llB (p,a) *Be
Q = 8.591 MeV
The energetic alpha particles can readily be observed in the presence of low energy protons. Deuteron beams have been used to analyse boron on silicons1and glass.52The former made use of the reaction 1°B (d,p) "B
Q = 9.231 MeV
with absorbers of 32-pm MylarB films. To distinguish between proton groups from boron and from oxygen, bombarding beams of 1470 keV were used and measurement of 160" was restricted to films not exceeding 30 nm. Analysis of glass52made use of the highly exoergic reaction 1°B (d,a) 'Be
Q = 17.822 MeV
but interference could be expected from the corresponding reactions on 6Li and I4N. In the absence of interferences and with a bombarding beam of 1500 keV, both the a, group having an energy of 11.25 MeV measured at 135", and the a, group, 9.47 MeV, could be used for the analysis. 6. Carbon Low energy deuteron beams, between about 1000 and 1500 keV are suitable for the determination of carbon and carbon concentration profiles through the use of the reaction "C (d,p) 13C
Q = 2.719 MeV
Possible interferences may arise from fluorine and from oxygen-17. Proton spectrometry from this reaction has been used for the analysis of tantalum carbide films,"O thin sheets of plastic material^,^ organic materials, such as the standard reference Bowen's kale and tooth enamels,53 and in the glass industry.52Nuclear microprobe studies made use of the same . ~ ~using a detector reaction for the analysis of tapered corrosion sections43and g r a p h i t e ~By telescope consisting of a thin transmission detector backed by a thick detector, coincidence measurements made it possible to eliminate the effects from possible sources of interference. 7. Nitrogen Two deuteron-induced nuclear reactions are commonly used for the determination of nitrogen. These are I4N (d,p) 15N
Q = 8.609 MeV
and 14N (d,a) I2C
Q
=
13.575 MeV
180
Activation Analysis I
Integrated
I
charge 2 0 0 yC
FIGURE 7. Proton energy spectrum obtained from the bombardment of a sample of TiN,OJSi with 610-keV deuterons. The concentrations of I4N and 1 6 0 were 1.67 X 10'' and 7.7 X 10¹⁶ atoms per square centimeter, respectively. (Reprinted from Berti, M. and Drigo, A. V., Nucl. Instrum. Methods, 149,301, 1978. With permission from Elsevier Science Publishers B.V.)
Through the use of one or other of these reactions, with the absorber technique, nitrogen and its concentration profiles have been determined in such diverse matrices as glass,52 silicon wafers,s6 steels,43.57.58 and organic materials, such as seeds59and human tooth dentine.53 When the (d,p) reaction is selected, careful attention has to be given as to which proton group is chosen for measurement. With deuteron energies between 0.95 and 1.3 MeV, the 14Np5 group has the highest cross-section and is the preferred g r o ~ p .A~typical ~,~~ proton energy spectrum is shown in Figure 7. An attempt to improve precision, but still to retain the advantage of using low energy beams for which the extent of interference from matrix components with higher atomic numbers would be relatively low, the region of integration of counts was extended to include the yield of both protons and alpha particles from both reactions as obtained with 1.9-MeV deuterons. Although this change increased the rate of through-put of samples, the concentration range of applicability did not extend to much below about 1% by mass.60 While retaining the advantages of more rapid sample through-put and improved precision, the sensitivity of the method was extended into the pg g-' concentration range by using a carefully selected forward measuring direction coupled with the appropriate absorber thickness and lowering the bombarding energy to 1.2 MeV, thereby still further reducing the possibility of interference from heavy metal matrix components. From the kinematics of the two reactions it was found6' that with an absorber of 17 mg cm-* of gold and a measuring angle of about 45" the energies of the protons and alpha particles were approximately equal and hence the measurement required but a single background ~ubtraction.~' A typical spectrum obtained under such conditions is shown in Figure 8.
.
Particle Energy (MeV) I
I
I
I
I
1
4
5
6
7
8
9
lLN(p,)
I
10
BARIUM NITRATE
STEEL BO
Channel number
FIGURE 8. Prompt particle spectra obtained from barium nitrate (upper curve) and a steel specimen containing nitrogen. The high energy portion of the spectrum from barium nitrate is entirely due to nitrogen in the material. The deuteron bombarding energy was 1200 keV and the spectra were measured at 45". (Reprinted from Olivier, C., Peisach, M., and Pierce, T. B., J . Radioanal. Chem., 32, 71, 1976. With permission from Elsevier Sequoia S.A.)
8. Oxygen Because proton-induced reactions on 160are endoergic, analysis of oxygen using proton beams is carried out on the heavy isotope through the reaction Q = 3.970 MeV
The cross-section is relatively high and in the region between 600 and 800 keV the yield is only slightly dependent on the energy. With beams of 840 keV in a microprobe, the oxygen profile was measured across a tapered section of that had been exposed to moist carbon dioxide labeled with ''0. Similarly, lattice localization studies of oxygen in niobium
182
Activation Analysis
preferred this reaction, with the absorber technique to eliminate scattered protons, because the amount of damage done to monocrystalline samples was relatively small with the low energy beam.62The use of this reaction for oxygen profiling at glancing angles was studied in detaiP3 because by making use of the higher particle energy at forward angles, greater depths of the material can be analy~ed,"~ especially when the already relatively low range alpha particles have their energy further reduced by the absorber technique. For most oxygen determinations, use is made of the spectrometry of the prompt particles form the deuteron-induced reactions '"0 (d,p)
170
Q = 1.918 MeV
and ( d p ) I4N
160
Q = 3.111 MeV
When the (d,p) reaction is used, concentration profiles may be obtained by measuring this either the '"0po or pl proton groups. With a high-resolution magnetic spe~trometer,~~ may be achieved without the use of an absorber foil, resulting in a significant improvement in depth resolution. The sensitivity of the method is only some 0.5 at%. With simpler technique using absorbers, lower concentrations of oxygen have been determined in such widely differing matrices as silicon wafers,'' Bowen's kale,53and tooth The decision as to which proton group should be used for the analysis is often determined by the presence of other components in the matrix, which could cause interference. Thus, despite the fact that the cross-section for the emission of p, protons is lower than that for because of the p, group," p0 protons are preferred when the sample contains de~terium,~" the high background from 'H for low energy protons, or nitrogen,'" because the p, proton group from the (d,p) reaction on 14N has very nearly the same energy as the 1 6 0 p, group. The p, group was chosen for the analysis of steels,57because of the better yield obtained with low energy deuterons, but when the sample contained large concentrations of carbon54 or boron,55only the p, group could be used because of the interference with the p, group from 1 2 0 pOor B p4 protons. The advantage of using the (d,a) reaction for oxygen analysis, is the fact that concentration profiles may be measured to a depth of about 1.5 Fm, with a depth resolution of 20 to 40 nm. However, with the deuteron beams of below 2 MeV normally used for analysis, the alpha particle energy is so low that the absorber technique can no longer be useful. Various experimental methods have been tried to overcome this problem. A magnetic spectrometeP can be used to eliminate interference from other sample components. Electronic discrimination with a threshold amplifier to reject pulses from elastically scattered deuterons was used to measure oxygen concentration profiles in silicon.65 Low current bombardment with no absorber foils could be used in samples containing low oxygen concentration^,^^ but analysis required irradiations lasting several hours. Most interferences from (d,p) reactions on light elements in the sample can be eliminated by using a thin detector of some 20 to 25 pm in which alpha particles of over 5 MeV can be stopped, but in which energetic protons and deuterons can deposit energies not exceeding some 2 MeV. Such an approach was used6' to analyze layers of niobium germanide, and by increasing the target tilt angle, the depth resolution could be improved.,'
ization of oxygen in niobium,62showed that the proton bombardment was preferred because of better yields and lower crystal irradiation damage.
Volume I1
183
9. Heavier Elements The determination of silicon distributions in metalss8 was carried out with a nuclear microprobe using the reaction 28Si (d,p) 29Si
Q = 6.249 MeV
and measuring the yield of the p, proton group from a bombardment with 1.9-MeV deuterons. The counts recorded in the energy region covered by this proton group were used for the analysis despite the fact that elements such as B, S. P, Mg, and A1 also contributed counts in the same energy region. From pure targets 'It was found59 that the presence of 1% of boron gave a count equivalent to about 2.2% of silicon, but the corresponding values for the other elements were much less, viz. 2000 ppm Si for 1% sulfur, 70 ppm for phosphorus, 230 ppm for magnesium, and 40 ppm for aluminium. Although the (d,p) reaction on 29Si produced more energetic protons, and hence was subject to a smaller extent of interference, the low abundance of this isotope in nature obviated its use for sensitive analytical work. The determination of thin layers of chromium on substrates of medium atomic weight elements can be carried out6' by the deuteron-induced reaction S2Cr(d,p) s3Cr
Q = 5.716 MeV
Energy spectra of the prompt protons from deuteron-bombarded films of chromium, iron and nickel, and copper on tantalum are shown in Figure 9. The spectrum from chromium is dominated by proton groups from the abundant 52Cr isotope, with the p, and p, groups being most prominent. Because the p, group lies at a higher energy region less likely to be populated by protons from other medium weight elements, this group was used for analysis. Some interference from iron and nickel could be expected but the spectrum could be deconvoluted to obtain the chromium concentration with a relative precision of about 2.4% for layers up to 300 pg/cm2 even on an undercoat of thick copper.68 Despite the mutual interference between chromium and nickel, the determination of surface and subsurface nickel can be effected69 through the (d,p) reaction on the nickel isotopes of mass 58 and 60, the two most abundant isotopes in nature, by the nuclear reactions 58Ni (d,p) 59Ni
Q = 6.775 MeV
and 60Ni (d,p) 61Ni
Q = 5.95 MeV
The relative precision69 for the determination of nickel on substrates of copper was 2.2%. The most likely other middle weight elements to cause interference are iron and zinc.69 Because nickel plating often involves a preliminary deposit of copper, possible interference from the proton groups s4Fe (p,,p,), s7Fe (p,), and 67Zn(p,,p,,p,) from iron and zinc in the substrate, would be greatly reduced.
IV. PROMPT NEUTRON SPECTROMETRY BY TIME-OF-FLIGHT Few techniques are available for the measurement of prompt neutron energies with sufficient energy resolution. One of the most convenient methods, applicable over the energy range of < 1 to more than 100 MeV is the time-of-flight technique where the time is measured between pulses denoting the start of the neutron flight at the target and its arrival at a detector
Activation Analysis
PS
k
p3p2
p1
)PO Chromium
6000 - '
4000
53~r
-
m
P2
'Ocr Po
1
Po
2000 0
I
u
Iron
1
0 100 I I
I
150 I
6.5 7
I
I
200 250 CHANNEL NUMBER
300 I
8 9 10 11 11.5 PROTON ENERGY (MeV)
FIGURE 9. Typical proton energy spectra obtained from thin films of chromium, iron, nickel and copper on tantalum, irradiated with 3500 keV deuterons and measured at 600.(Reprinted from Olivier, C. and Peisach, M . , J . Radioanal. Chem., 5, 391, 1970. With permission from Elsevier Sequoia S.A.)
placed a fixed known distance away. Although this technique has been used in nuclear research for a long time, it has not been applied extensively to analysis because of the very high backgrounds that were produced by gamma rays at the detector marking the end of the neutron flight. This disadvantage was overcome by the use of pulse-shape discrimination, when it was observed that scintillators, such as anthracene, stilbene, and organic scintillators
Volume 11
185
including the widely used liquid scintillator NE-213 (Nuclear Enterprises, England), gave pulses with an initial high intensity component and a lower intensity component that decayed exponentially, but that the intensity of the latter was greater for particles than for electrons. It was thus possible to differentiate between pulses from different sources according to the time-dependent shape of the scintillation pulse intensity. When a particle of mass m (a.m.u.) and energy E (MeV) takes time t(ns) to cover a distance s(m), the time-of-flight is given by
where the constant includes conversion units. For neutrons, with energies En < 6.5 MeV, the nonrelative relationship
where 7 = tls is the reciprocal velocity in ns/m, is accurate within about 1%, but a better accuracy, and for En > 6.5 MeV, the relativistic expression should be used viz.
Reciprocal velocities calculated from Equation 3 are given in Table 4 for neutrons with energies from 0.50 to 7.49 MeV in steps of 10 keV and from 7 to 39.9 MeV in steps of 100 keV .
A. ENERGY RESOLUTION The energy resolution of a time-of-flight spectrometer is given by AE,
2E"
= - v'(As)' S
+
1.9132 x
E,(At)*(MeV)
(22)
where AE,, At, and As represent, respectively, the uncertainties in the neutron energy, the flight time, and the flight path. It follows that the resolution can be reduced if long flight paths are used, and that for a fixed flight path, resolution is better for lower energy neutrons. The uncertainty in the flight path arises from uncertainties at the beginning and the end of the neutron flight due to the thickness of the target and detector, respectively. When solid targets are used, the depth of penetration by the charged particle irradiating beam is small so that the uncertainty in the position from which the neutron was generated is negligible. This is not true for gaseous samples, especially at low pressures, where the length of the gas cell can introduce uncertainties of the order of centimeters. Similarly, at the end of the neutron flight, the detectors used are usually scintillators several centimeters thick, thus again introducing an uncertainty of the same order. The uncertainty in theflight time is mainly due to the timing of the start of the neutron flight, but includes timing errors in the measuring system and the effect of the flight path uncertainty. The formation of the neutron can be detected by an associated particle emitted in the reaction, such as a gamma-ray photon, but the sverall neutron detection efficiency is decreased by inefficiencies in detecting the associated particle. This procedure has not yet
186
Activation Analysis
TABLE 4
Time-of-Flight of Neutrons (nslm) MeV 0.5 0.6 0.7 0.8 0.9 1.o 1.1 1.2 1.3 1.4 1.5 1.6 1.7 1.8 1.9 2.0 2.1
2.2 2.3 2.4 2.5 2.6 2.7 2.8 2.9 3.0 3.1 3.2 3.3 3.4 3.5 3.6 3.7 3.8 3.9 4.0 4.1 4.2 4.3 4.4 4.5 4.6 4.7 4.8 4.9 5 .O 5.1 5.2 5.3 5.4 5.5 5.6 5.7 5.8 5.9 6.0
-
Volume II
TABLE 4 (continued) Time-of-Flight of Neutrons ( d m ) MeV 6.1 6.2 6.3 6.4 6.5 6.6 6.7 6.8 6.9 7.0 7.1 7.2 7.3 7.4 7 8
9 10 11 12 13 14 15 16 17 18 19 20 21 22 23 24 25 26 27 28
29 30 31 32 33 34 35 36 37 38 39
found application in analysis. The technique most often used is to irradiate the target with a pulsed beam thereby limiting the formation of the neutron to the duration of the pulse. The advantage is that the neutron detection efficiency is not reduced by the detection efficiency of a secondary detector, but the timing uncertainty is increased as a result of the finite duration of the pulse. In Table 5 the energy resolution that can be obtained with flight paths of 6 m is given for different neutron energies. The flight path uncertainty was assumed to be 3 cm and a timing uncertainty of 0.6 ns was taken into account.
188
Activation Analysis
TABLE 5 Energy Resolution of Time-of-Flight Spectrometer Enerm resolution (keV) Pulse Duration (ns)
E, = 10
E, = 1 MeV
E, = 2 MeV
En = 5 MeV
MeV
Note: Flight path = 6m, flight path uncertainty = 3 cm, and additional timing uncertainty due to electronic measuring system = 0 . 6 ns.
However, the resolution is only important for analytical purposes when it is necessary to discriminate between neutrons from the nuclide (or element) under consideration and those from other sources. Many analytical applications do not require a very high resolution and are possible with spectrometershaving a resolution of about 100 keV for neutron energies between 1 and 2 MeV. In such cases, the advantage of using shorter irradiation pulses and faster electronic systems lies in the fact that much shorter flight paths can then be used. As the count rate varies inversely with the square of the flight path, the use of short flight paths greatly increases the count rate and hence shortens the duration of an analysis.
B. CONCENTRATION PROFILES Since neutrons generated by charged particles lose relatively little energy on their path from the point of generation to the detector, the energy of the neutrons from a selected nuclear reaction will vary as a function of the energy of the charged particle. Accordingly, the energy spectrum of measured neutrons will contain information on the depth concentration profile of the target element. Equation 9 could thus be applied to thick target analysis without correction for energy loss of the product neutrons, but, as is the case for charged particleinduced reactions, knowledge of the excitation function and of the stopping power of the target matrix is required. When, however, a homogeneous standard reference material is available which has a stopping power similar to that of the sample under investigation, a simple experimental approach70.'' may be used to deduce the concentration profile. Provided the neutron spectra from the sample and standard are measured under the same conditions, the energy spectra may be converted into a ratio function R(x) by a channel-for-channel division of the background corrected spectrum from the sample by that from the standard. In general, the concentration profile N(x) as a function of depth x is given by
where Co is the concentration of the required element in the standard, and K is the correction factor to allow for differences in matrix stopping power. Obviously, where sample and standard consist of very similar materials, K may be taken as unity. This experimental approach eliminates the necessity of determining excitation functions. Since the same nuclear reaction may produce neutrons of different energies from reactions
results from a single irradiation.
Volume 11
189
C. APPLICATION OF PULSED BEAMS OF CHARGED PARTICLES Since most (p,n) reactions are endoergic, it is frequently possible to select suitable proton bombarding energies at which neutrons are emitted from the desired component but not from other nuclides in the target material. Because the coulomb barrier increases with atomic number, light elements may often be analyzed on heavy supports, such as tungsten or tantalum, with comparatively low energy beams for which the neutron yield from the heavy metal is negligible. However, this approach should be used with care, since even 2-MeV protons emit neutrons from nuclides, such as 48Ca, 51V,53Cr,55Mn, and 59Coeven though the coulomb barrier is of the order of 5 MeV. Most (d,n) reactions are highly exoergic. It would thus seem that deuteron beams would be of little use for analysis, because virtually every component would generate large numbers of neutron groups, producing a complex energy spectrum. Furthermore, the high energy neutrons would require long flight paths, otherwise the energy resolution would be poor. Nevertheless, the coulomb barrier effect can still be used to analyze light nuclides, especially if the neutron group selected for the analysis has a high cross-section. Although helium ions are potentially useful for analysis by this method, no instance of the application of pulsed helium ions for analysis whether by 3He+ or 4He+ has yet been reported. Applications of the time-of-flight technique are summarized below in the order of the atomic number of the element that was determined.
1. Hydrogen Attempts have been made to determine hydrogen and to measure its concentration ~rofiles'~ by means of the reaction 'H (t,n) 3He using time-of-flight spectrometry. Although it was shown that such measurements were possible, the sensitivity attained was of the order of 1 mg g-' in matrices of heavy elements. High background levels are expected from surface low-Z contaminants associated with (t,n) reactions on nuclei other than hydr~gen.~' The nuclear reaction 2H (d,n) 3He (Q, = 3.269 MeV), has been studied in great detail because of its importance as a source of neutrons. The reaction cross-section73is relatively large, rising with deuteron energy to a maximum value of about 101 mb/sr at 12 MeV and 0". When the measuring angle is changed, it can be calculated from Equation 1 that the neutron energy will vary markedly. The variation of the neutron energy with angle of emission is shown graphically in Figure 10. This large variation can serve a useful purpose in analysis, since it enables the analyst to shift the position of the peak representing neutrons from deuterium in the energy spectrum from one region, where there may be interfering neutrons from some component nuclide in the target material, to another that is free from interference, merely by changing the angle of measurement. The position of other peaks in the spectrum will not be as sensitive to a change in the measuring angle because the target nuclei are heavier. The cross-section does, however, fall rapidly from its value at O0 with a change of angle. The determination of deuterum in gases74by neutron time-of-flight spectrometry can be carried out at comparatively low bombarding energies, using a gas cell with a thin nickel window. Typical spectra obtained from deuterium in hydrogen, oxygen, carbon dioxide, and nitrogen are shown in Figure 11. The method is capable of detecting deuterium levels of 25 ng/cm2 with an integrated current of 1 mC, but analysis using prolonged irradiations will require correction to be made for the beam-implanted deuterium, which itself will act as a neutron-generating source.
-
2. Lithium Although methods using neutron spectrometry have not yet been described for the determination of lithium or its isotopes, a great deal of nuclear data is available for neutron-
Activation Analysis ENERGY (m.e.v.)
CHANNEL NUMBER
FIGURE 10. The variation of the energy of the neutrons from the bombardment of deuterium, as a function of measuring angle. (Reprinted from Peisach, M. and Pretorius, R., Anal. Chem., 39, 650, 1967. With permission from the American Chemical Society .)
producing reactions, especially the reaction 7Li (p,n) 7Be Q = - 1.644 MeV which is often used to generate monoenergetic neutrons of variable energy. From considerations of the reaction c r o s s - ~ e c t i o n and ~ ~ -detection ~~ effi~iency,~' a proton bombarding energy of about 3 MeV is indicated. At this energy, two readily resolvable neutron groups are generated. The ground state n, group is about seven times as intense as the n, group which is produced from reactions leading to the 431-keV level of 8Be. Under these conditions and from a knowledge of typical neutron background spectra,79the sensitivity for lithium determination should be about 20 ng/cm2. Isotopic analyses of lithium may be achieved by deuteron bombardment, when the neutrons from both stable isotopes, produced by the reactions 6Li (d,n) 7Be
Q = 3.383 MeV
and 7Li (d,n) 8Be
Q
=
15.031 MeV
should be of suitable energies and intensities. Using 2-MeV deuterons, only n, and n, neutron groups are produced from both isotopes. The energies of the two pairs of neutron groups would be quite different, the faster neutrons being produced from the heavier isotope. Since isotopic analysis is usually carried out on pure samples, interference from other nuclides would be easily controllable.
3. Beryllium Because of its very low coulomb barrier, beryllium can be readily determined by neutron spectrometry using 4He beams. The (a,n) reaction has Q = 5.702 MeV and a cross-section of 25 mb/sr at about 4 MeV. Under these conditions a sensitivity of 60 ng/cm2 should be attainable. +
Volume 11
191
ENERGY (MeV)
CHANNEL NUMBER FIGURE 1 1 . Neutron time-of-flight spectra of deuterium. (A) Pure and in mixtures with (B) oxygen, (C) carbon dioxide, and (D) nitrogen bombarded with 3-MeV deuterons and measured at 30". (Reprinted from Peisach, M. and Pretorius, R . , Anal. Chem., 39, 650, 1967. With permission from the American Chemical Society.)
4. Boron Although the determination of boron by this technique has not yet been described, the nuclear properties of both stable isotopes are well suited for analysis by neutron time-offlight. Proton beams are not suitable for analysis, because relatively many elements may cause interference. By contrast, deuteron beams produce such energetic neutrons from the reaction
"B (d,n) "C
Q = 13.733 MeV
that only high energy neutrons from 3H or 'Li could interfere. However, analysis should be carried out at the lowest useable deuteron beam energies to reduce the background.
192
Activation Analysis
TABLE 6 Neutron Energies from (d,n) Reactions on Carbon-12, Nitrogen-14, and Oxygen-16
Natural abundance (%) Q-value (MeV) for (d,nJ reaction Neutron energy MeV
"0 "1
"2
n3 n, "5 "6
n7 Note: Ed = 3 MeV and 0
=
30"
Helium beams are also suitable and these have the advantage that interferences from other sample components are unlikely. With helium-3 beams, the reaction "B (3He,n) 13N
Q = 10.182 MeV
yields high energy neutrons, while helium-4 beams can be used for isotopic analysis of boron. The (cx,n) reactions are exoergic for both stable isotopes of boron, and the neutrons generated by them are readily resolvable.
5. Carbon Neutrons produced by deuteron bombardment, from the reaction Q = -0.281 MeV
have been used for determining carbon in g a ~ e s ~and ~ - ~in' steel^.'^^^^^^^ With bombarding energies below 3.5 MeV, only one neutron group is observed, because the energy of the n, neutrons is still below the detection threshold. The elements carbon, nitrogen, and oxygen frequently occur together and it is often necessary to determine one or more of them in samples containing all three. The energies of neutrons obtained at 30°, from (d,n) reactions on 12C,14N,and 1 6 0 with 3-Mev deuterons, are listed in Table 6. 1 6 0 would not interfere with the determination of "C but if 14N is present, the n, and n, neutrons would not be resolvable with the short flight paths normally used for analysis, and correction for their contribution would have to be made by amounts proportional to the intensity of the 14N(n,,)neutron group from 14N. Another source of interference is due to thin deposits of carbon from residual vacuum oil vapours that decompose on the heated point of incidence of the bombarding beam. Despite this background the method has a sensitivity8' of about 60 ng/cm2. I3Cmay be d e t e m ~ i n e d ~by ~ .bombardment ~' with 5-MeV protons, when only n,, neutrons are formed through the reaction. 13C (p,n) 13N
Q = -3.003 MeV
As was the case with deuteron bombardment, correction has to be made for the backgrounda4 from beam-deposited carbon.
Volume 11
193
6. Nitrogen Despite the fact that several neutron groups (see Table 6) are generated by the nuclear reaction I4N (d,n) ''0
Q = 5.067 MeV
14N has already been determined in g a s e ~ ~and " ~in~ steel^^^^"^^^ by deuteron irradiation. The sum of the neutron counts from n, and n, neutrons would be a suitable measure of the I4N content of the sample (see Figure 11). However, is should be noted that if oxygen and carbon are present, the I4N(n, and n,) neutron groups would not be readily resolved from the 12C(nJ group and 14N(n4and n,) groups from 160(n,) neutrons. In such cases, the n, or no neutrons should be used, not only for obtaining a measure of the I4N content but also to obtain a corrected value of the neutron counts from 12C and 160. Despite these apparent difficulties, the precision of analysisa2was about 3% with an attainable sensitivity of 200 ng/cm2. The yield of neutrons from 15N by the reaction 15N (p,n) ''0
Q
=
3.542 MeV
is comparatively low, as may be judged from the spectrum obtaineds4 with a sample of ammonia enriched in 15N in Figure 12. This nuclide has thus not yet been determined by neutron spectrometry. 7. Oxygen Neutrons from the reaction
(d,n) 17F
160
Q = -1.624 MeV
induced by about 3-MeV deuterons have been used to determine oxygen in gases80-s2and on solid material^.'^."." The neutron energy (see Table 6) is low so that interference may be expected from many elements, especially at higher bombarding energies. In gases, I4N if present, will interfere through the 14N(n4)neutron group. Using the yield of n,, neutrons, analysisR2showed a relative precision of about 3% and a sensitivity of 170 ng/cm2. Isotopic analysis of oxygen could be carried out by determining the ''0 under proton bombardment through the (p,n) reaction. With 5-MeV protons and a flight path of about 3 m, the n, (2.495-MeV) and the n, (0.744-Mev) neutron groups are very well resolved. Even though the neutron groups, n, to n, (1.555 to 1.361 MeV), all produce a single compounded peak, it is well suited for analysis (see Figure 12). Under these conditions the precision was good and the sensitivity for I s 0 analysis was 16 ng/cm2. Another reaction that offers promise for the determination of ''0 on thin layers of solid samples is the reaction (oL,~ "Ne )
lS0
Q = - 0.6992 MeV
which has already been used for determining the "0 content in gases by measuring the gross neutron yield from reactions induced by alpha particles from polonium-210.85
8. Calcium Calcium is the only element heavier than oxygen that has as yet been analyzed by neutron spectrometry. The heavy isotopes 43Ca and 48Cahave been used as a stable isotopic tracer and their determination is facilitated by the fact that the nuclear reaction
194
Activation Analysis
0.6
800
NEUTRON ENERGY (MeV) 2 .O I0
I
4.0
I
I
I
97.45 atom% oxygen-I8 as CI8o2
30- 573 atom% carbon-13 as I3Co,
Ep = 5.0 MeV
nI3~(n,,)
20 -
100
0
I
100
200 CHANNEL NUMBER
300
d nitrogenFlGURE 12. Neutron time-of-flightspectra of e ~ c h e oxygen-18, 15, and carbon-13 bombarded with 5-MeV protons and measured at 30" over a flight path of 3.13 m. (Reprinted from Peisach, M., Pretorius, R . , and Strebel, P. J., Anal. Chem., 40, 850, 1968. With permission from the Arnerican Chemical Society.)
43Ca(p,n) 4 3 S ~
Q = - 3.003 MeV
48Ca(p,n) 4 8 S ~
Q = -0.510 MeV
and
can yield neutrons at proton energies below the thresholds of the corresponding reactions on the two most abundant isotopes ""Ca and 42Ca. Typical spectra obtained with protons of 4.5 MeV are shown in Figure 13. At this energy, the highest neutron energy obtainable from 43Cais the n, group of 1.478 MeV, while
Volume 11
300
0.6 I
NEUTRON ENERGY (MeV) 0.8 1.0 1.5 2.0 I
I
I
I
195
3.0 4.0
1500
1000
500
000
ioo 1 1
CHANNEL NUMBER
FIGURE 13. Neutron time-of-flight spectra of targets of natural calcium and enriched calcium-43 and calcium-48 bombarded with 4.5-MeV protons and measured at 0" over a flight path of 2.99 m. (Reprinted from McMurray, W. R . , Peisach, M., Pretorius, R., Van der Merwe, P . , and Van Heerden, I. J . , Anal. Chem., 40,266, 1968. With permission from the American Chemical Society .)
many neutron groups from 48Cahave energies above this value. It is thus possible to integrate the counts obtained from the first five most abundant neutron groups of 48Ca to give a measure of the content of this isotope, free from any contribution from 43Ca.In the energy region of the no and n, neutrons from 43Ca,the yield of neutrons from 48Cais comparatively small, and can be calculated as a small correction to obtain the net neutron count representing the content of 43Ca. If the isotopic composition of the sample is known or assumed to be that of natural calcium, the total calcium content can be deduced from the determination of either 43Caor 48Ca. Conversely, if either isotope is administered to a system in an enriched form, the extent of dilution with the natural element can be calculated from the measured ratio of these two isotopes. This method is particularly suited for biological tracing of calcium, especially in healthy humans, where the use of radioactive material is prohibited by law.
196
Activation Analysis
V. THE USE OF NUCLEAR RESONANCES The excitation functions for nuclear reactions with charged particles especially on the lighter nuclides, show sharp peaks superimposed on continua. These resonances correspond to energy states in the compound nucleus and their widths, T, are related to 7 ,the lifetime of the state by the relation.
The analytical importance of these resonances is due to the fact that at the resonance energy, E,, the reaction cross-section is substantially increased. Analyses carried out at these energies on thin targets would, therefore, improve the precision for determining the target nuclide. As a first approximation, it may be considered that the reaction yield occurs only at the resonance energy. Thus, by using bombarding energies E, somewhat above the resonance, the charged particle beam will lose energy by interaction with electrons along its path in the target and attain the resonance energy at some depth x, below the surface, where
The resonance yield may then be assumed to originate from that depth. By systematically increasing the bombarding energy, the resonance yield, and hence analytical information, may be obtained from increasing depths. In this manner, the concentration profile of the target nuclide may be determined. The intensity of the continuum in the excitation function is a measure of the contribution to the yield from bombarding particles with off-resonance energies. Since this yield can be considered as a background against which the resonance yield has to be measured, it is essential to be able to obtain an accurate excitation function in the energy region of interest. With a Van de Graaff accelerator, an energy scan over a limited energy interval of up to 60 keV may be carried out by using electrostatic deflection plates positioned before the analysing slits. With those plates, small well-controlled deflections cause small well-defined energy changes in the accelerating voltage.g6 By repeating the deflections in short time intervals, an entire excitation curve, over the limited bombarding energy range, may be built up in a manner similar to the recording of a pulse amplitude spectrum. Once the intensity of the continuum under the resonance peak has been established the contribution to the measurement, from bombarding above and below the resonance energy, can be deducted from the measured yield. Within the target matrix, when the beam energy has decreased to E near the resonance energy, the cross-section, u (E), for the formation of the measured product is given8' by
where a, is the cross-section at the resonance energy and the width r is given by the FWHM. Thus, if N(x) is the number of target atoms per unit volume at depth x the yield from an incremental depth dx is given by
and is dependent on an accurate knowledge of the resonance parameters. If it is assumed that N(x) is a slowly changing function of x, then the total yield measured from a bom-
Volume 11
197
where S(E) is the stopping power of the matrix at energy E. Except at the surface, (E - ER)>>T/2 and the second team in the square bracket IT
becomes -. 2 Hence
where Y(E,) is the nett yield from the resonance, corrected for the yield from the continuum region of the excitation function. By comparing the yield from an unknown sample with that from a standard the absolute concentration, N(xR) can be obtained since
A concentration profile given by the variation of yield with bombarding energy still has to be corrected further, to take into account the effect of beam energy straggling in the target matrix. Energy loss distributions, calculated from theory3 show that, in thin targets and in thick targets at depths close to the surface, the depth resolution is determined by the inherent width of the resonance. At larger depths the attainable resolution deteriorates with increasing depth and is determined by the extent of energy straggling, which produces an energy distribution much wider than the resonance width. To overcome this difficulty, target samples may be cut in a wedge so that scanning the beam across the wedge, at constant bombarding energy would yield a concentration profile. Successive etchinga8would have the same effect. Another limitation on the use of resonances is the energy region available for a concentration probe. Since increasing depth penetration requires an increase in the bombarding energy, interference-free analysis will depend on the proximity of the succeeding resonance. When the bombarding energy has been increased to the level of the second resonance, the measured yield will reflect the sum of the yields from the first resonance from reaction at the mean calculated depth and from the second at the surface layer. Further increases in the bombarding energy will then result in a repeat of the concentration probe with the second resonance but to which the yield of the measured product from the first resonance has been added. Deconvolution of a concentration profile from data involving overlapping resonance yields requires an accurate knowledge of the relative reaction cross-sections and a recalculation of the straggling effect at the same depth but at the higher energies of the second resonance. While some gain may be expected from a repeat analysis of the near-surface layers, the energy spread of the first resonance by straggling introduces a poorer depth resolution and a poorer precision for the second scan. For these reasons, it is seldom
198
Activation Analysis
advantageous to proceed with a depth probe after the bombarding energy has been increased to that of the next resonance. The technique which has been used most often involves the measurement of the onresonance yield of gamma rays, primarily because of the ease with which gamma rays can be measured, but also because many useful resonances are from (p,y) reactions where no other light product particle is produced. Particle spectrometry from charged particle-induced reactions require the acceptance angle of the detector to be fairly well defined, to prevent kinematic broadening of the spectral peaks. For this reason, the count rates are often lower than desired. To improve the count rate, detectors may be used collimated to cover the entire cone at the measuring angle, or several detectors mounted in the same acceptance direction, may be used to the same effect.89 Applications of the resonance technique are briefly reviewed below in the order of the atomic number of the element that was determined.
A. HYDROGEN Three reactions with heavy ion beams have been used to profile hydrogen concentrations through resonance-excited gamma-ray measurements. These are 'H ('Lip?) 4He, 'H (15N,ay) 12Cand 'H (lgF,ay) 160. Resonances, with relatively narrow widths, from which high energy gamma rays are emitted, from the inverse reaction of the first of the above, 7Li ( p , ~ ) + 2a, occur at 441.4, 1030, and 2060 keV. These correspond to 7Li-beam energies of 3073, 7170, and 14340 keV. Only the first of these resonances has as yet been used for profiling hydrogen concentrations. The gamma-ray energies emitted are 17.64 and 14.70 MeV from the decay of the excited state of 'Be to the ground state and to the first excited state at 2.94 MeV, respectively. A depth resolution of 170 nm has been r e p ~ r t e dThe . ~ reaction is capable of measuring hydrogen concentrations to a depth of about 8 pm and the absolute sensitivity is of the order of 0.1 at%. The reaction preferred by a majority of users for hydrogen profiling is the one induced by beams of 15N.The resonance occurring at 6385 keV is sufficiently sharp to give acceptable depth resolution and is separated from the next resonance by about 7 MeV, thereby allowing profiling to be measured to a good depth without interference from gamma rays of other resonances. At this energy, only hydrogen can react because for all other elements, the coulomb barrier is not exceeded. The width of this resonance, as given in early referencesg1 and as accepted for many years, was shown9' to be too wide; the cumnt value of TI, = 1.8 keV is in good agreement with the resonance width of 103 eV deduced for the corresponding 429-keV resonance in the inverse reaction,9315N(p,ay) 12C.This narrow resonance makes it possible to achieve a depth resolution of 4 nm near the surface, in metals such as Ag and Ta. The calculated cross-section of 1650 mb for the resonance indicates that an absolute sensitivity of about 180 pg/g can be attained through measuring the yield of the 4.43-MeV gamma ray. With suitable corrections for the stopping power of the matrix, this resonance is useful for profiling hydrogen in such diverse systems as the interaction between ~ ~ trapping -~~ of hydrogen in carbon foils,97 in metal foils, and in water and g l a s s e ~ , the geological materials.98 T = 25.4 The next resonance of this reaction appears at 13350 keV. This has a width , keV and a cross-section of 1050 mb. A comparison between the properties of the two resonancesg8 showed that the absolute sensitivity attainable at the higher energy was 20 pglg, but that the depth resolution at the surface and the probe range were worse, the comparative values for the high and low energy resonances being, respectively, 23.6 and 9.6 nm, and 3.3 and 4.8 pm in silica Though not applied as widely as the reaction with 15Nbeams, bombardment with beams of 19Fto generate gamma rays of 6 130,6912, and 7 117 keV has often been used to measure
Volume 11
199
TABLE 7 Resonances102of the Reaction 12C ( p , ~ 13N ) Below 2000 keV Nuclear excited Proton energy
state
rkeV
Gamma-ray energies per keV
hydrogen concentration profiles. The resonance energy of 16.440 MeV has a width of 86 keV and a probe range of 1.2 MeV to the next resonance. A depth of about 0.3 pm is thus accessible for analysis by this resonance. A lower resonance occuring at 6.420 MeV has a wider probe range of 2.70 MeV and a narrower width of 44 keV, but the resonance crosssection is 44 mb compared with 86 mb at the higher energy.98
B. HELIUM The concentration profile of implanted helium has been determinedw through measuring the gamma-ray yield from bombardment with 'Li by the reaction 4He ('Li,y) "B, using the resonance occurring at a Li-energy of 1680 keV. The presence of a weaker resonance at 1430 keV necessitated an unfolding procedure to separate the data from the two resonances. It appears that a suggestion'00for profiling helium through the use of the reaction 4He (IoB,n) I3N at the resonance energy of 1.08 MeV (center-of-mass) has not yet been acted upon.
C. BORON In the predeposition of boron on silicon, a heavily doped boron-rich layer grows at the interface between the silicon and the boron silicate glass. To determine the composition of this layer and its concentration profile, the resonan~e'~' in the reaction
at 1507 keV and a width of 18 keV was used.5' Protons were measured at 135' with a MylarB foil of 19 km in front of the detector to absorb backscattered alpha particles. The method is, however, only suitable for samples thicker than 100 nm. D. CARBON Low energy accelerators providing proton beams of a few MeV can excite only the two lowest resonances of the reaction I2C ( p , ~ I3N ) occuring at the 456.8 and 1699 key. The properties of those are given in Table 7. The next resonance'02 occurs at a proton energy of 9010 keV. Analytical use was made of the lower energy resonanceIo3to determine the film thickness of a carbon deposit under a deposit of gold covering a silicon substrate. To obtain the excitation function, the gamma-ray spectrum of a thick carbon target was used, but correction had to be made for the contribution of a 23 13-keV gamma ray from the 5 11keV resonance in the reaction I3C (p,y) 'IN induced on the natural I3C content of the target.
E. NITROGEN Examination of the list of resonance^'^^ induced by proton bombardment of I5N shows that in the reaction I5N (p,ay) IZC,the resonance at 429 keV is the narrowest. This resonance presents several advantages for nitrogen profiling. Its very narrow width of 103 eV makes it possible to obtain excellent depth resolution near the surface, where the energy distribution of the bombarding beam is not diffused through straggling. Furthermore, since it is a very strong resonance, and the only resonance at lower energy is a weak one at 335 keV, the
200
Activation Analysis
TABLE 8 Resonances of Nitrogen Isotopes1ozwith Protons Below 2000 keV ISN (p,ay) lZC
I4N (P,Y)"0
Proton energy (kW
a
(lab)
(kev)
Proton energy
r (lab)
(keV)
(keV)
Two close-lying levels separated by about 500 eV.
reaction has a low off-resonance cross-section, which augurs well for improved precision. No other resonances occur until 897.4 keV, so that the resonance yield may be used even for the analysis for thick targets. Consequently, this resonance has been extensively used for determining concentration profiles of implanted I5N in metallic ranging in atomic number from 13 to 79, oxides, lo' soft iron, and alloys.'0S Because this same 429-keV resonance is also extensively used in the inverse reaction 'H (I5N,ay) I2C for measuring the concentration profile of hydrogen, the width of the resonance was rein~estigated~~ by the high resolution technique d e v e l ~ p e dfor ' ~ measuring very sharp resonances, when it became clear that the width of 900 eV, previously accepted9' could not be valid. Other resonances of the reaction 15N (p,ay) I2C have been used for the determination of nitrogen in homogeneous materials, when full use could be made of the high resonance cross-section to obtain improved sensitivity. Biological materials were ana1yzed"O for their protein content by determining nitrogen with a proton beam of 920 keV in order to get the benefit of the resonance at 897.4 keV. Similarly, nitrogen-bearing coatings applied by ionic decomposition from a Mo plasma were analysed for their nitrogen content"' using the resonance at 1210 keV. When used with suitable standards, a relative precision of + 3% was achieved, and the method could be used at concentrations down to 10 kg-g-I. The resonances of 14N and 15N are listed in Table 8 for protons up to 2000 keV. Nitrogen concentration profiling in steels through measuring the much more abundant1l2 isotope I4N made use of the 4He-induced resonance in the reaction 14N (a,y) 18F at a bombarding energy of 1531 keV which has a width of 600 eV. This resonance is useful because there are no significant resonances at lower energy; however, the next resonance is at 1618 keV, thus providing a bombarding energy range for interference-free profiling of only 87 keV.
F. OXYGEN The study of oxygen concentrations in materials is often carried out by isotopically enriched 180implantation or deposition. For this purpose the favored analytical method makes use of resonances induced by proton bombardment and the measurement of the emitted particle spectra (see below). However, gamma-ray measurements were employed at the 638keV resonance of the reaction 180(p,ay) I5N and at the 1168.5-keV resonance"' of the ) reaction 1 8 0 ( p , ~ 19F. To determine 1 6 0 directly, the only resonance that has been used,l14 is the sharp elastic
Volume 11
201
TABLE 9 Low Energy Resonances in Proton-Irradiation Oxygen-18 and Some Applications Using Particle Spectrometryn6 E&eV
r(lab)
Cross-section
2.1
60 mblsr at 165'
47 3.8 0.6 5.2 30 27 3.6
40 mblsr at 90"
Use
Ref.
Oxygen in silicon Oxygen implanted in Gap Oxide on Ta
89 118
Anodised oxide film on A1
115
Oxygen diffusion metal single crystals and in metal oxide scale
119
scattering resonance that occurs with alpha-induced reaction I6O (a,&') 1 6 0 at a bombarding energy of 3048 keV and a scattering angle of about 165". The cross-section for this resonance is about ten times higher than that of Rutherford backscatter at the same energy. The determination of ''0 by particle spectrometry was probably one of the earliest applications of the reasonance technique. In 1963, anodic oxide films on aluminum were measured115to a depth of 0.5 pm by alpha-particle spectrometry from the reaction ''0 (p,a) 15N at the resonance proton energy of 1165 keV. Since then several other low energy resonances have been used, and examples are cited in Table 9. The technique requires the use of absorbers to prevent interferences from the backscattered protons. As a result, the depth resolution suffers, from the straggling of the measured alpha particles in the absorber.
G. FLUORINE The reaction 19F (p,ay) 1 6 0 has resonances with high cross-section which are useful for depth profiling. The gamma rays that are emitted are those of 6130, 6912, and 7117 keV from the excited states of 160and, in order to improve the precision of analysis, are usually measured as an unresolved group with NaI(T1) scintillation detectors. The narrow resonances with widths of a few keV lie below a proton energy of 2000 keV. These are listed in Table 10 together with some references where the particular resonances have had analytical application. Because of its high cross-section, the resonance at 872.1 keV offers the best sensitivity, but the next resonance is encountered only some 62 keV higher, thus limiting the depth to which interference-free profiling can be measured. The greatest depth of profiling can be achieved through the use of the resonance at 340.5 keV; this resonance has the advantage that the yield of gamma rays from off-resonance energies is negligible and there is a 143keV energy range before the next resonance is encountered. The best depth resolution is offered by the very narrow resonance at 1087.7 keV, but because it is so weak, it can be used to advantage only when the matrix has a high fluorine content. At lower fluorine concentrations, the resonance at 483.8 keV gives the most useful depth resolution. In cases, such as matrices rich in aluminum or silicon, where an intense high-energy gamma-ray background may be generated from proton capture reactions on the matrix elements, under bombardment with low energy protons, the use of the inelastic scatter reaction, I9F (p,ply) I9F may be preferred. Naturally, the proton energies at which the resonances occur are identical with those listed in Table 10, but the gamma rays that are measured from this reaction have low energies of 110 and 197 keV. The yield of the intense 110-keV gamma ray can be measured with a favorable peak-to-background ratio, especially if a thin Ge(Li) or intrinsic Ge detector is used for the measurement, and the sensitivity for
202
Activation Analysis
TABLE 10 Resonances of the Reaction I9F (p,cuy) 1 6 0 Below 2000 keV Proton resonance energy (keV) ReP16
Usage Purpose or analyzed matrix
Ref.
Energy calibration Glass, implanted Fe, Contaminated Ta,O Implanted Fe foils
"
C, Cu, Ta, Au, glass Fe, Zircaloy, AVMg alloys, Ta,O
127 129
Cab
121
Mg-alloy Zircaloy
128 130
Value to which data from Reference 121 was normalized. This value was cited by Reference 128
fluorine analysis13' can be reduced to an areal concentration of 7 x 10¹² atoms per square centimeter. Using the proton resonance at 935 keV, a resonance not preferred with the (p,c~y) reaction, fluorine concentration profiles were obtained13' in matrices of aluminum, silicon, zircalloy, and stainless steels, through the measurement of the 110-keV gamma ray. H and H : ions in addition to the normal Most low energy accelerators also accelerate : H + beams. Using thin targets of CaF,, it was shown132that the use of such ion-molecule beams broadened the yield curve of the resonance. At the 872-keV proton resonance and with a beam of 2- to 3 keV dispersion, FWHM of the yield curve was 5.5, 8.5, and 11.3 keV for H,' with n = 1, 2, and 3, respectively.
H. NEON Being chemically inert, neon is a useful element for studying the behavior of elemental implants. Most of the resonances that are excited under proton bombardment from the reaction 'ONe (p,y) "Na occur at bombarding energies below 2000 keV. These are listed in Table 11 together with the gamma rays and their relative intensities associated with each resonance. It will be noted that the first resonance with an intense high energy gamma ray occurs at a bombarding energy of 1169 keV. Thus, provided the matrix does not yield high energy gamma rays, high efficiency NaI(T1) scintillation detectors may be used to measure the yield of the 3544-keV gamma ray from the resonance, free from interference, because gamma rays of similar energy cannot be excited by lower energy protons. Additional advantages for the use of this resonance is its very narrow width, which allows for good resolution at the surface and in near-surface layers, and the fact that the next resonance occurs at 1311 keV, thus allowing an energy interval of 142 keV for probing purposes. It is, therefore, not surprising that concentration profile studies on neon, implanted in silicon and tantalum,134 in niobium single crystals,135and in ironlZ3made use of this resonance.
I. SODIUM The emission of gamma rays from resonances in sodium excited by proton bombardment
Volume 11
203
TABLE 11 Resonances of the Reaction20 Ne (p,y) 21NaBelow 2000 keVlJ3 Proton resonance energy (keV)
Nuclear excited level (keV)
384
2,798.2
418
2,829.4
Note:
1,169
3,544
1,311
3,679.7
1,504
3,863.1
1,830
4,175
1,955
4,294
Gamma-ray energies (keV) Most intense
Others (relative intensity)
Gamma-ray energies given as relative intensities, calculated from branching ratios in Reference 133 relative to most intense taken as 100%.
was intensively studied'36 for the (p,y), (p,ply) and (p,ay) reactions. The large number of resonances encountered in these reaction^'^' all lead to high energy gamma rays that can conveniently be measured with efficient large NaI(T1) scintillation detectors even though the energy resolution of these detectors is poor. However, relatively few of the available resonances have as yet been used for analysis. The sharp (p,y) resonance at 308.9 keV, having a width of less than 20 eV is useful for calibrating the beam energy from low energy accelerators122and its use for analysis has already been suggested.138So toolz6 was the use of the (p,y) resonance at 512.1 keV suggested, because of its narrow width of <46 eV. The ( p p ) resonance at 592 keV with a width of 0.64 keV has been used extensiveto measure sodium concentration profiles by alpha-particle spectrometry in ly 9595,138,'39 glass, despite the fact that the depth resolution is adversely affected by the absorber used to eliminate the backscattered protons. Since glass in contact with aqueous solutions interacts at the surface, changes in the sodium concentration profile made it possible to study the mechanism of this effect. Similar studies94also made use of the resonance at 1010.5 keV, but in this case the prompt gamma rays of 1634 keV were measured. This resonance has a width of about 3keV and a peak cross-section of about 45 mb. The (p,y) resonance at 1416.8 keV was used to measure the sodium concentration profile implanted at 10 keV into a 130-nm layer of SiO, on a silicon substrate. The sensitivity attained was about 1013 atoms per square centimeter, equivalent to a concentration of about 1 pglg. With thicker layers of SiO,, the protons caused a surface charge build-up on the insulating layer, with subsequent flash discharge which made concentration profile analysis impossible.
J. MAGNESIUM Only the first two resonances of the reaction 24Mg(p,y) "A1 have been studied with a view to their use for analysis. Careful measurement of the resonance widthsIz6showed that the previously accepted13' values of < 1000 and <400 eV for the resonances at 223.0 and 419.1 keV, respectively, could be reduced to <32 and <44 eV. It appears that the higher resonance has not yet been used for magnesium analysis, but that at 223 keV was used to determine the depth profile of thin oxide layers on magne~ium.'~'
204
Activation Analysis
In a study of implantation ranges, '42 the magnesium concentration profile was determined by measuring the capture gamma rays emitted during proton irradiation at the 20-eV wide 1548-keV resonance of the reaction 26Mg(p,y) 27Al.
K. ALUMINUM Seven low-lying resonance states in the reaction 27Al(p,y) 28Sibelow 507 keV were measured'26 and found to have upper limits to their widths ranging from 34 to 77 eV. Of those, the resonance at 405 keV was used to measure the concentration profile of thin oxide layers on aluminium.14' It appears that most users favor the 991.9-keV resonance for aluminum depth profiling, in which the prompt gamma ray of 1778 keV from the reaction "Al (p,y) 28Siis measured. This resonance has a peak cross-section of 900 mb" and a width of about 100 eV. It has been used to determine aluminum concentration profiles in implanted silicon, silicon carbide, and silicon dioxide,I4' in epitaxially grown silicon on substrates of sapphire,'43on the surface layers of Fecralloy, an alloy of Fe, Cr, Al, and Y, where the resonance of 1025 keV was also and in studies on the interaction between glass surfaces and aqueous solutionS.138.145 The extensive investigations of 111-V compounds has necessitated the determination of aluminium concentration profiles in the heterostructure GaAlAs/GaAs. For this purpose, the resonance at 1183 keV in the reaction 27Al(p,a) 24Mgwas chosen. Absorbers could not be used to eliminate scattered protons because the alpha particles has a shorter range in the absorbers than did the protons. At this bombarding energy, the alpha particles could be measured with a thin totally depleted surface barrier detector having a thickness of 8.6 pm. Such a detector would stop alpha particles at their maximum energy of 2.14 MeV (measured at a laboratory angle of 155") but would allow protons above 0.7 keV to pass.146
L. OTHER ELEMENTS Resonances of silicon have been used to measure concentration profiles in the near surface region of s01ids.l~~ The resonance width for the 416-keV resonance of the reaction 29Si(p,y) 30Pwas shown to be <500 eV.I4' Gamma rays from resonances in the reaction3'P (p,a) 32S at proton energies of 81 1, 1121, and 1247 keV were used to measure concentration profiles of phosphorus. These levels had resonance widths of 460 eV,147<150 eV,'48and 1500 eV,'47respectively. Particle spectrometry using the reaction 31P(p,a) 28A1at the reasonances of 1018 and 1892 keV was The resonance width of 1018-keV resonance, which had previously been also applied.138.149 reported as 800 eV, has been shown138to be <300 eV. Possible use of the resonance at 1019 keV in the reaction 34S (p,y) 35C1has been suggested142for determining the concentration profile of sulfur. Thicknesses of sulfur-containing films were measured using the resonance at 3.722 meV of the reaction 32S(p,ply) 32Sat which the 2.230 keV 32S(l,0)prompt gamma ray was emitted.29 M. THE USE OF ANALOGUE RESONANCES In the heavier elements, the number of resonances for (p,y) reactions becomes large and their energy spacing decreases. It thus becomes difficult to select suitable resonances for concentration profiling except over very limited depths. In some case, however, there may exist analogue states whose structure is similar to low-lying levels of an isobaric nuclide. Resonances corresponding to such states may be considered stronger than other nearby resonances and may be well suited for concentration profiling. Furthermore, it may be possible that due to differences in spin values, the excited level may decay to levels not populated by neighboring resonances with the result that gamma rays with unique energies may be used for the analysis. Examples of the use of analogue resonances are given below.
Volume 11
205
1. Titanium Two strong resonances exist at proton energies of 1007 and 1013 keV. The former decays mainly by a 7582-keV gamma ray to the 153-keV level of 49Vwhile the latter gives a 7650-keV gamma ray in its decay to the 91-keV level of 49V.Thus the 7582-keV gamma ray can be used as a signature of the resonance.'" This gamma ray requires a detector of good resolution such as a Ge(Li) or intrinsic Ge detector for which the counting efficiency is poor. More efficient counting, and hence faster analysis, is possible if the higher resonance at 1361 keV is used, and the 7936-keV gamma ray is measured with a NaI(T1) ~cintillator.'~' This higher resonance can be used to profile depths in iron or about 300 nm until the next resonance is reached at an energy of 26 keV higher. This profiling range is more than sufficient for the analysis of titanium in iron where Ti has been implanted to improve the surface resistance against friction and wear. If profiling is required at a greater depth, the advantage of using NaI(T1) detectors may have to be sacrificed in order to obtain the resolution necessary to distinguish gamma rays from adjacent resonances. 2. Chromium A strong resonance corresponding to an analogue state exists at the proton energy of 1005 keV. At bombarding energies just above the resonance, there are about ten different gamma rays which are unique to the 1005-keV resonance, and may be used for concentration profiling. 150.152 3. Nickel A strong isolated analogue resonance exists in 58Ni at a proton energy of 1424 keV. The capture state decays to the first excited state of 492 keV, but the high energy gamma ray is not sufficiently intense compared to other gamma rays from steel components, so that it is the 492-keV gamma ray that has to be used. Depth profiling of up to 80 pg/cm2 can be effected. lS0
VI. COINCIDENT MEASUREMENT OF COMPLEMENTARY PARTICLES (CMCP) Although it is usually the light product particle which is measured in prompt analysis, in principle, the heavy product recoil can similarly be used, provided the recoiling product has sufficient energy to leave the target material and to register at the detector. If both particles are measured in coincidence with each other, excellent specificity is obtained,lJ7 because if one of the particles, M, with energy E, is measured in the direciton 0, then the complementary product nucleus M, can only be emitted with energy E, in a definite direction, as determined by the kinematic relationships and is unique for a given reaction with a given energy of the bombarding particle. Unlike most other coincidence measurements, where count rates drop appreciably, CMCP is highly efficient, because for every particle counted in one detector, there is another particle emitted towards the second detector placed at the appropriate complementary angle. In a two-particle reaction, it is the energy of the heavier recoiling product, and consequently its range in the target material, which will determine the usefulness of a reaction for CMCP. Reactions which are highly exoergic would be most useful for analytical purposes. However, because heavy charged particles lose their energy rapidly in matter, the method is most suited for the analysis of thin targets of the light elements. For the same reason, and because recoil products have higher energies in the forward direction, it has become the practice for analytical purposes to use the heavier recoiling particles in the forward direction as the gate to measure the coincident energy spectrum of the lighter product in the backward direction. Some reactions suitable for CMCP are listed in Table 12.'53
+
206
Activation Analysis
TABLE 12 Some Reactions Suitable for CMCP Target nucleus 2H 'He 6Li
7Li
9Be
1°B
IlB
Product nu. cleus
Q-value
MeV
'H 4He 'He 7Li 4He 7Be 4He 'Be 6Li 6Li 1°B 7Li IlB 1°B 'Be
4.033 18.354 4.020 5.026 22.373 0.113 17.348 1 1.2O3 13.328 2.125 4.587 7.151 10.323
IlB
9.231 19.695 3.918 4.063 1.341 1.145 8.031 13.185 10.463 9.123 0.784
12C "C "C 12C 12B 9Be ''C 1%
1°B 14C
Ref.
155, 156 155 155, 156
157
1.092 1.146
158
158
From Coetzee, P. P., et al., Nucl. Instrum. Methods, 131, 299, 1975. With permission.
When one of the products of the reaction is unstable, the calculated kinematic relationships no longer apply to the decay particles. From Equation 19, particles with mass numbers between 1 and 20 and energies between 0.2 and 20 MeV will require between 1.6 and 72 ns to reach a detector placed 10 cm away. If the resolution time for a coincidence unit in the measuring system is 100 ns or more, two complementary particles with such widely differing masses and energies will arrive at the detectors within the resolving time and will be registered as coincident. Unstable products should thus have a lifetime of more than a few microseconds in order to ensure that all but a negligible fraction reach the detector before decay. Examples of nuclear reactions which are unsuitable for CMCP are
because the 5He has a halflife of only 2 x 10-Z1sand
where the 'Be breaks up into two alpha particles with a half-life of 3 X 10-16s. The number of product particles with the required energy registered in a detector placed at a chosen angle to the bombarding beam should be the same whether measured indepen-
Volume 11
207
dently or in coincidence with its complementary particle. To achieve this, the following considerations have to be taken into account.
1. 2.
The irradiation beam and both detectors have to be in the same plane, because the kinematic relationships only apply under such conditions. An isotropic nuclear reaction in center-of-mass coordinates is not isotropic in the laboratory system. Thus the intensity of particles emitted in such a nuclear reaction varies with the angle of emission. To correct for this anistropy, the ratio, R , of the intensity of the heavy particle emitted in a direction relative to that of the light particle emitted in a direction 0 has to be taken into account. R is given by
+
3.
4.
where the subscript c refers to the corresponding angle in the center-of-mass system. The diameter of the detector collimators, hl, the diameter of the beam spot, h', and the distances f and b of the forward and backward detector from the target have to be properly ~ h 0 s e n . From l ~ ~ geometrical considerations, the relative distances are given by
For analytical purposes, precise and reproducible target positioning is essential. If the irradiated target is mispositioned along the beam axis, the effect is equivalent to a directional change, and could cause a relatively large error even if the positional shift is small compared to the detector distance. For example, a I-rnm shift could be equivalent to an angular change of 0.95" and lead to a 67% drop in the coincident count rate when the forward and backward detectors are at typical distances of 10 and 15 cm from the target, respectively.
To improve the precision of analysis, a higher count rate may be obtained by moving both detectors closer to the target. However, since this results in increasing the acceptance angle for each detector, the energy spectrum will show a decreased resolution as a result of kinematic broadening. To overcome this drawback, use may be made of the fact that
Accordingly, summing the energies of the coincident pulses in the two detectors will produce the same energy pulses for all complementary particles arriving at the detectors, regardless of the direction from which the particles arrive and independent of the acceptance angle of the detectors. A. APPLICATIONS OF CMCP The CMCP technique has been successfully used for the determination of several light elements, and the modification using the summed energy has been illustrated for the determination of hydrogen154and lithium
1. Hydrogen Quasi-elastic p-2p scattering induced by high energy beams of protons have been used for determining low concentrations of hydrogen in thin materials. From kinematic considerations, the two protons have to emerge at equal angles to the incident beam and can be
208
Activation Analysis
measured in ~0incidence.I~~ With suitably analyzed and well-positioned detectors, sensitivities of the order of 10 pglg could be attained whether protons of 17-MeV or 160-MeV beams from a synchrocyclotron are used, but the higher energy beam permits the probing of a thicker target. By using the summed energy techniquelS4the energy spectrum can readily be deconvoluted to yield a concentration profile. The method has been applied for determining hydrogen in mylar, and in metals, such as aluminum, titanium, iron, and uranium.lS4
2. Lithium While proton bombardment of lithium induces (p,a) reaction suitable for the determination by CMCP of both 6Li and 7Li, deuteron irradiation, which induces (d,a) reactions, can only be used for the determination of 6Li (see Table 12). This is because the reaction 7Li (d,ci) sHe produces a very unstable sHe that decays before reaching the detector, as has been described above. Table 13 lists the energies and directions of the complementary particles obtained from the bombardment of lithium with protons of 1.9 MeV. This bombarding energy corresponds to a maximum in the excitation function for 6Li which is generally the less abundant isotope in the target. Typical spectra obtained from such an analysis using LiF as target, with the backward detector angle chosen as 110" are shown in Figure 14 without and with coincidence. The two spectra shown with coincidence were recorded with the forward detector placed, respectively, at 48. l o to determine 6Li, and 58.5", to determine 7Li. All three spectra were measured under bombardment with the same integrated beam current. Attention has to be drawn to two important features of the spectra. The count rates for the particles of interest did not change when the coincidence circuit was switched on, and the interfering pulses from other reactions were eliminated by the coincidence requirement. These two features are characteristic of CMCP and illustrate the main advantages of this technique. When the same reactions are used with the summed energy technique with the detectors close to the target, each spectrum peak is considerably broadened (see Figure 15), but the sum peak is very sharp, because the kinematic effects are eliminated and the peak width is determined solely by the resolution of the measuring system.'56 3. Beryllium Possible reactions suitable for determining beryllium by CMCP are listed in Table 12. On the basis of Q-value alone, the reactions offering the best possibilities are (3He,p) and (d,c). However, the heavier the particle, the greater the energy loss in escaping from the matrix material, and hence also the energy spread due to straggling. It is thus advantageous, for the sake of improved energy resolution to use a reaction which produces a lighter recoil nucleus, in this case the (d,a.) reaction. The prompt particle energy spectrum obtainedIs7 from an evaporated beryllium target bombarded with 3-MeV deuterons is shown in the upper portion of Figure 16. The spectrum was measured at 1lo0, the complementary angle of which is 46.9". The CMCP spectrum in the lower portion of the same figure shows a double peak for the recoiling 7Li as well as for the backward direction alpha particles. This is due to the fact that the product 7Li nucleus is produced in both its ground and first excited states. The complementary direction for the excited state, 46.3", fell within the angle subtended by the forward detector. The small peak due to tritons is from the reaction 'Be (d,t) 8Be + 201 detected in coincidence with the disintegration alpha particles, some of which were emitted in the direction of the forward detector. For analysis of beryl ores, the alpha-particle yield is used.lS7 4. Boron Deuteron bombardment of boron has been usedIs9to determine the isotopic composition
TABLE 13 Complementary Angles and EnergieslS6for (p,a) Reactions on 'jLi and 'Li at E, = 1.9 MeV 6Li (p,a) 'He Selected angle,
(7
+
10.0 20.0 30.0 40.0 50.0 60.0 70.0 80.0 90.0 100.0 110.0 120.0 130.0 140.0 150.0 160.0 170.0
Alpha energy, E (+) (MeV)
Complementary angle, 0 (")
Helium-3 energy (MeV)
Selected angle, (")
Alpha energy, E (4) (MeV)
Complementary angle, 0 (7
Alpha energy E (0) (MeV)
3.782 3.697 3.561 3.383 3.175 2.949 2.716 2.488 2.272 2.074 1.899 1.750 1.625 1.526 1.449 1.396 1.364
164.6 149.5 135.0 121.3 108.4 92.3 85.3 75.0 65.4 56.4 48.1 40.3 32.9 25.9 19.1 12.6 6.3
2.139 2.224 2.360 2.538 2.746 2.972 3.205 3.433 3.649 3.847 4.021 4.171 4.296 4.395 4.471 4.525 4.557
10.0 20.0 30.0 40.0 50.0 60.0 70.0 80.0 90.0 100.0 110.0 120.0 130.0 140.0 150.0 160.0 170.0
11.714 11.596 11.406 11.152 10.848 10.505 10.137 9.760 9.385 9.025 8.688 8.385 8.120 7.898 7.722 7.596 7.519
167.5 155.1 152.9 131.0 119.5 108.8 95.1 87.2 77.3 67.7 58.5 49.5 40.9 32.4 24.2 16.1 8.0
7.533 7.651 7.841 8.095 8.399 8.742 9.110 9.487 9.862 10.222 10.559 10.862 11.127 11.349 11.525 11.651 11.728
+
210
Activation Analysis
Coincidence off
Coincidence on
I
100
I 150
I
I
I
200
250
300
A
I
750
I 800
850
9
CHANNEL NUMBER
FlGURE 14. Prompt particle spectra from the bombardment of calcium fluoride with 1.9-MeV protons. The uppermost spectrum was measured without coincidence and shows the peaks from 6Li to be obscured. The coincidence spectra were recorded with the backward detector at 110" and the forward one at 48. lo to determine 6Li (middle spectrum) or at 58.5" to determine 'Li (bottom spectrum). (Reprinted from Pretorius, R., Coetzee, P. P., and Peisach, M., J. Radioanal. Chem., 16, 551, 1973. With permission from Elsevier Sequoia S.A.)
600 -
2
'
LOO
-
200
-
.- .?...
2.709
-
-. . .? a
1
fi--. ..-. ..'. 3~~
i.2
0. . e -a
-
0
@=,
.
;
I
2
800
I
1.899
48.1°
2:0
3.0
L .O ENERGY (MeV)
5.0
6.0
SUM
7.0
FIGURE 15. Coincidence and sum spectra from the proton bombardment of lithium-6. Note the elimination of kinetic broadening on summing. The 3.212-MeV alpha particle in the forward direction is summed with the 2.709MeV 'He particle in the backward direction, and similarly the other two complementary particles are summed to give a total energy sum peak of 5.921 MeV. The two 100-mm2detectors were placed 25 mm from the target. (Reprinted from Pretorius, R. and Peisach, M., Nucl. Instrum. Methods, 149, 69, 1978. With permission from Elsevier Science Publishers B.V.)
through CMCP from the reactions O ' B (d,p) "B and "B (d,a) 9Be. By setting a single detector at 50" in the forward direction to measure the heavy recoil product and separate detectors at 90" to measure the protons from reaction with 1°B and at 105' to measure the alpha particles from "B, the isotopic analysis could be performed during a single irradiation. l0B isotopic concentrations could be determined with a relative standard error of 2.5% for enrichments over the entire range.
212
Activation Analysis ENERGY (MeV) 500,
f
3
4
5I
6 Coincidence off
Coincidence on
u
7
-I 1
CHANNEL NUMBER
HGURE 16. Charged particle spectra from a beryllium target irradiated with 3 MeV-deuterons and measured at 110" without coincidence (upper spectrum) and with coincidence. Reprinted from Coetzee, P. P., Pretorius, R., and Peisach, M., J . S. Aj?. Chem. Inst.. 28(1), 104, 1975. With permission from The South African Chemical Institute.
REFERENCES 1 . Peisach, M., Prompt nuclear analysis, J. Radioanal. Chem., 61, 243, 1981. 2. Ziegler, J. F., Biersack, J. P., and Littmark, U., The Stopping and Range of Ions in Solids, Vol. 1, Pergamon Press, New York, 1985. 3. Vavilow, P. V., Ionization losses of high-energy heavy particles, Soviet Physics J.E.T.P., 5 , 749, 1957; translated from Zh. Eksp. Teor. Fiz., 32, 320, 1957. 4. Deconninck, G., Introduction to Radioanalytical Physics, Elsevier, Amsterdam, 1978. 5. Gold, R. and Stone, C. A., Detection of air-borne benylium dust, AECU-3505, U.S. Atomic Energy Commission, Washington, D.C., 1, 1957. 6. Rubin, S., Passel, T. O., and Bailey, L. E., Chemical analysis of surfaces by nuclear methods, Anal. Chem., 29, 736, 1957. 7. Bird, J. R., Campbell, B. L., and Cawley, R. J., Prompt nuclear analysis bibliography 1976, Australian Atomic Energy Commission Report, AAEClE443, May 1978.
Volume 11
213
8. Shabason, L. and Cohen, B. L., Major element analysis with accelerator beam induced gamma rays, Anal. Chem., 45, 284, 1973. 9. Clark, P. J., Neal, G. F., and Allen, R. O., Quantitative multielement Analysis using high energy particle bombardment, Anal. Chem., 47, 650, 1975. 10. Demortier, G., Prompt Gamma-ray yields from proton bombardment of transition elements (Ti to Zn), J. Radioanal. Chem., 47, 459, 1978. 11. Gihwala, D., Analytical Application of Proton-Induced Prompt Photon Spectrometry, Thesis, University of Cape Town, CT, 1982. 12. Giles, I. S. and Peisach, M., A survey of the analytical significance of prompt gamma-rays induced by 5 MeV alpha-particles, J . Radioanal. Chem., 50, 307, 1979. 13. Giles, I. S., Elemental Analysis by Alpha-Induced Prompt Gamma-Ray Spectrometry, Thesis, University of Cape Town, 1978. 14. Pierce, T. B. and Peck, P. F., The determination of some light elements by charged particle activation analysis and measurement of prompt radiation, Proc. S.A.C. Conf. Nottingham, Shallis, P. W., Ed., Heffer & Sons, Cambridge, 1965, 156. 15. Chen, N. S. and Fremlin, J. H., Determination of carbon and nitrogen by deuteron-induced prompt gamma radiations, Radiochem. Radioanal. Lett., 4, 365, 1970. 16. Peisach, M., Prompt gamma rays from triton-induced reactions on oxygen and their use for analysis, J . Radioanal. Chem., 12, 251, 1972. 17. Borderie, B. and Barrandon, J. N., New analytical developments in prompt gamma-ray spectrometry with low-energy tritons and alpha particles, Nucl. lnstrum. Methods, 156, 483, 1978. 18. Deconninck, G. and Demortier, G., Use of prompt nuclear and atomic reactions in the analysis of metal samples (in French), in Nuclear Techniques in the Basic Metal Industries, International Atomic Energy Agency, Vienna, 1973, 573. 19. Borderie, B., Present possibilities for bulk analysis in prompt gamma-ray spectrometry with charged projectiles, Nucl. Instrum. Methods, 175, 465, 1980. 20. Borderie, B., Barrandon, J. N., Delaunay, B., and Basutcu, M., Use of Coulomb excitation by the heavy ions ('5CI, 55 MeV) for analytical purposes: Possibilities and quantitative analysis, Nucl. Instrum. Methods, 163. 441. 1979. 21. Currie, L. A., Limits for qualitative detection and quantitative determination application to radiochemistry, Anal. Chem., 40, 586. 1968. 22. Gihwala, D. and Peisach, M., The determination of silicon, chromium and cobalt in steels by protoninduced prompt photon spectrometry, I.E.E.E. Trans. Nucl. Sci., NS30, 1349, 1983. 23. Brissaud, I., De Chateau-Thieny, A., Frontier, J. P., and Lagarde, G., Analysis of geological standards with PIXE and PIGE techniques. Application to volcanic rocks, J . Radioanal. Nucl. Chem., 102, 131, 1986. 24. Demortier, G., Dosage des elements legers dans des echantillons biologiques par reactions nucleaires promptes (The determination of light elements in biological targets by prompt nuclear reactions), Radiochem. Radioanal. Lett.. 16, 329, 1974. 25. Deconninck, G., Stroobants, J., Stone, W. E. E., and Charlier, H., Comparison between the methods of quantitative determinations of fluorine, Radiochem. Radioanal. Len., 24, 331, 1976. 26. Malmqvist, K. and Akselsson, R. A., Determination of heavy metals and fluorine in airborne particulate matter in an indoor environment by simultaneous use of PIXE and y-ray detection, Proc. Anal. Div. Chem. Soc., 15, 13, 1978. 27. Demortier, G. and Delsate, Ph., Analysis of magnesium by prompt gamma rays induced by protons, Radiochem. Radioanal. Lett., 21, 219, 1975. 28. Shroy, R. E., Kraner, H. W., Jones, K. W., Jacobson, J. S., and Heller, L. I., Determination of fluorine in food samples by the 19F(p.p'y)19Freaction, Nucl. Instrum. Methods, 149, 313, 1978. 29. Cohen, M., Porte, L., Thomas, J.-P., and Tousset, J., Analyse de couches minces de verres chalcogenures par diffusion elastique de protons et mesure de gammas prompts (The analysis of thin films of chalcogenide glasses by elastic scattering of protons and the measure of prompt gammas), J . Radioanal. Chem., 17, 65, 1973. 30. Peisach, M., Jacobson, L., Boulle, G. J., Gihwala, D., and Underhill, L. G., Multivariate analysis of trace elements determined in archaeological materials and its use for characterisation. J. Radioanal. Chem., 69, 349, 1982. 31. Wriekat, A., Surface analysis of light elements at metal surfaces using (p,y) reactions, Muter. Sci. Eng., 85, 181, 1987. 32. Olivier, C. Morland, H. J., De Wet, B. S., and Peisach, M.. Sulphur determination by proton-induced prompt gamma emission: the effect of the matrix and its importance in coal analysis, J. Radioanal. Nucl. Chem., 106, 107, 1986. 33. Gihwala, D. and Peisach, M., Determination of oxygen by deuteron-induced PIPPS, J . Radioanal. Nucl. Chem.. 106, 9, 1986.
214
Activation Analysis
34. Bodart, F., Deconninck, G., and Mengeot, J., Determination of C/N in biological samples by deuteroninduced nuclear reactions, Proc. Int. Symp. Nuclear activation techniques in the life sciences, IAEA-SM227198, International Atomic Energy Agency, Vienna, 1979, 37. 35. Borderie, B., Barrandon, J.-N., and Pinault, J.-L., New possibilities in prompt gamma-ray spectrometry (in French). Analusis, 5, 280, 1977. 36. Borderie, B., Basutcu, M., Barrandon, J. N., and Pinault, J. L., Accurate determination of lithium, boron, fluorine and sodium in some matrices using low energy alpha-particles induced gamma-rays, J. Radioanal. Chem., 56, 185, 1980. 37. Giles, I. S. and Peisach, M., Determination of fluorine by the spectrometry of prompt gamma-rays, J . Radioanal. Chem., 32, 105, 1976. 38. Gihwala, D., Giles, I. S., and Peisach, M., Alpha-induced Coulomb excitation for the determination of vanadium and molybdenum in steels, J. Radioanal. Chem., 47, 145, 1978. 39. Olivier, C., Ras, H. A., and Peisach, M., Simultaneous determination of boron-10 and boron-11 under proton bombardment, J . Radioanal. Chem., 70, 3 11, 1982. 40. Brice, D. K., Theoretical analysis of the energy spectra of backscattered ions, Thin Solidfilms, 19, 121, 1973. 41. Borders, J. A. and Harris, J. M., The use of I2C (d,p) I3C and '60(d,p) ''0 reactions to profile carbon and oxygen in solids, Nucl. Instrum. Methods, 149, 279, 1978. 42. Ligeon, E., Bugeat, J. P., and Chami, A. C., The use of hydrogen and deuterium implantation to investigate some aspects of defect-impurity interactions in metals, Nucl. Instrum. Methods, 149, 99, 1978. 43. Altstetter, C. J., Berisch, R., Bottinger, J., Pohl, F., and Scherzer, B. M. U., Depth profiling of deuterium implanted in stainless steel at room temperature, Nucl. Instrum. Methods, 149, 59, 1978. 44. Singleton, J. F. and Hartley, N. E. W., Light element profiling using nuclear reaction analysis on tapered corrosion sections, J. Radioanal. Chem.. 48, 317, 1979. 45. Moller, W., Hufschmidt, H., and Pfeiffer, Th., Diffusion studies by means of nuclear reaction depth profiling, Nucl. Instrum. Methods, 149, 73, 1978. 46. Moller, W., Hufschmidt, H., and Kamke, D., Large depth profile measurements of D, 'He and 6Li by deuteron induced reactions, Nucl. Instrum. Methods, 140, 157, 1977. 47. Bottinger, J., Williams, J. S., and Jensen, P. S., On depth resolution by 3He profiling using the 3He (d,a) 'H reaction, Nucl. Instrum. Methods, 151, 241, 1978. 48. Pronko, P. P., Okamoto, P. R., and Wiedersich, H., Low energy p-Be nuclear reactions for depth profiling BelNi alloys, Nucl. Instrum. Methods, 149, 77, 1978. 49. McMillan, J. W., Hirst, P. M., Pummery, F. C. W., Huddleston, J., and Pierce, T. B., Recent developments in nuclear microprobe analysis, particularly the determination of beryllium distributions in metals, Nucl. Instrum. Methods, 149, 83, 1978. 50. Chevallier, J. and Beyer, W., Determination of the boron concentration in a-Si:H films by nuclear reaction methods, Solid State Commun., 40, 771, 1981. 51. Armigliato, A., Bentini, G. G., and Ruffini, G., Analysis of boron predeposited silicon wafers by combined ion beam techniques and X-ray microanalysis, Nucl. Instrum. Methods, 149, 653, 1978. 52. Debras, G. and Deconninck, G., Light elements analysis and application to glass industry, J . Radioanal. Chem., 38, 193, 1977. 53. Baijot-Stroobants, J., Debras, G., and Deconninck, G., Quantitative analysis of the total and the surface distribution of carbon, nitrogen and oxygen in biological matrices, by nuclear reactions at low energies (in French), Radiochem. Radioanal. Lett., 27, 271, 1976. 54. Schulte, R. L., High resolution depth profiling of oxygen and carbon in materials by spectral deconvolution, Nucl. Instrum. Methods, 137, 27 1, 1976. 55. Thomas, J. P., Engerran, J., and Tousset, J., Analysis by observing direct nuclear reactions of oxygen and carbon in the vicinity of the surface of boron samples, J. Radioanal. Chem.. 25, 163, 1975. 56. Berti, M. and Drigo, A. V., Simultaneous nuclear microanalysis of nitrogen and oxygen on silicon, Nucl. Instrum. Methods, 201, 473, 1982. 57. Niler, A. and Birkmire, R., Measurement of oxygen and nitrogen profiles in steel, Nucl. Instrum. Methods, 149, 301, 1978. 58. McMillan, J. W. and Pummery, F. C. W., A nuclear microprobe method for the simultaneous determination of silicon and nitrogen profiles in metals, J . Radioanal. Chem., 38, 51, 1977. 59. Sundqvist, B., Coenczi, L., and Koersner, L., A nuclear method for determination of nitrogen depth distributions in single seeds, Report TLU-28/74, Tandem Accelerator Laboratory, Uppsala, 1974. 60. Olivier, C., ~ c ~ i l l i a nJ., 'W., and Pierce, T. B: The use of the nuclear microprobe for the examination of nitrogen distributions in metal samples, Nucl. Instrum. Methods, 124, 289, 1975. 61. Olivier, C., Peisach, M., and Pierce, T. B., The determination of nitrogen in steels by deuteron bombardment, J. Radioanal. Chem., 32, 71, 1976. 62. Kaim, R. E. and Palmer, D. M., Comparison of the 3Hel'60 and 'H/'80 prompt nuclear reactions for lattice location measurements of oxygen in niobium, J. Radioanal. Chem., 48, 295, 1979.
216
Activation Analysis
90. Ziegler, J. F., Wu, C. P., Williams, P., White, C. W., Terreault, B., Schemer, B. M. U., Schulte, R. L., Schneid, E. J., Magee, C. W., Ligeon, E., L'Ecuyer, J., Lanford, W. A., Kuehne, F. J., Kamykowski, E. A., Hofer, W. O., Guivarch, A., Filleux, C. H., Deline, V. R., Evans Jr., C. A., Cohen, B. L, Clark, G. J., Chu, W. K., Brassard, C., Blewer, R. S., Behrisch, R., Appleton, B. R., and Allred, D. D., Profiling hydrogen in materials using ion beams, Nucl. Instrum. Methods, 149, 19, 1978. 91. Ajzenberg-Selove, F., Energy levels of light nuclei A = 16- 17, Nucl. Phys., A 281, 1, 1977. 92. Lanford, W. A., 15N hydrogen profiling: Scientific applications, Nucl. Instrum. Methods, 149, 1. 1978. 93. Maurel, B. and Amsel, G., A new measurement of the 429 keV 15N(p,ay) 12Cresonance. Applications of the very narrow width found to 15N and 'H depth location, Nucl. Instrum. Methods Phys. Res., 218, 159, 1983. 94. Trocellier, P., Nens, B., and Engelmann, Ch., Measurements of the hydrogen, sodium and aluminium concentration versus depth in the near surface region of glasses by resonant nuclear reactions, Nucl. Instrum. Methods, 197, 15, 1982. 95. Della Mea, G., Dran, J.-C., Petit, J.-C., Bezzon, G., and Rossi-Alvarez, C., Use of ion beam techniques for studying the leaching properties of lead-implanted silicates, Nucl. Instrum. Methods Phys. Res.. 218, 493, 1983. 96. Rauch, R., Applications of ion-beam analysis to solid-state reactions, Nucl. Instrum. Methods Phys. Res., B10111, 746, 1985. 97. Bethge, K., Detection and profiling of light elements in different condensed matter matrices, Nucl. Instrum. Methods Phys. Res., B10/11, 633, 1985. 98. Xiong, F., Rauch, F., Shi, C., Zhou, Z., Livi, R. P., and Tombrello, T. A., Hydrogen depth profiling in solids: A comparison of several resonant nuclear reaction techniques, Nucl. Instrum. Methods Phys. Res., B27, 432, 1987. 99. Schulte, R. L., Depth profiling of helium concentrations in materials using the 4He (7Li,y) llB reaction, Nucl. Instrum. Methods, 149, 65, 1978. 100. Leich, D. A. and Tombrello, T. A., A technique for measuring hydrogen concentration versus depth in solid samples, Nucl. Instrum. Methods, 108, 67, 1973. 101. Ajzenberg-Selove, F. and Lauritsen, T., Energy levels of light nuclei, Nucl. Phys., A268, 1, 1976. 102. Ajzenberg-Selove, F., Energy levels of light nuclei A = 13 - 15, Nucl. Phys., A449, 1, 1986. 103. Rudolph, W., Bauer, C., Gippner, P., and Hohmuth, K., Detection of carbon contamination by means of the I2C ( p , ~ 13N ) resonance reaction, Nucl. Instrum. Methods. 191, 373, 1981. 104. Ajzenberg-Selove, F., Energy levels of light nuclei A = 16 - 17, Nucl. Phys., A469, 1, 1986. 105. Keinonen, J., Bister, M., and Anttila, A., Lifetimes of bound states in I5O Nucl. Phys., A286, 505, 1977. 106. Loumajarvi, M., Keinonen, J., Bister, M., and Anttila, A., Ranges of 15N+ions in ten metals measured by (p,ay) reasonance broadening, Phys. Rev., B18, 4657, 1978. 107. Hautala, M., Paltemaa, R., Anttila, A., and Loumajarvi, M., Ion range distributions in oxides, Nucl. Instrum. Methods, 2091210, 37, 1983. 108. Marest, G., Skoutarides, C., Barnavon, Th., Tousset, J., Fayeulle, S. and Robelet, M., Conversion electron Mossbauer spectroscopy and (p,ay) nuclear reaction studies of 15Nimplanted steels, Nucl. Instrum. Methods, 2091210, 259, 1983. 109. Amsel, G. and Maurel, B., High resolution techniques for nuclear reaction resonance width measurements and for shallow depth profiling, Nucl. Instrum. Methods Phys. Res., 218, 183, 1983. 110. Rupnik, P., Kump, P., Budnar, M., and Kreft, I., Protein quality of leguminous plants determined by proton-induced radiation analysis, Nucl. Instrum. Methods, 142, 209, 1977. 111. Antufev, Yu. P., Aksenov, I. I., Bren, V. B., Miskchenko, V. M., and Popov, A. I., Determination of Nitrogen content in fine film coatings using the I5N (p,ay) lZCreaction. AN Ukrainskoj SSR, Kharkov. Fiziko-TekhnicheskijInst. General and Nuclear Physics Report KIT-79-40, No. 2(8), 1979. 112. Gossett, C. R., Very high resolution profiling of nitrogen by the 14N (a,y) 18Freaction, Nucl. Instrum. Methods Phys. Res., B10111, 722, 1985. 113. Maurel, B., Amsel, G., and Nadai, J. P., Depth profiling with narrow resonances of nuclear reactions: Theory and experimental use, Nucl. Instrum. Methods, 197, 1, 1982. 114. Possnert, G., Fahlander, C., Orre, B., Norde, H., Petersson, S., and Tove, P. A., Oxygen content and depth profiling in silicon surface technology studied by the 160(aa) I60 resonance at 3.045 MeV, Phys. Scr., 18, 353, 1978. 115. Amsel, G. and Samuel, D., Mechanism of anodic oxidation, Phys. Chem. Solids, 23, 1707, 1963. 116. Ajzenberg-Selove, F., Energy levels of light nuclei A = 18 - 20, Nucl. Phys., A392, 1, 1983. 117. Pretorius, R., Prompt Activation analysis of light elements by coincident measurement of complementary particles, Radiochem. Radioanal. Lett., 10, 303, 1972. 118. Whitton, J. L., Mitchell, I. V., and Winterbon, K. B., Depth distribution of implanted oxygen in gallium phosphide measured by nuclear reaction techniques, Can. J . Phys., 49, 1225, 1971.
Volume 11
217
119. Calvert, J. M., Lees, D. G., Derry, D. J., and Barnes, D., The use of charged particle bombardment for studying oxygen self-diffusion in oxides, J. Radioanal. Chem., 12, 271, 1972. 120. Ajzenberg-Selove, F. and Lauritsen, T., Energy levels of light nuclei VI, Nucl. Phys., 11, 1, 1959. 121. Dieumegard, D., Maurel, H., and Amsel, G., Microanalysis of fluorine by nuclear reactions I. I9F (p,a,) 1 6 0 and IYF(p,ay) 160reactions, Nucl. Instrum. Methods, 168, 93, 1980. 122. Croset, M., Dieumegard, D., and Grouille, A., Energy resolution, stability and calibration of a 400 kV implantation-type accelerator studied using (p,y) nuclear reactions, in Low Energy Ion Beams, 1977, Amsel, G . , Stephens, K. G . , Wilson, I. H., and Movuzzi, J. L., Eds., Institute of Physics, London, 1978, 109. 123. Deconninck, D. and Van Oystaeyen, B., High resolution depth profiling of F, Ne and Na in materials, Nucl. Insrrum. Methods Phys. Res., 218, 165, 1983. 124. Maurel, B., Dieumegard, D., and Amsel, G., Nuclear study of the fluorine contamination of tantalum by various polishing procedures and of its behaviour during subsequent anodic oxidation, J. Electrochem. Soc., 119, 1715, 1972. 125. Bodart, F. and Deconninck, G., Concentration depth profiling in fluorine implanted iron, Nucl. Instrum. Methods, 197, 59, 1982. 126. Uhrmacher, M., Pampus, K., Bergmeister, F. J., Purschke, D., and Lieb, K. P., Energy calibration of the 500 kV heavy ion implanter IONAS, Nucl. Instrum. Methods, B9, 234, 1985. 127. Anttila, A. and Keinonen, J., Detection of fluorine through the IYF(p,ay) 1 6 0 reaction, Int. J . Appl. Radiut. Isotopes, 24, 293, 1973. 128. Jarjis, R. A., On the determination of fluorine concentration profiles in magnesium alloy scales using the I9F (p,ay) ''0reaction, Nucl. Instrum. Method, 154, 383, 1978. 129. Golicheff, I. and Engelmann, Ch., Contribution a l'etude de la determination du flour a la surface des metaux par detection des photons gamma prompts de la reaction "F (p,ay) IhO, J. Radioanal. Chem., 16, 503, 1973. 130. Moller, E. and Starfelt, N., Microanalysis of flourine in Zircaloy by the use of the I9F (p,ay) 1 6 0 reaction, Nucl. Instrum. Methods, 50, 225, 1967. 131. Gippner, P., Bauer, C., Hohmuth, K., Mann, R., and Rudolph, W., Detection of fluorine contamination by means of the "F (p,p1y) lYFreaction, Nucl. Instrum. Methods, 191, 341, 1981. 132. O'Connell, B. and Crumpton, D., The use of molecular hydrogen ion beams in prompt nuclear reaction analysis, Nucl. Instrum. Methods, 160, 125, 1979. 133. Endt, P. M. and Van der Leun, C., Energy levels of A = 21 -44 nuclei (VI), Nucl. Phys., A310, 1, 1978. 134. Switkowski, Z. E., Overley, J. C., Wu, S. C., Barnes, C. A., Kellogg, W. K., and Roth, J., Depth profiling of implanted neon with resonant nuclear reactions, J. Nucl. Mater., 78, 64, 1978. 135. Naramoto, H. and Ozawa, K., Application of nuclear resonant reactions to the analysis of implanted Ne atoms in niobium crystal, Nucl. Instrum. Methods, 191, 367, 1981. 136. Meyer, M. A., Reinecke, J. P. L., and Reitmann, D., A study of the 23Na(p,y) 24Mgreaction and the excited states of 24Mg,Nucl. Phys., A185, 625, 1972. 137. Endt, P. M. and Van der Leun, C., Energy levels of A=21-44 nuclei (V), Nucl. Phys., A214, 1, 1973. 138. Della, Mea, G., Improvement in depth resolution of medium-mass element analysis: Application to biocompatible glass, Nucl. Instrum. Methods Phys. Res., B 15, 495, 1986. 139. Carnera, A., Della Mea, G., Drigo, A. V., La Russo, S. and Mazzoldi, P., Sodium surface concentration analysis on glass by 23Na(p,a) '"Na nuclear reaction, J . Non-Cryst. Solids, 23, 123, 1977. 140. Dunning, K. L., Hubler, G. K., Comas, J., Lucke, W. H., and Hughes, H. L., Depth profiles of aluminium and sodium near surfaces: nuclear resonance method, Thin Solid Films, 19, 145, 1973. 141. Pampus, K., Bergmeister, F. J., Uhrmacher, M., and Lieb, K. P., High resolution depth profiling of oxide layers on magnesium and aluminium by the nuclear resonance broadening method, Mater. Sci. Eng., 69, 527. 1985. 142. Anttila, A., Bister, M., Fontell, A., and Winterbon, K. B., Ranges of some light ions measured by (p,y) resonance broadening. Radiat. Eff., 33, 13, 1977. 143. Dunning, K. L., 27Al(p,ao) 24Mgresonance profiling of aluminium in silicon-on-sapphire materials, Nucl. Instrum. Methods, 149, 317, 1978. 144. Earwaker, L. G., Nuclear reaction analysis of oxide layers, Nucl. Instrum. Methods, 197, 41, 1982. 145. Trocellier, P., Concentration depth profile measurements near the surface region of solids by resonant nuclear techniques, J . Microsc. Spectrosc. Electron, 9, 111, 1984. 146. We, S.-C., Cheng, A., Huang, S.-L., and Liu, Y-C., The A1 content measurements of Ga,.,AI, as semiconductor using the 27AI(p,a) reaction, Proc. 3rd Semin. Sci. Technol. Small Accelerators and their Applications, Interchange Assoc., Nov 1985, (Tokyo) 227. 147. Kido, Y., Kakeho, M., Yamada, K., Hioki, T., and Kawamoto, J., Study of phosphorus implantation in silicon by channeling and nuclear resonance techniques, J . Appl. Phys., 53, 4812, 1982. 148. Mannsperger, H., Kelbitzer, S., Demond, F. J., and Damjantschitsch, H., Projection factors of lowenergy ion ranges, Nucl. Instrum. Methods, 2091210, 49, 1983.
218
Activation Analysis
149. Ligeon, E., Bruel, M., Bontemps, A., Chambert, G., and Momier, J., Analyse du phosphore dans le silicium par reactions nucleaires, J . Radioanal. Chem., 16, 537, 1973. 150. Gossett, C. R., A method for determining depth profiles of transition elements in steels, Nucl. Instrum. Methods, 168, 217, 1980. 151. Lenz, Th., Baumann, H., and Rauch, F., Profiling of titanium implanted into iron and nickel with the reaction 48Ti( p , ~ 49V, ) NucI. Instrum. Methods Phys. Res., B28, 280, 1987. 152. Barnes, C., Bentley, A. J., Earwaker, L. G., Farr, J. P. C., and Groves, J. M. C., Nuclear reaction profiling of Chromium conversion coatings, Trans. Inst. Met. Finish., 63, 120, 1985. 154. Cohen, B. L., Fink, C. L., and Degnan, J. H., Nondestructive analysis for trace amounts of hydrogen, J . Appl. Phys., 43, 19, 1972. 155. Pretorius, R., Coetzee, P. P., and Peisach, M., The elemental and isotopic determination of lithium by the coincidence measurement of complementary particles, J . Radioanal. Chem., 16, 551, 1973. 156. Pretorius, R. and Peisach, M., Charged particle analysis of light elements by total energy coincident measurement of complementary particles, Nucl. Instrum. Methods, 149, 69, 1978. 157. Coetzee, P. P., Pretorius, R., and Peisach, M., The coincident measurement of complementary particles from deuteron-induced reactions on beryllium and its possible application to analysis, J. S. Afr. Chem. Inst., 28, 104, 1975. 158. Coetzee, P. P., Pretorius, R., and Peisach, M., The isotopic analysis of Boron by the coincident measurement of complementary particles, J. Radioanal. Chem., 25, 283, 1975. 159. Coetzee, P. P., Pretorius, R., and Peisach, M., Experimental criteria for light nuclide analysis by coincident measurement of complimentary particles, Nucl. Instrum. Methods, 131, 300, 1975.
Volume 11
219
Chapter 4
PHOTON ACTIVATION ANALYSIS
..
A P Kushelevsky
TABLE OF CONTENTS I.
Introduction ..................................................................... 220
I1.
Photonuclear Reactions .........................................................220 A. Photonuclear Cross-Sections............................................. 221
I11.
Irradiation Facilities ............................................................. 222 A. Photon Sources .......................................................... 222 B. Bremsstrahlung Spectra..................................................222 C. Sample Holders ......................................................... 223 D. Radioisotopic Sources ................................................... 224
IV .
Particle Emission PAA .......................................................... 255 Particle Emission PAA of Light Elements - Carbon. Oxygen. A. Nitrogen. and Fluorine .................................................. 226 B. Medium and Heavy Element PAA ......................................226
v.
Instrumental Multielement PAA ................................................227 A. Calibration .............................................................. 228 Accuracy and Comparison with Other Nuclear Activation B. Techniques ..............................................................229
VI .
Special Techniques ............................................................. 229 A. Kapid PAA .............................................................. 229 1. Delayed Neutron PAA ...........................................230 2 .. High Energy Beta Ray PAA .....................................230 B. Nuclear Photoexcitation Analysis ........................................231 1. Determinable Elements ..........................................231 2. Applications .....................................................231 C. Prompt PAA ............................................................ 232 1. Applications ..................................................... 232 D. Secondary Neutron PAA ................................................232
VII .
Applications ....................................................................233
VIII . Conclusion ...................................................................... 234 References .............................................................................. 234
220
Activation Analysis
I. INTRODUCTION Photon activation analysis (PAA) is a well-established nuclear activation technique1-' which is used to measure a large number of elements. It was first introduced by Gorshov and co-workers9 in the late 1930s to determine beryllium by prompt neutron emission using a radium source to activate the sample. Following the development of atomic reactors with large neutron fluxes nuclear activation analysis became dominated nearly exclusively by neutron activation analysis (NAA). In the early 1950s, however, as the difficulties of analyzing oxygen by NAA became apparent, the possibility of using electron accelerators to determine oxygen in various materials was investigated with positive results. This work was expanded in the 1960s by many workers to include more than 40 elements using photons varying in energy from 1.33 to 70 MeV.6 Despite its venerable history and the considerable progress made in its successful application for various analytical purposes over the last three decades, PAA still plays only a minor role in elemental analysis compared for example to NAA, because of its relatively low analytic sensitivity due to the small cross-sections of the photonuclear reactions involved. There are certain situations, however, where there is a clear advantage in using PAA rather than NAA.2 These include: 1.
2. 3.
4.
When the samples to be analyzed contain elements such as oxygen, carbon nitrogen, fluorine, and lead which cannot be measured easily by NAA because of unsuitable nuclear parameters of the neutron reaction products. When the samples contain substantial amounts of elements with large thermal capture cross-sections (e.g., boron and cadmium) which severely attenuate the neutron flux within the sample itself (self absorption). When the samples contain a number of different elements which are activated by the neutron flux to produce radionuclides with identical or overlapping gamma spectra making it very difficult, or indeed impossible, to analyze the sample without separating it chemically. A typical example of this situation occurs when analyzing coal samples for aluminum and magnesium, both of which form "Mg when exposed to reactor neutrons. When the sample contains large amounts of elements with large (n,y) cross-sections which become very radioactive following thermal neutron activation, as, for example, occurs when biological samples, containing large amounts of sodium, are activated by large neutron fluxes for trace element measurements.
In these situations, the highly radioactive samples simply overload the detecting system so that there is little chance of seeing gamma peaks associated with the trace elements in the sample. PAA, based on completely different set of nuclear reactions, offers an alternative method of analysis which avoids these problems in many instances. It is these aspects which we discuss in this chapter on PAA where the general principles of PAA are reviewed and some of the special techniques of PAA which have been developed during the last few decades and some of its main applications are described.
11. PHOTONUCLEAR REACTIONS A photon absorbed by a target nucleus A may transform it into nuclide B by one of the three following reactions: 1.
Photo excitation (y,yl) of A into one of its isomeric states A*
Volume 11
221
Gamma Ray Energy
FIGURE 1.
2. 3.
Typical shape of (y,n) cross-section.
Photonuclear reactions e.g., (y,n), (y,p), (y,np), etc. which transform A by particle ejection into a different nuclide B. Photo fission reactions (y,f) in which fissionable elements, for example uranium and thorium, are split by the incident photon.
These transformations, which can be described concisely by A(y,yrn,p,)B, and their respective cross-sections, determine the feasibility of using PAA for the analysis of a given sample and the sensitivity which may be expected.
A. PHOTONUCLEAR CROSS-SECTIONS The photonuclear cross-sections u(E), which vary as a function of photon energy E and the target nucleus, exhibit a number of common features.1° First, every photonuclear reaction has a threshold energy below which the reaction will not proceed. For photonuclear reactions, for example, in which particles are ejected or fission occurs, the photon energies must exceed the binding energies of the particles inside the nucleus which can be either calculated kinematically using nuclide mass data or found in the literature in tabular form.''-'4 Second, above the threshold energy the cross-sections gradually increase as the photon energy increases reaching maximum values in an energy interval called the giant resonance region as is shown in Figure 1 where the cross section of a typical (y,n) reaction is plotted against photon energy. Third, photonuclear cross-sections are generally small compared to thermal neutron cross-sections. Thus, even in the giant resonance region, the (y,n) cross-sections are only of the order of 10 to 100 mb for the light and medium elements and a few hundred millibams for the heavy elements; never reaching 1 b, let alone the tens or hundreds of barns of some (n,y) reactions. These general features explain why high energy-high intensity photon beams are a prerequisite for PAA. If photonuclear reactions are to occur at all, the photon energies should at least exceed the threshold values. If they are to proceed with high probability, a large proportion of the photons should have energies in the resonance region calling for beams between 15 to 25 MeV with high beam intensities to compensate for the low cross-section values. They also suggest the possibility of maximizing specific photonuclear reactions while minimizing others. For example, if two photonuclear reactions have different threshold energies E, and E,, then irradiating at an energy intermediate between the two threshold energies will initiate the reaction with the lower energy while not allowing the reaction with the higher energy to proceed. As with other nuclear activation techniques, the well-known activation equation
222
Activation Analysis
provides the basis for the calculation of induced activities, where C(E) is the saturated activity, N the number of atoms exposed to photon flux, and +(E) the photon flux per unit energy interval. Given detailed cross-sectional data found in a number of compilation~,"-'*"~ information on the elements in the sample, a list of possible photonuclear reactions, and detailed information on the energy distribution of the photon flux, the limits of detection for various elements can be ~ a l c u l a t e d ~ and ~ ~ 'optimum ~-'~ analytical procedures may be established.
111. IRRADIATION FACILITIES The facilities that are required for PAA include a high energy photon source, a sample holder, a conveyer system to move the sample from the irradiation position to the counting position, and radiation detectors and multichannel counters to count the activated sample. As the latter is common to all activation techniques, they are not discussed in this chapter.
A. PHOTON SOURCES The importance of using high energy and high intensity photons beams in PAA, discusssed in the previous section, limits our choice of photon sources for PAA to high energy electron accelerators with converter targets, preferably of high atomic number material, producing bremsstrahlung X-rays as the accelerated electrons hit the target and are sharply decelerated, producing the required large photon fluxes using high electron currents.'-lo Of the various types of electron accelerators available, the linear accelerator (linac) which can be operated for many hours at a time in a high current mode, over a wide range of energies, ranging from a few to 60 MeV and higher, is clearly the favorite as may be deduced from the fact that the great majority of publications on PAA in the scientific literature report work done with linacs. Operational characteristis of linacs suitable for PAA are given in tabular form by Hoste et al.3 (see Table 9). Typically the maximum energy of the electron beam ranges from 15 to 45 MeV with average currents between a few tens of pA to a few hundreds of PA. The microtron is another excellent source of bremsstrahlung radiation for PAA. It is essentially an electron cyclotron in which electrons describe a circular path under the influence of a magnetic field with the electrons receiving their energy from a UHF source (a magnetron for example) as they cross an accelerating cavity. It is able to provide large currents of wellfocused electron beams with very small beam cross-sections and small energy spreads and is used extensively for PAA mainly in the Eastern block c~untries.",'~ betatron^'^-^^ and Van der Graaffs2' have also been used in PAA though not very extensively. The problem with betatrons is not their low energy. On the contrary, they are operated routinely in radiotherapy with energies of up to 45 MeV, but that their photon fluxes are relatively low due to the large distance of the target from the sample and the internal losses of electrons during bremsstrahlung production. Van der Graaffs on the other hand can produce very high bremsstrahlung fluxes. Their problem, as far as PAA is concerned, is that their energies are usually too low (2 to 8 MeV) to be used effectively except in certain special cases. B. BREMSSTRAHLUNG SPECTRA stopped by a thick target of tungsten is shown in Figure 2. Three important features should the maximum energy of the electron
be noted. First, X-ray spectra are continuous up to E,
Volume 11
Energy
223
(M~v)
FIGURE 2. Shape of Bremsstrahlung spectra produced by 20- and 40-MeV electrons hitting a thick tungsten target.
beam. Second, most of the X-rays are produced with low energies and only a relatively small percentage of them are produced with energies near the high energy cut off. Third, the number of X-ray photons produced per electron and the percentage of photons having high energies increase as the electron energy is increased. Other factors which influence the X-ray spectrum and conversion efficiencies are the target thickness and the material it is made from. All these factors must be stated when specifying the activation conditions in addition to stating the value of the average electron beam current.
C. SAMPLE HOLDERS In order to maximize the photon flux available for activation, it is necessary to place the sample as close as possible to the target. This, however, may create problems of overheating of the sample as a result of absorption of high energy electrons from the
224
Activation Analysis
TABLE 1 Half-Lives and Gamma Lines of Radioisotopes Used for Photoexcitation Analysis Radioisotope 24Na V o
Half-life 15.0 h 5.27 year
IZ4Sb
60.2 d
1 1 6 1 ~ ~
54.1 rnin
Gamma lines above 1 Mev
Intensity
1.368 2.754 1.173 1.333 1.045 1.325 1.368 1.437 1.691 2.091 1.097 1.294 1.507 1.752 2.112
100 100 98.89 99.993 1.9 1.4 2.4 1.o 49.0 5.6 55.7 85.0 10.2 2.44 15.0
(%)
accelerated beam which pass through the target and problems of nonuniform activation due to the considerable longitudinal and transverse gradients of the photon flux near the target.' The first problem is solved using a thick target to completely absorb the electron beam and cooling the sample by blowing cool air over it where necessary. The second problem is overcome by using small, thin samples to minimize the effect of the gradients and where possible, rotating the sample in the beam so that all parts of it are exposed to the X-ray beam under the identical conditions. A very effective rotational sample holder is described by Engelmann.' It is part of a pneumatic sample transfer system which transfers the sample, in less than a second, from the target to a radiation detection station situated some distance from the target. Rotational motion is achieved by directing a jet of compressed air against turbine blades which are attached to the sample container. The effectiveness of his design lies in the economy achieved using the compressed air to propel the sample within the pneumatic tube, cool it and also rotate it in the beam. It consists of a thin Another sample holder is described by Landsberger and David~on.~' aluminum disk with 8 to 12 slots symmetrically placed near its circumference into which vials containing the samples are inserted and mounted on a vertical axis directly downsteam from the X-ray target in a carousel like fashion and rotated at 12 rpm while cooled by a stream of cold air. Similar sample holders have been described by other workers5I and are particularly useful when a large number of samples are compared to each other.
D. RADIOISOTOPIC SOURCES Although radioisotopic sources are not suitable for most PAA work, they can be used for certain specialized applications as will be described in the sections on prompt PAA and photoexcitation PAA. The most useful sources are manufactured from %o, 24Na,and Iz4Sb which can be fabricated into very high activity source^^^^^^ emitting gamma rays with energies above 1 MeV and which have relatively long half-lives so that they do not need frequent replacement as shown in Table 1. Veres and co-workers, for example, assembled a 80 kCi source of ' T o with fluxes of the order of 1012 photons per square centimeter per second close to the source. In calculating photoreaction yields for radioisotopic sources, the fact that they emit their
226
Activation Analysis
TABLE 3 Neutron and Photonuclear Reactions Which May Be Applied in Order to Determine the Light Elements C, N, 0 , and F
Element Carbon
Nitrogen
Oxygen
Fluroine
Nuclear reaction
Abundance (7%)
Threshold energy (MeV)
I2C (n,y) "C "C (n,y) I4C IZC(7,") "C I4N (n,y) I5N I5N (n,y) I6N 14N (7,") I3N 160(n,y) "0 I7O (n,y) "0 180(n,y) I9O 160(y,n) ''0 I9F (n,y) O 'F I9F (7,") 18F
18.7
10.6
15.7 10.4
Half-life Stable 5730 years (P emitter) 20.4 min (P+ emitter) Stable 7.14 s 9.96 min (P+ emitter) Stable Stable 29.1 s 123 s 11.56 s 109 min (P+ emitter)
the lower cross-sections. In examining the particle emission photonuclear reactions, we note that the (y,n) reactions, the most widely used reactions in PAA, yield identical reaction products to those obtained in fast neutron activation analysis by (n,2n) reactions. From this point of view PAA cannot be considered to increase the number of elements which can be determined by nuclear activation methods. The other particle reactions, however, do yield unique activation products and these do widen the scope of nuclear activation analysis by providing new activation products for analysis.
A. PARTICLE EMISSION PAA OF LIGHT ELEMENTS - CARBON, OXYGEN, NITROGEN, AND FLUORINE Historically, the interest in PAA in the 1950s stemmed from the possibility of using it to determine carbon, oxygen, nitrogen, and fluorine in various samples where NAA could not be used, due to the unsuitable nuclear properties of the (n,y) activation products, as shown in Table 3. The photonuclear reactions with these elements result in products suitable for analysis with half-lives long enough to permit their chemical separation following activation, a procedure which is required in the majority of cases because they are pure positron emitters and as such interfere with each other or with other positron emitters present in the 32 Engelmann,1.2using a linac with maximum energy of 35 to 40 MeV and an average electron intensity of 100 PA, gives the following order of magnitude detection limits of these elements (in pg) in the absence of interferences: Carbon
Nitrogen
Oxygen
Fluorine
B. MEDIUM AND HEAVY ELEMENT PAA Lead, is another element whose analysis by PAA, rather than by NAA, is clearly indicated as can be seen in Table 4 where the cross-sections, half-lives, and radiations of the reaction products produced by photon and neutron reactions are given. Order of magnitude detection limits of a few tens of nanograms have been reported for lead in various matrices using PAA followed by chemical separation. However, even without chemical separation, a few ppm of lead can be determined.33The detection limits for other medium and heavy elements are listed in Table 5.'.2 They were calculated assuming a 30 to 40 MeV bremsstrahlung beam and an average electron intensity of 100 PA.
Volume 11
227
TABLE 4 Neutron and Photonuclear Reactions with Lead Element (Abundance
a) 'wPb (1.5)
Reaction
'"Pb (y,n) 203Pb IMPb (y ,n) 203"Pb 203~1 2 w ~(Y,P) b 'lXPb (y,2n) '02Pb 2MPb(y,np) '"TI 'lMPb (y ,2p) 2u2Hg 2wPb(n,y) '05Pb
Threshold (MeV)
8.4
15.2 14.4 12.3
?Mpb (23.6)
'"Pb (y ,n) '05Pb 7.5 25.1
Half-life
Principal gamma-ray emissions (MeV)
5.21 h 6.1 s Stable 3.62 h 12 d Stable 3 x 10⁷ Year 3 x 10⁷ year 4.129 min Stable 67 min 3.81 year Stable Stable
No gamma
No gamma
207pb (22.6) 7.5
14.7
Stable 4.19 2.05 lo7 yea Stable 5.6 min Stable
No gamma
0.205
20Xpb (52.3)
"'Pb (y ,n) 207Pb 2 0 8 ~(,,p) b 21)7~~ ?ORPb(y ,2n) 207Pb '""Pb (y.np) 2mT1 208Pb(y,2p) "lbHg 2onPb(n, y) 209Pb
8.0 14.9 15.4
Stable 4.7 min Stable 4.79 8.1 min 3.3 h
0.897(0.16%) No gamma 0.31
No gamma
Similar tables with detection limits are given by Lutz and other^.'^^'^ It should be noted that, as with the light elements and lead, ultimate detection limits are obtained when the elements in the samples are determined in the absence of interfering reaction products or when the sample are separated chemically. In all cases, advantage may be taken of the high penetration of the photon beam within the sample to activate large samples increasing the effective sensitivity of PAA.
V. INSTRUMENTAL MULTIELEMENT PAA A considerable amount of effort has gone into developing PAA techniques for the analysis of samples containing a large number of elements, by instrumental methods, i.e., without expensive and time-consuming chemical separation of the sample either before or after a~tivation.'~.~' The problems in instrumental multielement PAA occur when the photonuclear reactions with the various elements in the sample produce radionuclides with overlapping gamma spectra making it very difficult, or even impossible, to measure one element in the presence of others. Lists of potential interfering reactions have been compiled by a number
228
Activation Analysis
TABLE 5 Detection Limits For Some Elements by (y,n) ReactionsZ Element
Reaction
Antimony Cesium Copper Gallium Gold Iodine Lead Molybdenum Nickel Rubidium
IZ3Sb(y,n) I2%b "'Cs (y,n) 132Cs WU 6 3 C (y,n) ~ mGa (y,n) 68Ga 1 9 7 A(y,n) ~ I%Au L271(y,n) IzI 204Pb(y ,n) 203Pb 92Mo(y ,n) 9'Mo 58Ni(y,n) 57Ni 85Rb(y,n) fflmRb %Ru (y,n) "Ru "Sc (y,n) "Sc lo7Ag(y,n) IMAg "Sr (7,n) ""Sr lE1Ta(y,n) I8"Ta 203Tl(y ,n) m2Tl T i (y,n) 45Ti 64Zn (y,n) 63Zn 90Zr (y ,n) 89Zr
Scandium Silver Strontium Tellurium
Thallium Titanium Zinc Zirconium
Order of magnitude detection limits (pglg)
of ~ o r k e r s . ~It~has ~ ' been ~ ~ ' found ~ ~ ~that, despite the availability of high resolution Ge(Li) detectors, very careful planning of the irradiation and counting procedures are required for successful multielement analysis. Planning consists of: 1. 2. 3.
4.
Identifying the gamma peaks with the least amount of overlap Carefully selecting the length of the irradiation period and the cooling periods before counting the sample to minimize interferences Carefully selecting the length of counting periods and intervals between consecutive counting periods to resolve the overlapping radionuclides by unfolding the decay curve using suitable computer programs Selecting the energy or energies of the photon beam to take advantage of the different thresholds of the various photonuclear reactions
In passing, it should be noted that interfering reactions can occur if photoneutrons from the bremsstrahlung target are allowed to interact with the sample. Fortunately this problem is easily over come by shielding the sample with cadmium foils which absorb most of the photone~trons.~~~~~ In planning instrumental PAA, it is very worthwhile to consult the comprehensive studies which have been published during the last two decades. Examples of such studies include the study by Aras et al.35 who measured the elemental content of atmospheric particulate material which they collected on filters, the study by Chattopadhyay and J a r ~ i swho ~~ analyzed market garden soils analyzing the same sample at a number of beam energies energies (15, 20, 22, 35, and 44 MeV), the studies by Kato et al.38-40who report on instrumental PAA of various biological, geological, and atmospheric samples, and the study by Galantanu and en gel man^^^^ who analyzed human hair.
A. CALIBRATION For accurate quantitative PAA analysis, the gamma spectra of the unknown samples are calibrated against standards76containing known amounts of elements. This requires that the
Volume 11
229
samples and the standard be irradiated under identical conditions (beam energy, current, and time) to avoid errors from instabilities in the photon beam. A simple method of calibration is to irradiate the sample between two flux monitors and to compare it against a standard sample placed in the same position between identical flux monitors. 'JThis method, however, calls for small, thin samples and is not suitable for simultaneous analyses of a large number of samples. A different method takes advantage of the rotational sample holders used to correct for longitudinal and angular flux gradients within the samples. It is easy to see that they also ensure that the samples and standards receive identical exposures and are thus used widely in instrumental PAA. Internal calibration is another very effective method for samples which contain a known quantity of an element which is activated by the photon beam. Where the samples do not contain a known quantity of an element, internal standard calibration is still possible as shown by Masumoto et a1.53," if the sample under examination contains W, of trace element A to be determined and a suitable element B, that can be used as an internal standard. In this case, a comparative standard can be made by adding, W,* grams of an accurately known small amount of A to a duplicate sample and W, can be determined using the following equation:
where C,* and C, are the counting ratios of the gamma rays emitted by the two radioactive nuclides produced from the elements A and B in the sample and the comparative sample, respectively. Using this method, they find that there is no need to correct for inhomogeneities of flux between the sample and the comparative standard nor to correct for self-shielding in the sample. B. ACCURACY AND COMPARISON WITH OTHER NUCLEAR ANALYTICAL TECHNIQUES Specific studies on the accuracy of instrumental multielement PAA were carried out by a number of authors. Landsberger and Davidson4' used a 25- and 30-MeV bremsstrahlung beam to analyze two standard materials, marine sediment, and lobster hepatopancreas, comparing their PAA measurements with the certified values. They show that PAA gives accurate measurements for over 20 different elements, some of which are trace elements and others minor elements. Their results for lobster hepatopancreas are shown in Table 6. Goekman et a1.4q compared PAA with other activation analysis techniques for the determination of trace elements in human blood while Pringle et compared photon and neutron activation analyses by measuring coal samples by the two methods. Both research groups find good agreement between the various methods. An additional study was published recently by Segebade and Schmitts0 who analyzed high purity samples of iron, copper, and lead for trace elements, comparing the results from instrumental PAA with the results from thermal neutron, fast neutron, and charged particle activation analyses. They conclude that although in some cases the other methods are more sensitive than instrumental PAA, the latter excels in terms of simplicity and relative freedom from interferences with it being particularly suited for the analysis of the light elements, TI, Bi, and several others.
VI. SPECIAL TECHNIQUES A. RAPID PAA Elements whose photonuclear products have very short half-lives can be measured by transferring the activated samples very rapidly from the irradiation position to the counting station.66This increases the number of elements which can be measured by PAA as reported
230
Activation Analysis
TABLE 6 Trace Elements and Minor Constituents of the Lobster Hepatopancreas Reference Material as Determined by Instrumental Photon Activation Analysis Element
IPAA
Certified value
Detection limit
Trace elements (&g) Manganese Nickel Copper Zinc Arsenic Strontium Cadmium Lead Minor constituents (%)
Sodium Magnesium Chlorine Calcium
3.79 k 0.25 0.267 ? 0.02 5.47 2 0.2 0.906 2 0.126
3.67 0.255 5.58 0.895
?
5
*
-C
0.2 0.025 0.1 0.058
0.02 0.0004 0.01 0.0003
Note: Results were obtained by irradiating the samples with 20-, 25-, 30-, and 42-MeV beams and typical currents of 30 to 45 pA for 6 h using a linac with thick tungsten converter.
by Kapitza et a1. l7 who list 20 elements with half-lives less than 1 min. Rapid PAA provides fairly high analytical sensitivities because it is possible to activate the sample to saturation with irradiations of a minute or two. In addition, the sample does not remain radioactive for long periods and this makes it suitable for use in industry where it can be used for continuous analytical monitoring of flow processes. It also paves the way for two special techniques: delayed neutron PAA and high energy electron PAA which were pioneered by Engelmannl who constructed a pneumatic sample transfer system to carry the activated sample from the target area to the counting station in less than 1 s.
1. Delayed Neutron PAA Delayed neutron PAA, as its name suggests, is based on the counting of neutrons emitted from the activated sample following activation rather than gamma rays as in conventional PAA. It has been exclusively applied to the analysis of boron, oxygen, and fluorine which produce 9Li, 16C, and 17N by the llB (y,2p) 9Li, 1 8 0 (y,2p) 16C, 1 8 0 (y,2p) 17N, and 19F (y,2p) '7N, respectively, which are delayed neutron emitters with half-lives of less than 1 rnin.' The advantage of using delayed neutron PAA to measure oxygen does not lie in the greater sensitivity it provides. On the contrary, oxygen can be measured by conventional PAA with detection limits two orders of magnitude lower. It lies in the fact that, provided the sample does not contain appreciable amounts of boron and fluorine, oxygen can be measured nondestructively and that measurements can be performed virtually on line as is the case for all elements measurable by rapid PAA. Another advantage of the delayed neutron ratio to be measured.25This ratio, important technique for oxygen is that it allows the 180/160 for certain geological studies, is very difficult to measure by other PAA techniques. 2. High Energy Beta Ray PAA High energy beta ray PAA is the other PAA technique made possible by rapid PAA.
Volume 11
231
TABLE 7 Typical Photoexcitation Detection Limits with 80-kCi T o Source23 Element
In
Se
Br
Cd
Ag
Sr
Detection limit (mg)
20
40
80
300
500
25
This technique can be used to measure elements whose photonuclear products emit high energy beta rays (>3 Mev) which invariably have very short half-lives.',4 To appreciate the stringent demands this technique makes on the rapid transfer system, we note that the halflives of the beta ray photonuclear products of Li, Be, and S, three elements which have been measured by this technique, are 0.81, 0.84, and 2.6 s, respectively.
B. NUCLEAR PHOTOEXCITION ANALYSIS The characteristic y rays emitted by metastable isomers produced by inelastic gamma ray scattering provides the basis for another special PAA technique called photoexcitation analysis (PEA) which does not involve particle emission and consequently does not alter the identity of the target By analogy with phosphorescence of atoms and molecules excited by visible and UV radiation, the conditions for metastable isomer production are that the target nuclei should have excited states E* whose energy levels are higher than the energies of the metastable isomeric states and that these excited states have a high probability of returning to their ground states via metastable states rather than directly to the ground state. Provided these conditions are met, photoexcitation will occur with a maximum probability at resonance energies which occur just below the threshold energy for particle emission and in the giant resonance energy region. In general, photoexcitation analysis is not as sensitive as particle emission PAA. Even at resonance, the peak cross-sections are only of the order of a few millibarns. This drawback is compensated by the fact that low energy l i n a ~ s 'and ~ even radioisotopic source^,^^.^^ such as T o and 24Nacan be used for photoexcitation making it possible to carry out analyses even where high energy accelerators are not available avoiding at the same time interfering reactions from (?,particle) reactions which cause major difficulties in particle emission PAA. 1. Determinable Elements Tables containing the cross-section values and other nuclear parameters of more than 30 nuclear isomers having half-lives longer than 0.5 s and minimum concentrations of 17 elements determinable by gamma rays of W o , 1161nm , and 24Naare given by VeresZ2Since the photoexcitation cross-sections are energy dependent, the detection limits depend on the activating beam energy. Using a 6 to 8 MeV energy linac at an average current of 100 pA for 10-min irradiations, the detection limits for W, Ba, Y, Se, Br, Ag, Cd, In, Hf, Sr, Ir, Pt, Hg, and Au are between 0.1 and 20 mg.2,74Typical detection limits using a 80-kCi 60Co source are shown in Table 7.
2. Applications PEA has been used to measure Ba, Cd, In, Pb, and Sn in multielement samples,38Au mass percentage and Ag, Ba, in gold-bearing ores with detection limits of 0.3 to 0.5 Hf, and Yt in various geological samples using a high energy bremsstrahlung beams to activate the samples. l7 Photoexcitation analysis using a 80-kCi 60Cosources has been reported for the quick determination of selenium in animal feed, particularly in fish product^,'^ for the determination of bromine in treated plants, and to analyze noble metals in art treasures and archeological objects. PEA has also been used for dosimetry of high energy beams used
232
Activation Analysis
in radiotherapy and food sterilization and for the analysis of depleted nuclear fuels containing bum-up products.22
C. PROMPT PAA Prompt photoneutron analysis is another special PAA technique which has been applied for the determination of beryllium, deuterium, and the fissionable elements. In this technique, measurement is done by counting the neutrons emitted from the sample during the photonuclear reaction rather the gamma rays emitted by the activation products as in conventional PAA.9,55-57 In principle, prompt PAA is a technique which should be applicable to all elements in the periodic table, with the exception of hydrogen, since all elements emit photoneutrons by (y,n) reactions if the photons irradiating the sample have a high enough energy. In practice, however, this technique is only applicable to beryllium, deuterium, and to the fissile and fertile elements 235U,239Pu,232Th,and 238U,elements for which interferences from the photoneutrons emitted by the target assembly, sample holder, and surrounding structural materials can be avoided or neglected. In the case of beryllium and deuterium, stray photoneutron interference can be avoided by irradiating the sample with photons whose energies are above their (y,n) thresholds (2.23 MeV for deuterium and 1.67 MeV for beryllium) but below the photoneutron threshold energies (5 to 12 MeV) of the materials which act as the sources of the stray photoneutron background. Due to the low threshold values of beryllium and deuterium, 24Naand lZ4Sb sources, which emit photons at 2.75 MeV and 2.1 MeV, respectively, can be used to measure beryllium and deuterium noting that lZ4Sbshould be used to determine beryllium in the presence of deuterium whose threshold lies above the energy of 124Sb.The stray photoneutron background cannot be eliminated in the case of the fissil and fertile elements because the threshold energies of the elements for photoneutron emission is of the same order of magnitude as those of the surrounding structural materials. However, prompt analysis is still possible for fissionable elements thanks to their large total cross-sections for photoneutron production (400 to 800 mb in the giant resonance region) which include neutron emission by photofission in addition to the emission of photoneutrons by the usual pathway^.^^-^^ 1. Applications Deuterium in water and body fluids has been determined using a 25-Ci source of 24Na achieving a detection limit of 1.7 pg55 and beryllium has been determined to a lower limit of 60 ppm using a 300-mCi 124Sbsource. Even lower detection limits can be achieved if an electron accelerator operating at high currents is used;58Van de Graaffs with energies in the range of 2 to 10 MeV with high currents are particularly suitable for this purpose. As in all PAA measurements, the detection limits of prompt PAA depend not only on the spectral intensity of the beam but also on the efficiency of the detectors used to count the sample. BF, detectors surrounding the sample with an overall detection efficiency of 3% have been used quite successfully. Better results, however, are obtained using a manganese bath for neutron detection58which is based on the activation of manganese by the 55Mn(n,y) 56Mn reaction and subsequent detection of the 56Mnwith a Na(1) detector. The advantage of the manganese bath detector, besides its higher detection efficiency is that it does not respond to the high photon backgrounds near the accelerator. The use of prompt PAA for fissile and fissionable material^^'-^^ are related to applicationswhich involve nuclear fuels in their various forms. It is certainly not the most sensitive method of measurement of these elements, but it provides the possibility of measuring their concentrations in whole fuel rods and casks of solid wastes by purely instrumental methods, which is very important in nuclear safeguard programs.
D. SECONDARY NEUTRON PAA PAA and NAA can be combined into one technique, to enjoy the best of both worlds,
Volume 11
233
using the photons to photoactivate the sample and the photoneutrons invariably emitted from the target of high energy electron accelerators, to neutron activate the sample. The idea of using an electron accelerator as a neutron source has been discussed by G ~ i n and n ~ inves~ tigated experimentally by Kapitza et a1.I7 who exposed more than 40 different elements for 10 min to neutron fluxes of the order of 10' ns/cm2 near the tungsten target of a 30-MeV microtron operated at 15 pA (average current). The limits of detection ranged from l o p 4 g/g for Ge, Nb, Pr, Nd, and Gd to g/g for In, Eu, and Dy depending on the (n,y) cross-section of the specific element. They point out that an enhancement of the neutron flux by 2 to 3 orders of magnitude is possible by inserting neutron multiplying materials into the irradiation facility. Under these conditions, the thermal neutron densities will be 10" to 10'' n/cm2/s. They further point out that if graphite is used as a moderator, it is possible to extend the moderation zone using the epithermal neutrons in this zone to activate elements with epithermal resonances, such as gold and the rare earths very efficiently while at the same time reducing backgrounds from elements such as sodium and manganese which have high thermal cross-sections but much lower epithermal cross-sections. This technique has been applied by to measure mineral specimens containing elements which are very weakly activated by photons but which have high thermal neutron cross-sections using a mixed (y-n) field, formed by directing bremsstrahlung X-rays from a microtron on to a 10 x 10 x 5-cm lead converter which is surrounded together with the entire irradiation unit by polyethylene. This technique has not received much attention outside the Soviet Union.62However, based on their experience, Kapitza et a1.I7 predict the possibility of electron accelerators becoming the universal tool for nuclear activation providing photons beams for photonuclear reactions and neutron beams for neutron reactions.
VII. APPLICATIONS It is difficult to find a single field of science and technology that requires elemental analysis in which PAA has not been applied at one time or another. Applications discussed in various include analysis of cereals and vegetables for protein content, continuous monitoring of selenium in animal feed stuffs,75 elemental measurements of soil^,^^,^^ atmospheric marine sediments,42fissile element content in nuclear fuels and residue^,^' light elements (carbon, nitrogen, oxygen, and fluorine) in ultrapure metals and semiconductor material^,'^^ and analysis of a wide range of samples of biological origin including animal tissues and f l ~ i d s ~ (hair, , ~ . ~ teeth, ' bones, organ samples, blood, and urine). Other applications can be found in the previous sections in which the various PAA techniques are described. More recent applications deal essentially with the same type of analytical applications. Thus for example, Galantanu and Engelmann" describe the multielement analysis of hair, Federoff et the determination of nitrogen in solids, Isshiki et a126the analysis of carbon and nitrogen in iron, cobalt, and chromium, Pringle et a148the measurement of trace elements in Coal, Carter et alT2the analysis of ancient coin fragments, and Bertholet et als9 characterization of uranium minerals. Interest in PAA for measurement of major elements in samples rather than trace or minor elements has lead lately to applications which include 1.
2.
Use of PAA for the analysis of carbon in coal, without prior wet chemical procedures or postradiochemical separation, by Landsberger and D a ~ i d s o nusing ~ ~ the I2C (y ,na) 'Be reaction irradiating the coal sample with a 30-MeV beam for 6 h and counting the sample after 1 to 3 d delay. Measurement of total body oxygen, nitrogen, and carbon in vivo by photon activation analysis by Ulin et a1.64.65Their method, based on a previous investigation by Brune
234
Activation Analysis
et resolves the positron emitting products 150, "C, I3N produced in the body following activation by 45- and 25-MeV beams into separate contributions using a computer curve fitting algorithm. By irradiating the body from the front and back and correcting for interfering activities from 30P,38K,and 34mC1and for the substantial amount of "C lost by exhalation, they were able to measure 0 , N, and C in living rats with accuracies of 1.4, 4.5, and 1.5%, respectively, with 20-rad exposures. They estimate that similar accuracies can be obtained with humans exposing them to a radiation dose of 1 to 2 rad which is safe for clinical purposes. The similarities in the applications and techniques used between the recent applications and the older ones are readily noted suggesting that PAA, like NAA, has reached a stage of maturity such that well-proven procedures are available to handle most analytical problems.
VIII. CONCLUSION The general c o n s e n ~ u s ~regarding ~ ~ ~ ' ~ PAA considers it a complementary nuclear activation technique to NAA, the latter being more sensitive for the majority of elements while the former fills in gaps for elements which cannot be measured for a variety of reasons by NAA or in circumstances in which NAA does not perform well. FAA compares well with fast neutron analysis, since the (y,n) products are identical to the (n,2n) fast neutron reaction products with the advantage that the photon fluxes available for PAA are much higher than the typical fast neutron fluxes available for NAA. In comparing PAA to charged particle analysis, it should be recognized that while charged particle analysis is a surface technique, PAA is a bulk technique. Therefore, although the limits of detection achievable with charged particles are lower than those achievable with PAA,2 one cannot replace the other for only rarely may it be assumed that the bulk and surface compositions are identical due to surface contamination.
REFERENCES 1. Engelmann, Ch., Photon activation analysis, in Advances in Activation Analysis, 1972, 2. 2. Engelmann, Ch., Charged particles and gamma photon activation analysis, Ar. Energy Rev., Suppl. No. 2, 1981. 3. Hoste, J., Op De Beek, J., Gijbels, R., Adams, F., Van Den W i e l , P., and De Soete, D., Photon and charged particle analysis, in Activation Analysis, Butterworth, London. 1971. 4. Forkman, B., Brune, D., and Persson, B., Photo activation analysis, in Nuclear Analytical Chemistry, Student Litteratur, Lund, Sweden, 1984. 5. Hislop, J. S., Photon activation analysis of biological and environmental samples, a review, Proc. Int. Conf. Photonuclear Reactions and Applications. Vol. 2, Berman, B. L., Ed., Lawrence Livermore Laboratory, Livermore, CA, 1973, 1159. 6. Lutz, G . J., Photon activation analysis - a review, Anal. Chem., 43, 93, 1971. 7. Takeuchi, T., Nuclear techniques in life sciences, J. Radioanal. Chem., 59, 545, 1980. 8. Hislop, J. S., Gamma activation analysis - an appraisal, Proc. Anal. Div.Soc., 15, 193, 1979. 9. Mezhibor Kaya, K. B., Photoneutron method for determining beryllium, Gosatomizdat, State Press for Literature of Atomic Science and Technology, Moscow, 1961. 10. Hayward, E., Photonuclear reactions, NBS Monogr. 118, Washington, D.C., 1970. 11. German, B. L., Atlas of Photoneutron Cross Sections obtained with Monoenergetic Photons, Rep. UCRL74622, Lawrence Livermore Laboratory, Livermore, CA, 1973. 12. Bulow, B. and Forkman, B., Photonuclear cross sections, in Handbook On Nuclear Activation Cross Secrions, Technical Rep. Ser. No. 156, International Atomic Energy Agency, Vienna, 1974. 13. Fuller, E. G. and Gerstenberg, H. M., Photonuclear Data Index (1973-1978), NBS Special Publication PB-284499, National Bureau of Standards, Washington, D.C., 1978.
Volume 11
235
14. Forkman, B. and Petersson, R., Photonuclear Cross Sections, in Handbook on Nuclear Activation Data, International Atomic Energy Agency, Vienna, 1987. 15. Lutz, G. J., Calculations of sensivitivies in photon activation analysis, Anal. Chem., 41, 424, 1969. 16. Masumoto, K., Kato, T., and Suzaki, N., Activation yield curves of photonuclear reactions for multielement PAA, Nucl. Instrurn. Methods, 157, 567, 1979. 17. Kapitza, S. P., Samosyuk, V. N., Firsov, V. I., Tsipenyuk, Yu. M., and Chapyzhnikov, B. A., Analytical Use of Electron Accelerators, Zh. Anal. Khim., 39, 2101, 1984. 18. Kiselva, T. T., Samosyuk, V. N., Firsov, V. I., and Shculepnikov, M. N., Limits of detection of elements in gamma activation analysis on microtron, Zh. Anal. Khim., 33, 1050, 1978. 19a. Pearson, D., A Study of Photon Induced Nuclear Reactions and Their Application Using a Medical Betatron, Ph.D. Thesis, Surrey University, Guildford, U.K., 1982. 19b. Kaminski, R., Matenko, J., Mencel, J., Janiczek, J., and Kielznia, J., Betatron Activation Analysis of Cupriferous Flotation Pulp, Nukleonika, 19, 593, 1974. 20. Galateanu, V. and Grecesuc, M., Instrumental activation analysis of chlorine through photonuclear reactions, Rev. Roum. Phys.. 24, 9, 1987. 21. Lukens, H. R., Otvos, L. W., and Wagner, C. D., Formation of Metastable Isomers by Photoactivation With Van der Graaff Accelerators, Inr. J. Appl. Radiar. Isot., 11, 30, 1961. 22. Veres, A., Gamma Activation of Nuclear Isomers and its Applications, At. Energy Rev., 18, 271, 1980. 23. Veres, A. J. and Pavlichek, I., Nuclear activation analysis by means of 80 kCi T o radiation source, Radioanal. Chem., 3, 25, 1969. 24. Nordmann, F., Tinnel, G., and Engelmann, Ch., Determination of Carbon and Oxygen in Sodium and Cesium by Photoactivation Methods, J. Radioanal. Chem.. 17, 255, 1973. 25. Engelmann, Ch., Fiippi, G., and Gosset, J., A new method to measure oxygen isotopic concentration ratios by gamma activation analysis, J. Radioanal. Chem.. 87, 559, 1977. 26. Isshiki, M., Fukuda, Y., and Igaki, K., Activation analysis of carbon and nitrogen in iron, cobalt and chromium, Trans. Jpn Inst. Met., 27, 449, 1986. 27. Federoff, M., Samosyuk, V. N., Rouchaud, T. C., and Loos Neskovic, C., Determination of nitrogen in solids by photon and reactor neutron activation, J. Radioanal. Nucl. Chem., 112, 395, 1987. 28. Federoff, M., Loos Neskovic, C., and Revel, G., Determination of carbon in metals by photon activation, J. Radioanal. Chem., 38, 101, 1977. 29. Hislop, J. S., Weber, T. J., and Williams, D. R., Determination of oxygen and carbon in indium phosphide by high energy gamma photon activation, Analyst, 98, 75, 1973. 30. Gosset, J., Bock, P., and Engelmann, Ch., On the determination of nitrogen, fluorine, sulfur, and lead in petroleum products by photon and charged particle analysis, Analusis, 4, 161, 1976. 31. Engelmann, Ch. and Cosset, J., Determination of fluorine in aqueous samples by gamma activation method, J . Radioanal. Chem., 68, 169, 1982. 32. Engelmann, Ch., Applications of accelerators in activation analysis in particular for characterization of pure materials, J . Radioanal. Chem., 58, 29, 1980. 33. Lutz, G. J., The analysis of biological and environmental samples for lead by photon activation, J. Radioanal. Chem.. 9, 239, 1974. 34. Kato, T., Masumoto, K., Sato, N., and Suzuki, N., The yields of photonuclear reactions for multielement photo activatio~ianalysis, J. Radioanal. Chem., 32, 51, 1976. 35. Aras, N. K., Zoller, W. H., Gordon, G. E., and Lutz, G. J., Instrumental photon activation analysis of atmospheric particulate material, Anal. Chem., 45, 1481, 1973. 36. Das, H. A., Gerritsen, G. A., Hoede, D., Zonderhuis, J., The determination of some elements in rocks by instrumental photon activation analysis, J. Radioanal. Chem.. 14, 415, 1973. 37. Chattopadhyay, A. and Jarvis, R. E., Multielement determination in market garden soils by instrumental photon activation analysis, Anal. Chem., 46, 1630, 1974. 38. Kato, T., Sato, N., and Suzuki, N., Nondestructive multielement photon activation analysis of environmental materials, Talanta, 23, 517, 1976. 39. Kato, T., Sato, N., and Suzuki, N., Multielement photon activation analysis of rock materials with 30 Mev Bremsstrahlung , Radiochim. Acta, 2 1 , 63, 1974. 40. Kato, T., Sato, N., and Suzuki, N., Multielement Photo Activation Analysis of Biological Materials, Anal. Chim. Acta, 81, 337, 1976. 41. Sato, N., Kato, T., and Suzuki, N., Multielement determination in tobacco leaves by photon activation analysis, J. Radioanal. Chem., 36, 221, 1977. 42. Kato, T., Sato, N., and Suzuki, N., Multielement analysis of deep sea sediments by photon activation, Bull. Chem. Soc. Jpn, 50, 1930, 1977. 43. Chattopadhyay, A., Multielement instrumental photon activation analysis of digested sewage sludges, IAEA-SM-206129 in Proceedings Series, International Atomic Energy Agency, 1977. 44. Galantanu, V. and Engelmann, Ch., Multielement analysis of human hair by PAA, J. Radioanal. Chem., 74, 161, 1982.
236
Activation Analysis
45. Ledingham, K. W. D. and Kelliher, M. G., Multielement photon activation analysis of coal samples using a Compton suppressed Gw(li) detector, J. Radioanal. Chem., 71, 169, 1982. 46. Galantanu, V. and Engelmann, Ch., Multielement analysis of Moroccan phosphate rocks by means of photon activation, J . Radioanal. Chem., 75, 16, 1982. 47. Landsberger, S. and Davidson, W. F., Analysis of marine sediment and lobster hepatopancreas reference materials by instrumental photon activation analysis, Anal. Chem., 57, 196, 1985. 48. Pringle, T. G., Landsberger, S., Davidson, W. F., and Jervis, R. E., Determination of trace and multielement in coal: a comparison between instrumental photon and theraml neutron analysis, J. Radioanal. Nucl. Chem., 90, 363, 1985. 49. Goekman, J. G., Gordon, G. F., and Aras, N. K., Application of different activation analysis techniques for the determination trace elements in human blood, J. Radioanal. Chem., 113, 453, 1987. 50. Segebade, Chr. and Schmitt, B. F., Analysis of high purity material -a comparison of photon activation analysis with other instrumental methods, J. Radioanal. Nucl. Chem., 113, 61, 1987. 51. Bertholot, Ch., Eschbach, H. C., and Verdingh, V., A method for the precise evaluation of interferences in 44 MeV Bremsstrahlung activation, J . Radioanal. Chem., 72, 697, 1982. 52. Segebade, Ch., Lutz, G. J., and Weise, H. P., Quantitative evaluation of interference reactions for multielement photon activation analysis, J. Radioanal. Chem., 39, 175, 1977. 53. Masumoto, K., and Yagi, M., Highly accurate and precise multielement determination of environmental samples by means of photon activation using the internal standard method, J. Radioanal. Nucl. Chem., 100, 287, 1986. 54. Masumoto, K. and Yagi, M., Instrumental photon activation analysis of environmental materials using the internal standard method, J . Radioanal. Nucl. Chem., 109, 237, 1987. 55. George, K. D. and Kramer, H. H., Deuterium analysis by photoneutron detection, Nucl. Appl. Technol., 7, 385, 1969. 56. Guinn, V. P. and Leukens, H. R., Photodetermination of beryllium and deuterium, ANS Trans., 9, 106, 1966. 57. Ali, P. A., Dutton, J., and Evans, G. J., A feasibility study for the in vivo measurement of beryllium by photoactivation activation, Phys. Med. Biol., 30, 1277, 1985. 58. Guinn, V. P., Use of accelerators as neutron sources, in Activation Analysis, Principles and Applications, Lenihan, J . M. A. and Thomson, S. I., Eds., Academic Press, New York, 1966. 59. Bertholet, Ch., Eshbach, H. L., Verdiigh, V., and Verheyen, F., The application of photon activation analysis for the characterization of uranium minerals, J . Radioanal. Nucl. Chem., 113, 259, 1987. 60. Gozani, T., Physics of nuclear materials safeguards techniques, Nucl. Technol., 13, 8, 1972. 61. Grondy, G., Die Zerstorungsfreie Bestimmung von Spalt und Brutstoffen mit einem Electronenlinear Bechleunger, Atomkernenergie, 30,47, 1977. 62. Franks, L. A., Pigg, J. C., Cates, M. R., Kunz, W. E., Noel, B. W., and Close, D. A., High sensitivity trans uranic waste assay by simultaneous photon and thermal neutron interrogation using electron linear 1 accelerator, Nucl. Instrum. Methods Phys. Res.. 193, 571, 1982. 63. Brune, D., L i d h , U., and Lundquist, H., Measurement of oxygen, nitrogen and carbon for in vivo photon activation analysis, Anal. Chim. Acta, 89, 267, 1977. 64. U l i , K., Meydani, M., Zamenhof, R. G., and Blumberg, J. B., Photon activation analysis as a new technique for body composition studies, Am. J . Clin. Nutr., 44, 963, 1986. 65. Uli, K. and Zamenhof, R. G., Measurement of total body oxygen, nitrogen and carbon in vivo by photon activation analysis, Med. Phys., 13, 887, 1986. 66. Dams, R., Selection of short lived isotopes for activation analysis with respect to sensitivity, J . Radioanal. Chem., 61, 13, 1981. 67. Kairento, A. L. and Nikkinen-Vilkki, P., Photodetermination of biological samples and patients with a Betatron, Strahlentherapie, 148, 155, 1974. 68. Davidson, W. F. and Landsberger, S., Determination of carbon in coal by instrumental PAA, Radiochem. Radioanal. Lett., 57, 95, 1983. 69. Williams, D. R. and Hislop, J. S., The nondestructive determination of iodine in soils and biological materials by high energy gamma photon activation, J. Radioanal. Chem., 39, 359, 1977. 70. Masumoto, K. and Suzuki, N., Selective coincidence spectrometry in nondestructive determination of nickel in geological materials with high energy photo activation, J. Radioanal. Chem., 46, 121, 1978. 71. Segebade, Chr., Fusban, H. U., and Weise, H. P., Analysis of some toxic components of environmental samples by high energy photon activation, J. Radioanal. Chem., 59, 399, 1980. 72. Carter, G. F., Rengan, K., Caley, E. R., Carlson, J. H., Carriveau, G. H., Hugh, M. T., and Segebade, C., Comparison of analysis of Roman orichaleum coin fragments by seven methods, Archeometry, 25, 201, 1983. 73. Williams, D. R. and Hislop, J. S., Determination of copper and zinc in bone ash using accelerator produced gamma photons, Proc. Anal. Div. Chem. Soc., 13, 202, 1976.
Volume 11
237
74. Breban, Ph., Blondiayx, G., Valladon, M., Giovagnoli, A., Devaux, M., Michell, S., and Debrun, J. I., Study of the possibility of using nuclear isomers in (y,y) reactions between 6 8 MeV for analysis, Nucl. Instrum. Methods, 158, 205, 1979.
75. Veres, A. J., Determination of selenium content of animal feed using photon activation analysis, Radioanal. Chem., 3 8 , 155, 1977.
76. Suzuki, N., Iwata, Y., and Imura, H., Synthetic multielement reference material with pseudo biological matrix composition, Anal. Sci., 2, 335, 1986. 77. Albert, P., Nuclear methods in trace and ultratrace analysis, Pure Appl. Chem., 54, 689, 1982. 78. Suzuki, N., Iwata, Y., and Imura, H., Synthetic multielement reference material with pseudo biological matrix composition, Anal. Sci., 2, 335, 1986. 79. Albert, P., Nuclear methods in trace and ultratrace analysis, Pure Appl. Chem., 54, 689, 1982.
Volume 11
239
Chapter 5
ACTIVATION ANALYSIS WITH ISOTOPIC SOURCES Gad Shani
TABLE OF CONTENTS I.
Introduction ..................................................................... 240
I1.
Radioactive Neutron Sources and Spectra ....................................... 240
111.
Neutron Cross-Sections ......................................................... 246
IV .
Application of Isotopic Neutron Sources for Activation Analysis ...............251
v.
Coal Inspection ................................................................. 252
VI .
Borehole Investigation ..........................................................267
VII .
Other Uses of Isotopic Neutron Source Activation Analysis ....................273
VIII . Isotopic Neutron Source Activation Analysis in Medicine ...................... 280 IX .
The Use of Organic Liquid Scintillator .........................................291
References ............................................................................. -296
240
Activation Analysis
I. INTRODUCTION Isotopic (or radioactive) neutron sources are very useful for activation analysis. Their major advantage is that they are portable and can be used in cases when the sample can not be irradiated by thermal neutrons from a nuclear reactor. There are cases when the inspected object is too large (an airplane) or it is an on-line inspection. It is not practical to bring hospital patients or a truckload of coal to the reactor. Sometimes there are many samples to be inspected and the result should be available immediately (e.g., samples in industry). Their main disadvantage is that their yield is much smaller than that of a nuclear reactor. The energy of neutrons emitted from an isotopic source is high, thus it has to be lowered to utilize the high cross-section thermal neutron reactions, otherwise low cross-section high energy reactions should be used. Thermalizing the source neutrons ends in reducing their number, thus the benefit of higher cross-sections is sometimes lost. In addition, certain reactions used to detect or measure certain elements require fast neutrons so that the high energy is not clearly an advantage or disadvantage. While thermal neutrons are generally used for delayed activation analysis, isotopic neutron sources are used for both prompt and delayed activation analysis. In the prompt activation analysis, the emitted gamma rays are measured at the same time as the neutron interaction occurs. In the delayed activation analysis, a radioactive material is produced and the activity is being measured at a later time after the neutron interaction. When a nucleus ZA absorbs a neutron, the resulting compound nucleus ZA is in a highly excited state, as the neutron adds both its binding energy and its kinetic energy to the nucleus. The compound nucleus may decay either by the emission of nucleons , e.g., (n,p), (n,a), (n,2n) or by emission of a gamma ray (radiative capture [n,y]). For measurements based on the emitted gamma rays, the irradiation of the subject and detection of the gamma rays must be performed simultaneously. The technique is referred to as "on-line" or prompt gamma neutron activation analysis (PGNAA). While radiative capture can occur at all neutron energies, it is more probable at low energies and, in particular, at those energies (resonances) that produce long-lived states of the compound nucleus. The long life of the compound state reflects the fact that the emission of gamma radiation is a lengthy process on a nuclear time scale (approximately 10-14s). If nucleon emission is delayed by more than 10-14s, the compound nucleus may decay by emission of a gamma ray. Since the transition from the excited compound state to the ground state often does not take place directly but, rather, proceeds through intermediate states, the emitted gamma-ray spectrum is usually complex. Because of the complicated gamma spectrum, Ge(Li) detectors are generally employed, as they have superior energy resolution properties. The small size of the Ge(Li) detectors permits the localization of the detection of the gamma emitter. +
11. RADIOACTIVE NEUTRON SOURCES AND SPECTRA Radioisotope neutron sources are based on the (a,n) reaction with beryllium as the standard target, on the photoneutron or (y,n) reaction with beryllium or deuterium (D20) as target, or on spontaneous fission, with 252Cfbeing the prime example:
Volume I1
241
TABLE 1 Alpha-Neutron Sources Po-Be
Property Yield (nh Ci) Grams emitterici Half-life Heating (W/Ci) Approx. size (mllCi) yEnergies (MeV) y Dose (mR/h-mCi)
2.5 x lo6
2.24
X
138.4 d 0.032
0.1 0.8, 4.43 0.006, 0.11
Pu-Be 1.7 x lo6 16 24,360years 0.031
12 4.43 0.08
Am-Be 2.2
X
lob
0.3 458years 0.033
3 0.06, 4.43 10, 0.1
The alpha-particle emitters most commonly employed in neutron sources are 2'0Po, 239pU, and 241Am.The Po-Be and Am-Be sources are made by mixing fine powders of beryllium with polonium metal or americium oxide, while the Pu-Be material is an intermetallic compound, Pu Be,,. The mixture or compound is doubly encapsulated, first in a welded inner capsule of Ta, then in stainless steel. Characteristics of these sources are summarized in Table 1. The source size is designated by the nominal alpha activity in curies. The practical neutron yield depends on the physical and chemical properties of the mixture. Because of alpha-particle attenuation in the constituents; approximate values are given in the table. The strength (neutrons per second) of a given source is routinely measured by the manufacturer to an accuracy of about ? 3%. However, the strength of a Po-Be source has to be corrected for radioactive decay, while the strength of a Pu-Be source will increase slightly for several years as Z4'Pudecays by beta emission (T = 13.2 year) to Z41Am(commercial plutonium typically consists of about 91% 239Pu,8% 240Pu,and 1% 241pUand 241Am).The apparent source strength may be increased by fission as well. Theoretically, the neutron spectrum could be calculated from the known alpha-particle energy, the Q value, the kinematics of the (a,n) reaction, and the nuclear properties of 9Be. The neutrons are not monoenergetic, because the alpha particles lose energy in the material and all angles of incidence are experienced. Furthermore, in some 80% of the reactions, the 12C nucleus is left in the 4.43-MeV excited state, which then decays with emission of the 4.43-MeV gamma rays noted in the table (the other gamma rays follow alpha decay and most low energy radiation is absorbed in the source). Another complication is the degradation of neutron energy by collisions in the source itself. In practice, then, the spectrum is broad and has to be measured by a suitable neutron spectrometer. Spectra of typical (a$) sources are compared in Figure 1. The Pu-Be source is the largest physically because of the small specific activity. A 5Ci source, for example, may measure 2.5 cm in diameter by 11.2 cm in length, or in another capsule design, 3.2 cm in diameter by 7.2 cm in length. Alpha-particle heating is usually no problem, but fission heating of 239Pushould be considered. It will be noted that the cost per unit source strength is relatively high, the maximum strength relatively low ( S 10' nls), and the source cannot be turned off, but (a$) sources are compact and require no power supply or operator attention. The gamma-ray emitter used in a radioisotope photoneutron source must have an energy greater than the Q value, 1.67 MeV for 9Be (y,n) or 2.23 MeV for 'D (y,n). The energy of the neutron is given by
The plus sign applies when the neutron is emitted at 0"to the direction of the incident gamma ray of energy hv, and the minus sign applies for emission at 180".
242
Activation Analysis
Neutron Energy ( M e V 100'
I .04
.01 0.2 04
1
2
4 6 8 10
Neutron Energy ( MeV ) FIGURE 1. Neutron spectra from (a,n) sources.
*
The most commonly used photoneutron source is 124Sb-Be,with En = 26 1.5 keV. Antimony-124 is produced by the irradiation of normal antinomy (57.2% I2lSb,42.8% IZ3Sb) by the 123Sb(n,y) reaction; the thermal neutron cross-section is 60.9 b. The '24Sbhas a halflife of 60.9 d and emits several gamma rays, including a 1.692-MeV gamma ray in 48% of the disintegrations. The photoneutron source is made in two parts, the clad antinomy cylinder or sphere, and a shall of beryllium metal about 2 cm thick. Practical yield is about lo7 n/s Ci. The neutrons, but of course not the gamma rays, may be turned off by separating the Sb and the Be. Californium-252 is produced in milligram to gram quantities by irradiation of plutonium or transplutonic nuclides in the high-flux (-1014 n/cm2 s) reactors. Nuclear properties are summarized in Table 2. It decays by both alpha-particleemission and by spontaneous fission. The specific neutron emission rate is very high, resulting in very compact sources. The spectrum (Figure 2) is close to that of neutron-induced fission. The source cannot be turned off or pulsed, but it is possible to derive a zero-time signal from the associated fission fragments. However, because of the alpha activity (520 Cilg), the sources are encapsulated and the fission fragments are generally not available. Most neutron sources use a interaction with 9Be. The neutron spectra of all these sources must be similar to each other, corresponding to the transition levels from I3C to I2C. These energy levels are at about 3 MeV, 5 MeV, 8 MeV, and 10 MeV. Neutron spectra from an Am-Be source measured at Ben-Gurion University is shown in Figure 3. It was measured with NE213 liquid scintillator and n-y pulse shape discrimination. The measured proton recoil spectrum was unfolded with the FORIST code (1). Neutron sources are generally kept in a moderator container (paraffin). The activation can be done in the container or outside. A schematic description of the neutron distribution in the moderator is shown in Figure 4.
Volume 11
243
TABLE 2
Properties of 252CfSource Neutron emission rate Neutron per fission Average n energy Capsule size Effective half-life Alpha half-life SF half-life Average alpha energy Total heating yDose rate at 1 m n Dose rate at 1 m Approximate cost
2.34 X 10'' nis-g 4.4 x lo9 nis-Ci 3.76 2.35 MeV < I ml 2.65 years 2.73 years 85.5 years 6.12 MeV
38.5 W/g 1.6 x 10²radlh-g 2.2 x 10' rcmih-g $10/pg plus $1600 encapsulation
ENERGY (MeV) FIGURE 2. Neutron spectrum of '"Cf.
The gamma spectrum emitted from the neutron source generally interferes with the measured gamma spectrum, introducing difficulties in the measurements. When it is not too high compared with the desired gamma spectrum, it can be subtracted as background. Generally shielding (lead) is required to reduce this background to minimum. The effect of fast and thermal neutrons from an Am-Be neutron source on a Ge(Li) detector has been studied by Shani.65Three different measurements were carried out. First, the detector was exposed to a 1-Ci Am-Be neutron source, then a 7 cm thick paraffin slab was placed between the source and the detector, and third, the detector was wrapped with I-mm cadmium sheet. Measurements were performed in a low energy and a high energy range. The part of the spectrum between 3 and 4.5 MeV was found to be completely screened by the 4.43-MeV gamma ray from 12Cin the source. In both energy regions, gamma rays from two different origins were detected: capture gamma rays from the germanium and gamma rays emitted by the source. The latter were
244
Activation Analysis
I ("1
I,l8
I
I
1
2
1
1
4
1
1
6
1
1
,
8
1
1
10
~
,
12
14
NEUTRON ENERGY (MeV) FIGURE 3.
Neutron spectrum from an AmBe source.
DISTANCE FROM THE SOURCE FIGURE 4. Distribution of neutrons due to a fast point source in a moderator.
Volume 11
3000 -
t
245
-FAST NEUTRONS
THERMAL NEUTRONS
ENERGY, MeV FIGURE 5. Gamma spectra due to fast and thermalized Am-Be neurons in the 0 to 4-MeV range measured with a Ge(Li) detector. (From Shani, G . , Int. J. Appl. Radiat. Isot., 24, 519, 1973. With permission.)
ENERGY, MeV FIGURE 6 . Gamma spectrum due to thermalized Am-Be neutrons in the 4- to 7.5 -MeV range. (From Shani, G., Int. J. Appl. Radiat. Isot., 24, 519, 1973. With permission.)
found to be very intense in the low energy range. Gamma-ray spectra due to fast and thermal neutron capture plus the source gamma spectrum are shown in Figures 5 to 7. The capture gamma yield is given in Table 3. Gamma ray spectrum due to 252Cfsource is shown in Figure 8. Room background was not subtracted.
246
Activation Analysis
ENERGY, MeV FIGURE 7. Gamma spectrum due to fast Am-Be neutrons in the 4- to 7.5 -MeV range. (From Shani, G . , Int. J . Appl. Radiat. Isot., 24, 519, 1973. With permission.)
The neutron spectrum of a 228Ra-Be(a,n)source was calculated by Kumar and Nagarajan.2 The alpha energies (MeV) and percentages for a unit activity of 228Ra,when it is in equilibrium with its daughters are 5.34 (29%) and 5.43 (71%), 5.45 (6%) and 5.68 (94%), 6.29 (loo%), 6.78 (loo%),6.05 (25%), 6.09 (lo%), and 8.78 (65%). Ra-228 itself is a beta emitter with a half-life of 6.7 years. From 2 to 10 years after separation of the 228Ra, a 228Ra-Beneutron source can be used with its output slowly varying with time. The primary spectrum of a 228Ra-Besource is given in Figure 9 (the area under the curve = 1 neutron). The peaks are seen at 0.3, 1.9, 3.2, 4.8, 5.7, 6.4, and 7.7 MeV with a shoulder at 2.7 MeV and a broad peak at 9.8 MeV. The spectrum extends up to 14.0 MeV. The measured spectrum of Ansell and Hall3 is shown too. It shows peaks at 3.5, 5.5, 6.25, 7.0, 9.2, and 10.7 MeV with shoulders at 4.25, 5.0, 7.7, and 8.5 MeV and the spectrum extends only up to 11.9 MeV. The thermalization of 241Am/Be-neutronsin paraffin has been studied by Rieppo4 with the aid of the average neutron activation cross-section of the 1151n(n,y) '161n reaction. The existence of almost thermal neutrons in the Am/Be-neutron spectrum was found, and possibly a certain portion of neutrons exists in the A d B e neutron spectrum, whose energy is a few electron volts. The thermalization effect showed a maximum value at a paraffin layer thickness of about 2.5 cm. The A d B e neutron spectrum as a function of neutron energy was performed by absorption measurements of a neutron flux traversing through cadmium and silver filters.
111. NEUTRON CROSS-SECTIONS The number of calculated average cross-sections over the a-Be neutron spectrum found in the literature is small. Values can be found for fission spectrum calculated by the equation
Volume 11
247
TABLE 3a Neutron Capture Gamma Ray in Germanium in the Low-Energy Range Energy (keV)
Gamma1100 captures
Source
13 5.4 5.9 3.4 4.24 39 8.8 17.5 5.5 7.4 2.5 2.4
70Ge(n, y) 71Ge
73Ge(n, y) 74Ge 73Ge(n,y) 74Ge 73Ge(n,y) 74Ge 73Ge(n,y) 74Ge 13Ge (n,y) 74Ge 73Ge(n,y) 74Ge
TABLE 3b Germanium Capture Gamma Ray in the High-Energy Range Energy (MeV)
Gamma/100 captures
See Reference 5 for (n,p), (n,a), (n,2n) cross-sections. Some values are given in Table 4. The resonance integral is calculated by
E, is the cutoff energy assumed 0.5 eV. For most of the elements, the cross-section energy dependence is llv. For some it is llv section plus a resonance. The contribution of the l/v section is assumed 0.44 uo6where uo is the absorption cross-section at 0.025 eV. a, for is 98.8b and for 59Co37.5 b.7 Normalization of the resonance integral was done by Albinssons as follows: RI = 1550 b for 19'Au and RI = 75.0 b for 59Co. Some values of resonance integrals are shown in Table 5. Hugheslo has defined a useful quantity E,,, called the effective energy, assuming that
248
Activation Analysis
CHANNEL
NUMBER
FIGURE 8. Gamma spectrum from a CPSZneutron source (the peak at 2222 keV is due to neutron absorption in the paraffin shield).
-,
.I5
1I
-(CALC.) (MEAS) ---
0
3
6
K U M A R AND NACARAJAN ( 2 ) ANSELL A N D H A L L ( ~)
9
12
14
NEUTRON ENERGY (MeV) FIGURE 9. Neutron spectrum from a Z28Ra-Be.(Reprinted with permission from Int. J. Appl. Radiat. Isot., 29, Kumar, A. and Nagarajan, P. S . , Copyright 1978, Pergamon Journals, Ltd.)
the cross-section u(E) is proportional to the penetrability P(E) of the Coulomb barrier which confronts the charged particle leaving the compound nucleus. In this case, the reaction rate, as a function of the energy E of the incoming neutrons, is proportional to the product of P(E) and +(E). Thus the spectrum-averaged cross-section is proportional to the area under the curve +(E) P(E) in Figure 10. Eeff is defined as the energy for which the area marked
Volume 11
249
TABLE 4
Fission Neutron Spectrum Average n,2n (mb)
Isotope Be9
144
B" 0l6 FeI9 NaZ3 Mg24 ~
1
~
7
SiZ8 p3 I s22
C135 K39 Ca4 Sc4S Ti48 V51 cfl2 MnS5 FeS6 CoS9 NiS8 Cu63 Cu6' ZnM Ga69
0.26 0.40 0.005 0.124
0.33
Br79 BP1 Zr90
Nb9' AgIo7
0.076 0.48 0.46
Ag109 Ba138
2.4
CekW
Au'~~ ~1~~~
3.0
3.0
A is equal to the area marked B, so that the area under the curve +(E) P(E) is the same as the one delimited by 4(E) and a vertical dotted line drawn at E,,. Utilizing neutrons of higher energy allows the determination of elements which are not readily activated with thermal neutrons. The average cross-section a and the effective threshold energy for a threshold reaction are defined by
where a, is the cross-section above threshold and 4 is the neutron spectrum. An appropriate amount of activation may result from resonances. The selective absorption of thermal neutrons is generally effected by enclosing the target inside a material which has
250
Activation Analysis
TABLE 5
Averaged Resonance Integrals for Some Elements (b)839
a high thermal neutron cross-section, such as boron or cadmium. Usually the target is wrapped in a cadmium sheet (about 30 mil). The cadmium resonance peak is at approximately 0.2 eV which overlaps the thermal region (Figure 11). The ratio of thermal to higher energy activation is measured easily and conveniently by the "cadmium ratio". This ratio is determined by measuring the activities induced by irradiating a bare foil and a foil which has been wrapped in cadmium. The cadmium ratio, R,,, is then given by RCd
=
+
(thermal higher energy) higher energy
The average neutron activation cross-sections of the 55Mn (n,y) 56Mn and "51n (n,y) Il6In reactions have been studied by Rieppo" for an ArnIBe neutron source. The results were (420 2 20) mb for the 55Mn(n,y) 56Mnreaction measured in paraffin surroundings and (0.9 0.l)mb outside it. For the "51n (n,y) '161n reaction, it was (1900 + 150)mb and (52 + 6)mb. The average cross-sections for (n,p) reactions of some isotopes have been measured by Vanska and Rieppdz in the neutron spectrum of a 241Am-Besource. With the Am-Be neutrons (energies below 11 MeV), no (n,2n) reactions occurred because of their high thresholds, neither nearly all (n,a) reactions because of high Coulomb barriers for alpha particles. NaI(T1) y-ray spectrometry was utilized as the resolution played no stringent role.
+
Volume 11
251
>(E Neutron spectrum 4 (€1 Penetrab~l~ty curve P (El
Neutron energy FIGURE 10. Effective neutron energy definition (area A = area B).
ENERGY ( e V ) FIGURE 11. Cd total cross-section.
Annular-shaped 24'Am-Be neutron source and sample were used in order to arrive at a constant flux throughout the target volume. Their results are given in Table 6. The average neutron flux values for four different 241AmBesources were calculated by Rieppo13 as a function of the neutron source-to-target distance. The target cross-section was chosen to be equal to the active cross-section of the 241AmBesource. The targets were 0.01 cm thick, thus representing near-infinitely thin target. The calculation was carried out with the Monte Carlo method. Results for an 0.1-Ci source is shown in Figure 12.
IV. APPLICATION OF ISOTOPIC NEUTRON SOURCES FOR ACTIVATION ANALYSIS Application of isotopic neutron source for activation analysis can be divided into three
252
Activation Analysis
TABLE 6
Cross-Sections for Am-Be Neutrons1* Nuclear reaction
T,
19F(n,p) I9O 23Na(n,p) 23Ne 27Al(n,p) 27Mg
29 s 37.6 s 9.5 min
28Si(n,p) 28A1 29Si(n,p) 29AI "C1 (n,p) 51V(n,p) SITi 52Cr(n,p) 52V
2.3 min 6.6 min 5.06 min 5.8 min 3.75 min
56Fe(n,p) 56Mn
2.58 min
Ey(keV)
Abundance (y-ray)
u
&
Au (mb)
)
SOURCE DETECTOR DISTANCE Ccml FIGURE 12. Neutron flux from an "'Am-Be source as a function of source-detector distance. (Reprinted with permission from Znr. J . Appl. Radiar. Isor., 3 1, Rieppo, R., Copyright 1980, Pergamon Journals, Ltd.)
sections: industrial, scientific, and medical. In industrial application, large quantities of material to be inspected pass through a measurement station made of a neutron source and a gamma detector, both shielded. The detector is connected to an analyzing system which analyzes the results and provides information about the quantity of element(s) sought. The scientific application is generally done in the laboratory with small samples, good equipment, very versatile and much less automatic than the previous one. The medical uses are again applications where whole or partial body inspection is done searching for the quantities of certain elements. Although the systems are quite simple to operate and specific for each application, it is not as automatic as that for industrial uses and the inspected quantities are relatively small. Some of the applications are reviewed below.
V. COAL INSPECTION The constituents of coal differ from region to region, mine to mine, seam to seam, and even from truckload to truckload. The availability of the on-line continuous elemental analyzer of coal enables the plant operators to improve control of boiler efficiency, reduce pollutant emissions and verify the specifications that control coal cost, all on a real-time
Volume I1
253
basis. Similarly, it enables the operators of coal mines and the coal-cleaning plants to maximize their product and maintain the desired quality. The method is capable of measuring the abundances of all major and minor elemental constituents of coal (H, S, C, N, C1, Si, Al, Fe, Ca, Ti, K, Na) along with total ash, moisture, and calorific value. Prompt y-rays from thermal neutron capture and from fast neutron interactions with important elements in coal have high energies, consequently they are relatively penetrating (see Table 7). Measurement of the concentrations of the dominating elements in the mineral component (e.g., Al, Si, Fe, Ca, S) allows the ash content to be derived to an accuracy determined by the correlation between the concentrations of these elements and the ash content for a particular deposit. The penetration of neutrons and the resultant high energy y-radiation is favorable to large sample analysis. Measurement of elemental contents within acceptable statistical uncertainty can be derived within a few minutes. Figure 13 shows the variation of neutron flux with density. The density dependence is important for any non-negligible change in detector response. A substantial decrease in sensitivity to density variations is achieved by incorporating a neutron reflector in the system. This services to reduce neutron loss, by reflecting neutrons back into the coal. Important factor in the variations in neutron slowing down and migration lengths which give rise to substantial space, energy variations, and arise from changes in bulk density, moisture content, and chemical composition. The uncertainty in the correlation, between A1 and total ash content coupled with the error of measuring the intensity of the 1.78-MeV delayed gamma ray from the reaction 27Al (n,y) 28A1[Tl,2= 2.3 min] used to determine the aluminum content, gave an overall error in the percent ash content in a train load of coal (- 1000 t) of _t 1.8% ash at the nominal 20% ash level.16 241Am-Besource with about 30% of emission above the threshold of the 28Si(n,p) 2gAlhas the advantage over 252Cfsource. To observe oxygen adequately, it is sufficient to use a 24LAmBeneutron source which emits a significant number of neutrons above 6 MeV. The corresponding y-ray spectra from the same coal under identical measuring conditions can be seen in Figures 14 and 15 which show a region of the y-ray spectrum containing the 160(n,nfy) line at 6.13 MeV for 2s2Cf and 241AmBe,respectively. The strength of this line with 241AmBecompared to "'Cf is evident. The major elements in coal can be divided into two groups according to nuclear reaction by which prompt or delayed y-rays are emitted. Group 1, the "fast group", includes oxygen, carbon, silicon, and aluminum which can be observed through either (n,nly) or (n,p) reactions. Group 2, the "thermal group", includes elements such as hydrogen, carbon, nitrogen, sodium, potassium, aluminum, silicon, sulfur, chlorine, calcium, iron, and titanium. Silicon, carbon, and aluminum occur in both groups. Nuclear techniques are unable to differentiate between "free" and inherent "bound" moisture. Coal analysis by nuclear methods was described by Clayton and WormaldLsin borehole logging and on-line. Application of Monte Carlo techniques to borehole logging is given in Figure 16 which shows the variation in neutron flux along a radius from the source position for coal with the borehole empty and filled with water. A significant improvement in performance was achieved by normalizing to the hydrogen 2.23 MeV capture y-ray. Measurements of the concentration of the principal ash-forming elements can be used to derive ash content. Wormald et al.14 used a correlation between aluminum concentration and ash content, after establishing from analysis of a random suite of 93 samples of U.K. coals that the correlation was within +- 1.51%. A method was described by Wormald and Clayton17which allows total elemental analysis of coal by measurement of y-ray spectra from fast and thermal neutron interactions and which was independent of variations in neutron flux in the material.
TABLE 7 Nuclear Properties of the Main Elements in Coal14 Thermal neutron cross-section (b) Element
Total
Absorption
Activation
Half-life of induced activity
10-5(l3c) 8 x 120-8(2H) 3x 10-~(1~0) 9 x 10⁻⁸ 0.01 ("S) 0.000023 (=S) 0.0033 0.23 0.13(54Fe) 0.0036(58Fe)
5736 y 12.3 years 27.1 s 3.13 s 87.5 d
0.39(Ta) 0.02 (+"'a) 0.00002(~~ca)
1.3 x 10⁵ years 163 d 4.54 d
2.62 h 2.246 min 2.7 years 44.6 d
0.095
5.8 rnin
0.0042
9.46 min
O.Ol("S) 0.000023(%) 0.4(23Na) 0.13 1.83(39K) 0.098(4'K)
87.5 d 5.1 min 20 ms 15.03 h 1.3 x lo9 years 12.4 h
?-Ray energy
(kev)
Abundance of oxide in ash (%) Typical
Range
Volume 11
255
Neutron Flux
High Sample Density
/
I I
Source
I I
I
I
I
Crossover
Detector
Region FIGURE 13. Neutron flux dependence on coal density. (Reprinted with permission from Int. J . Appl. Radiar. Isot., 34, Clayton, C . G. and Wormald, M. R . , Copyright 1983, Pergamon Journals, Ltd.)
Energy - keV FIGURE 14. Prompt y spectrum from 252Cf neutrons interaction in coal. (Reprinted with permission from lnr. J. Appl. Radiar. Isor., 34, Clayton, C . G. and Wormald, M. R., Copyright 1983, Pergamon Journals, Ltd.)
The principal problems to be overcome for on-line analysis arise from the heterogeneity of the intrinsic mixture of combustable and ash-forming elements, from the range of elemental compositions in coals of different origin and type, and from the particle size distribution. The requirement to resolve y-rays from all the primary elements in coal invokes the use of a high resolution detector, such as Ge(Li) or hyperpure Ge. This poses an additional problem
256
Activation Analysis I
I
I
I
I
I
I
I
ENERGY- keV FIGURE 15. Prompt y spectrum from "'Am-Be neutrons interaction with coal, note the wide peak due to 12C(n,n'y)reaction. (Reprinted with permission from Int. J . Appl. Radiat. Isot., 34, Clayton, C. G . and Wormald, M. R., Copyright 1983, Pergamon Journals, Ltd.)
of optimizing the source-sample-detector configuration so as to minimize the neutron damage to the detector for a given signal. y-rays following activation of the target nucleus can be measured after the sample is moved from the irradiation position, however, the number of elements which can be observed, especially when the material to be analyzed is moving, as in an on-line situation, is restricted to those nuclides whose half-lives lie within a narrow time band. Hydrogen and carbon which are vital to an analysis of coal cannot be observed since neither elements emits delayed y-ray following activation. Coal contains a high atom density of hydrogen and carbon in sufficiently large volumes that cause neutrons to be slowed down to thermal energies within the sample. Slowing-down lengths in coals are typically in the range 5 to 10 cm for neutrons of 1-6 MeV. A thermal peak in the neutron energy spectrum exists in the coal. Figure 17 shows neutron energy spectra computed at two distances from the neutron source by the discrete ordinates method for the case of a point 241Am-Besource in an essentially infinite volume of a bituminous coal. Two reactions are important: capture reactions (n,y) in which the product nucleus is in a highly excited state and de-excites by y-ray emission directly or via intermediate states to the ground state. Capture reactions typically have a cross-section a En-'"and, therefore, these reactions predominate in the thermal region of the neutron energy spectrum. Inelastic scattering (n,nly) reactions, which are threshold reactions, only occur with fast neutrons. The product nucleus is in an excited state which decays promptly, with the emission of only one y-ray. The response Rij (events per second in the y-ray peak) to prompt y-rays within a y-ray energy group i from the element j with a y-ray production cross-section uij(En) may be written
Volume 11
I
10
20
R a d i a l distance
257
30
(cm)
FIGURE 16. Radial distribution of thermal neutron flux from a point source on the axis of a bore hole. (Reprinted with permission from Int. J . Appl. Radiat. Isot., 34, Clayton, C . G. and Wormald, M. R., Copyright 1983, Pergamon Journals, Ltd.)
U)
..
I
1
I
I
Neutron Flux Spectra for
I
I
I
24hm - Be in
I
I
Coal
Neutron Energy- eV FIGURE 17. Calculated neutron spectra from an 24'Am-Be source at distinces r = 5 cm and r = 30 cm in a large volume of coal. (Reprinted with permission from Int. J. Appl. Radiat. Isot., 34, Wormald, M . R. and Clayton, C. G., Copyright 1983, Pergamon Journals, Ltd.)
258
Activation Analysis
here En is the neutron energy, r is the radius vector, +(En,r) is the neutron flux with energy En at r, €(Eyi,r)is the direction efficiency for a y-ray of energy E,' emitted at point r, N, is the number density of nuclei of element j per unit volume at r, and V is ideally confined to the volume of coal interrogated in practice. The y-ray detection efficiency for events in a selected peak can be expanded
where rd is the distance from the point r to the detector and pi is the y-ray linear attenuation coefficient in the coal. This assumes that there is no other material between the point of origin of the y-ray and the detector. e2(E;) is the cross-section of the detector for a y-ray of energy E,' being recorded in the identified peak in the spectrum. Neglecting the weak dependence of p,, on E,', the function e(E,',r) can be separated intoI7
A lead shield placed between the source and the sample serves to attenuate those y-rays which travel from the neutron source towards the detector. This is particularly important when using an 24'Am-Be source so as to avoid interference between the unwanted 4.43MeV y-ray from the source and the y-rays of the same energy from the reaction I2C (n,nly) which are used in the determination of the carbon content of the sample. A lead reflector placed behind the neutron source serves to scatter neutrons back into the sample and to increase the ratio of y-ray generated within the sample to those generated outside. The performance of borehole logging equipment was described by Clayton et a1.I8 It was based on a 252Cfneutron source and measurement of the spectra of thermal neutron caputre y-rays from most of the important elements in coal. It was shown that although a high statistical counting accuracy can be obtained for several elements in a measuring period of about 5 min, the derived concentrations are limited by the low capture cross-section of carbon. In borehole logging during coal exploration, such an analysis can give an early indication of coal quality by allowing direct determination of concentrations of sensitive elements, such as sulfur and chlorine, and the derivation of important economic parameters, such as ash content and calorific value. Only neutron interaction techniques offer the possibility of in-situ multielement analysis in the difficult environmental conditions encountered in practice. It is desirable that the borehole is not lined with materials which contain large quantities of those elements of special interest in the coal. The Ge(Li) detector with an efficiency of 11% was coupled to a 4096-channel mini computer-based pulse height analyzer via conventional pulse processing electronics. Energy calibration of the y-ray spectra was achieved using lines from hydrogen (2223 keV) and chlorine (7790 keV). A borehole probe system is shown in Figure 18. The detector efficiency as a function of y-ray energy, derived from the identified chlorine lines by dividing peak areas by reported emission intensities, are presented in Figure 19.18 The relationship used to determine the elemental concentrations was
where k is an arbitrary normalizing constant and chosen such that Zc, = 100 and Z refers to the summation over those elements measured. c, is the mass concentration of element j; A, is the atomic mass of element j; Rij is the detector response to y-rays within a y-ray
Volume I1
259
ISOTOPE NEUTRON
FIGURE 18. (n,y) probe arrangement in a borehole.
0
1 2 3 4 5 6 7 8 9
Gamma-ray energy (MeV FIGURE 19.
Relative peak efficiencies for a Ge(Li) detector.
group i from element j; @!!) is the relative detector efficiency for y-rays of energy E!; Iij is the number of y-rays in energy group i emitted by element j per 100 neutrons captured; crj is the neutron capture cross-section for element j. The precision obtainable with a Californium-252 neutron source in the short counting periods available operationally is limited by the low capture cross-section of carbon and the absence of any data on oxygen. The use of high counting rate electronics is necessary to obtain results of acceptable accuracy in the short measurement time.
260
Activation Analysis 0.7 1
I
I
I
I
I
I
I
NEUTRON ENERGY( MeV) FIGURE 20. Cross-section for y-ray production by inelastic scattering of neutron from silicon (ENDFJBIV, Mat. 1194, Neutron Cross Section Library, Brookhaven National Laboratory, Upton, Long Island, NY,1979).
Monte Carlo calculations of fast neutron flux distributions have been made by Clayton and C01eman'~for 2s2Cf,241Am/Beand 14-MeV monoenergetic neutron sources in a range of bituminous coals. The configruations examined were sources at the center of a sphere, at the midpoint of the plane surface of a hemisphere and at or near the source of a parallelsided slab. The neutron fluxes were analyzed in terms of the resultant yield of y-rays from inelastic scattering on silicon, carbon, and oxygen, which are the key reactions for determining the oxygen content of coal by processes yielding prompt y-rays. The ratios of the response functions for inelastic scattering by the critical elements were found to be very insensitive to the type of coal, indicating that oxygen analyses could be performed for a given configuration on benchmark experiment on a coal of intermediate composition. Thermal neutron capture y-ray spectrometry offers the possibility of measuring the concentration of all the principal elements in coal except oxygen, which has a very small capture cross-section. However, oxygen concentrations can be derived from the 1 6 0 (n,nly) reaction, which has a threshold at 6.13 MeV. Carbon and silicon concentrations can also be derived through inelastic scattering reactions, as well as by measurement of thermal neutron capture y-ray intensities. Most coals are good neutron moderators, so that a localized source of fast neutrons gives rise to a spectrum of thermal neutrons whose shape, the Maxwellian distribution, is independent of the source spectrum, the distance from the source, and the particular type of coal involved. At energies above the thermal group, there is a slowing down spectrum which closely follows a 1/E law. The intensity of this epithermal group relative to that of the thermal group is usually a few percent and varies rather slowly with position and with coal type. l9 The energy dependence cross-sections of the 28Si(n,nly), I2C (n,nly), and 160(n,nly) are shown in Figures 20 to 22. Gamma-rays of energy 1.79 MeV as produced by the 28Si (n,nly) reaction are also produced by the 28Si ( n , ~ ) * ~ A reaction l following the P-decay of 28A1to 28Si with a half-life of 2.27 min. The 2sSi (n,p) reaction has a threshold of 4.04 MeV and a significant cross-reaction only above about 7 MeV, so that the contribution from this reaction is negligible for 252Cfsources, and small for 241Am/Besources. Neutron spectra in coal due to Am-Be and 252Cfneutron sources are shown in Figures 23 and 24.19 A method has been developed by Wormald et al.'O to determine the ash content of coal in moving wagons. It was based on an observed correlation between aluminum content and ash and on measurement of the aluminum content by neutron activation analysis using a
Volume 11
4
6
8
10
12
14
261
16
NEUTRON ENERGY (MeV) FIGURE 21. Cross-section for y-ray production by inelastic scattering of neutrons from carbon (ENDFIBV, MAT. 1306, Neutron Cross Section Library, Brookhaven National Laboratory, Upton, Long Island, NY, 1979).
Neutron energy ( MeV ) FIGURE 22. Cross-section for y-ray production by inelastic scattering of neutrons for oxygen.
252Cfsource. The source was placed outside the wagon with a reflector behind it. Ash content, water content, bulk density, the design of the source mounting, and the sourcedetector separation have been studied theoretically using Monte Carlo computer techniques. The most fundamental source of error lies in the degree of correlation between the selected elements and the true ash content. The smallest number of elements to give an accuracy within the acceptable limits should be investigated. Other errors may arise from variations in operational parameters, such as moisture content, coal density, wagon movement, wagon speed, choice of source and source-detector separation, and errors in the measurement of the intensity of y-rays and from the activated elements. In the Monte Carol procedure, individual neutrons are generated in the source and tracked to absorption in such a manner that, on average, the neutron behavior conforms to the known neutron emission, scattering, and absorption data. For individual neutrons, a random choice
262
Activation Analysis
FIGURE 23. Neutron spectra for an "'Am-Be neutron source in coal ratio of neutron flux per unit lethargy interval to thermal flux in a sphere of radius 100 cm. The radii zone: X 10 to 15 cm, .25 to 30 cm. (From Clayton, C. G. and Coleman, C. F., Int. J . Appl. Radiat. Isor., 36, 757, 1985. With permission.)
En( MeV) Neutron spectra for a 252Cfneutron source in coal - ratio of neutron flux per unit lethargy interval to thermal flux in a sphere of radius 100 cm. The radii zone: x 10 to 15 cm, a25 to 30 cm. (From Clayton, C. G. and Coleman, C. F., Int. J . Appl. Radiat. Isot., 36, 757, 1985. With permission.)
FIGURE 24.
of possible values is made for the energy and direction of emission, the distance travelled before each collision, the nature of the reaction taking place at the collision, and the energy and direction of the scattered neutron, if not absorbed. These choices are weighted with the known probabilities of each event obtained from neutron source data, neutron interaction cross-section data, and the distribution of nuclei forming the materials within range of the source. The more neutrons which are tracked, the greater the statistical accuracy of the results, although a practical limit must be placed on this number due to the total available computing time. The 28A1production rate, R, in the spatial bin (ri,zj) is given by20
Volume 11
263
where N,, is the 27Al atomic density and u, is the average neutron capture cross-section for 27Alover the kth energy bin. The counting rate due to bin (x,,y,,z,) is then given by
where drzijkis the detector absolute efficiency, p is the y-ray attenuation coefficient in the coal, 5 = [zk - d)/zk]rij, is the y-ray path length through the coal, and d is the distance between detector and wagon wall. R' has been derived from R by transforming the coordinates from cylindrical polars to Cartesian and
The value of R at the center of a Cartesian bin was derived by exponentiail interpolation between adjacent polar bins:
The total counting rate was then obtained by summation:
CD(s) is the static response function assuming zero half-life. The second stage of the calculation is concerned with deriving the response for a moving wagon, C,,,(v,S,), containing a region of radioactivity of mean lifetime T. This was carried out by integrating the static response function, weighted with the exponential decay factor, over all values of s, thus
where v is the speed of the wagon and S, is the distance between source and detector in the practical situation of a moving train. The number of detected full energy events per unit length of wagon is then C,,(v)/v. In the calculations, the total density has been kept constant, whereas in reality the density may be a function of ash content. Any such positive correlation will reduce this nonlinearity, or even reverse it. The response was found to increase with increasing density as shown in Figure 25. The effect of changing the reflector behind the source from lead to water is shown in Figure 26. The lead scatterer increases the response 1.75 times. A water scatterer increases the response by a factor of 2.3 over the case without scatter. Coal samples of three different sources, South Africa, England, and Australia, were investigated at Ben-Gurion University using a 5-Ci (1.1 x lo7 nls) 252Cf The gamma rays were measured with a 3 in. X 3 in. NaI(T1) scintillator. The system is described
264
Activation Analysis
Ash 2 0 % Water 5%
0
.i=20-
0
Sj
I
0
I
I
I
I
1
I
30 40 50 60 70 E Source to detector distance(cm) 10
20
FIGURE 25. Calculated variation of static response with coal density. (Reprinted with permission from Int. J . Appl. Radiar. Isot., 30, Wormald, M . R. et al., Copyright 1979, Pergamon Journals, Ltd.)
-
I I
Ash: 20% Water: 5 % 3 Density: 1.0g/cm LEAD
0 m
80
Source to detector distance(cm) FIGURE 26. Calculated variation of static response with source-detector for various scattering materials behind the source. (Reprinted with permission from Inr. J . Appl. Radiat. Isot., 30, Wormald, M . R. et al., Copyright 1979, Pergamon Journals, Ltd.)
in Figure 27. Each measurement lasted a few hours to obtain low statistical error. Examples of the gamma spectra obtained are shown in Figures 28 to 30. Some of the peaks are due to more than one element. The peak marked S also includes contribution from Fe, C1, and N. Iron emits gamma rays at energies 7.631 and 7.645 MeV and aluminum at 7.724 which are not separable. The concentration of sulfur which is one of the most important impurities in coal was determined by the count in the 5.4-MeV peak. Chemical analysis showed the following
Volume 11
265
H.V >
SUPPL
C O A L NEUTRON SOURCE
pb
BOX
N oI
& AMPL - AMP1 - MCA i
( 3Ox30~30cm)
FIGURE 27. System layout for prompt and delayed neutron activation analysis (From Shani, G. and Nir-El, Y., Coal Composition Analysis Using Nuclear Method, report to Israeli Ministry of Energy, 1984. With permission.)
C H A N N E L NUMBER FIGURE 28. Gamma spectrum in the range 2.5- to 10 -MeV from South African coal. (From Shani, G. and Nir-El, Y., Coal Composition Analysis Using Jhclear Method, report to Israeli Minister of Energy, 1984. With permission.)
concentrations of sulfur: South African coal 0.69%, British 1.E%,and Australian 0.57%. The number of counts under the curve did not follow exactly these ratios and the contribution of other elements to this peak were found by solving a set of three equations of the following form for the three samples of coal,
266
Activation Analysis
200
I(
CHANNEL NUMB1 FIGURE 29. Gamma spectrum due to hydrogen (2.2MeV) from South African coal (From Shani, G. and Nir-El, Y . , Coal Composition Analysis Using Nuclear Method, report to Israeli Minister of Energy, 1984. With permission .)
where X,(S), X,(Cl), and X,(Fe) are the counts in the peaks of 5.4 MeV (S), 6.1 MeV (Cl), Al). and 7.6 MeV (Fe The contribution of the other elements was neglected (assumed small). a,,a,,and a, are the factors to be found. The solution was a, = 2.1, a, = 0.85, and a, = 0.56, which meant that the main contribution to the 5.4 peak was due to sulfur, some due to A1 Fe and a little more due to chlorine. Using these constants, the weight percent of these impurities can be found in every unknown sample. Similar equations were solved for the peaks at 7.6 to 7.7 MeV due to Si, Fe, an Al. Si has another peak at 3.539 MeV which has to be resolved from the carbon peak. Due to its importance, Ga was sought too. It was done using the reaction
+
+
The compound nucleus 72Ga decays by P- emission with 14.1-d half-life and is most conveniently detected by the gamma peaks at 630 and 834 keV. The uranium content (12.7% of the ash) was determined by delayed fission neutrons. Nitrogen was determined by the
Volume 11
2
2672
267
3
CHANNEL NUMBER FIGURE 30. The peak at 7.6 to 7.7 MeV due to iron and aluminum
in Australian coal. (From Shani, G. and Nir-El, Y., Coal Composition Analysis Using Nuclear Method, report to Israeli Minister of Energy, 1984. With permission.)
reaction 14N (n,2n) I3N and measurement of the two 511-keV photons following the P+ emission. Other elements were determined too from the gamma-ray spectrum. Gamma spectrum of South African coal activated by thermal neutrons measured with a Ge(Li) detector are shown in Figures 31 to 33 at times 15 min, 21 h, and 4 d after irradiation. Elemental content of oil shale was investigated using a 5 Ci AmBe source.22A 25-kg sample was irradiated through 5-cm lead shield for 2 d to obtain good statistics. The resultant spectrum is shown in Figure 34. The major elements H, C, Al, Si, S, Ca, and Fe are clearly seen and their quantities can be measured.
VI. BOREHOLE INVESTIGATION In many cases, neutron activation analysis is done in a borehole in ground. The most common use of a neutron source in borehole is in case of moisture measurements. Oil and coal are commonly inspected in borehole. There are particular problems related to such use of a neutron source. If the medium contains hydrogen or carbon, the neutrons are therrnalized. In any case, neutrons are scattered into the detector. The geometry is such that the source and detector are at close proximity. Some such uses are described here. Minerals investigation by neutron activation in a borehole was discussed by Czegledi.13 The neutron source and detection system are inserted into the borehole. The spatial distribution of neutrons for given geometrical conditions can be determined by solving Equation 17
x,
where D is the diffusion coefficient,
268
Activation Analysis
CHANNEL NUMBER FIGURE 31. Delayed gamma spectrum from South African coal 15 min after irradiation. (From Shani, G. and Nir-El, Y . , Coal Composition Analysis Using Nuclear Method, report to Israeli Minister of Energy, 1984. With permission.)
where r is the distance from the origin (source) and I, is the diffusion length (L;
=
DIG,). In rock investigation, search for minerals is determined primarily by neutron slowing hydrogen. The main drawback of the neutron-? method, compared to the neutron-neutron method (neutron slowing down) is that the sensitivity to porosity of the neutron-neutron method is about ten times higher than that of the neutron-? method. In order to present a correct interpretation, it is important to choose a proper spacing between source and detector. The thermal neutron density of some materials with different hydrogen porosity determined with different values of spacing is shown in Figure 35. The "inversion" of the curves occurs in the 15 to 30 cm range, the value is depending on porosity. System calibration can be done in a test pit. An artificial well was built from three rock blocks, each of them with a diameter of 1.8 m and different porosities (Carthago marble: 1.9%; Indiana limestone: 15%; Austin limestone: 26%); thus, the characteristic curve of neutron sondes can be dete~mined.~~ The compensated neutron log method utilizes two detectors pressed against the wall.
Volume 11
269
CHANNEL NUMBER FIGURE 32. Delayed gamma spectrum from South African coal 21 h after irradiation. (From Shani, G. and Nir-El, Y . , Coal Composition Analysis Using Nuclear Method, report to Israeli Minister of Energy, 1984. With permission.)
The ratio of counting rates obtained using short- and long-spaced detectors is directly proportional to the porosity. In the oil industry, neutron methods are widely used: to identify the lithological units in the section; to measure the porosity of rocks; to determine the gas content of formations; to determine the oil-water contact; to estimate the clay content of the rocks, in combination with the y-y method; to control production of gas wells, and to examine technical conditions of wells. An example of porosity measurement is shown in Figure 36. With neutron-y-spectrum logging, the y-spectrum generated by capture of thermal neutrons is recorded along the borehole. In the oil industry, only one version of the method, the so-called "chlorine logging' ' , is used to determine oil-water contact. Logging is carried out in the 5- to 6-MeV energy range, where 38Cl displays several peaks. Although the majority of y-peaks emitted by chlorine falls into the energy range below 3 MeV, this fraction of the spectrum cannot be utilized because of the presence of hydrogen and rock minerals. Figure 37 shows a spectrum in an oil-prospecting b~rehole.'~ In ore mining, neutron-y-spectroscopy is used to detect Fe, Hg, and Ni. In these cases, logging is carried out in the energy ranges 5.0 to 6.5, 6.3 to 6.9, and 8.2 to 8.8 MeV. Sensitivity of the method to Hg is 0.1%. Neutron activation logging can be regarded as a variant of neutron activation methods, adapted specifically to borehole measurements. The following limitations of the method should be considered.
270
Activation Analysis
CHANNEL NO. FIGURE 33. Delayed gamma spectrum from South-African coal 4 d after irradiation. (From Shani, G . and NirEl, Y . , Coal Composition Analysis Using Nuclear Method, report to Israeli Minister of Energy, 1984. With permission.)
Under borehole conditions, high activation radiation sources cannot be used; in general, Po-Be and Po-B sources of 70 to 400 GBq (2 to 10 Ci) activity have proved good. Detection is limited to elements with their corresponding isotopes having a half-life shorter than 1 to 2 h. When selecting the appropriate method, attention should be paid to the fact that, besides the element to be studied, some other elements are also present, in unknown concentrations. The station measuring technique is used only for the solution of special tasks as it is
at the same depth where the source had been earlier. The maximum difference between depths must be kept smaller than 2 cm. Thus, the activating and measuring operations can be performed repeatedly, step by step. Continuous logging is carried out by lowering the tool downwards at a speed appropriate to the half-life of the material to be activated. The following equation can describe the intensity of y-radiation accompanying reaction (n,nl) in a homogeneous medium:
Volume I1
CHANNEL
NO
FIGURE 34. Prompt gamma spectrum from Israeli oil shale. (From Shani, G. and Nir-El, Y . , Oil Shale Analysis Using Thermal Neutron Prompt Gamma Measurement, report to Israeli Minister of Energy, 1984. With permission.)
ZONE O F INVERSION
SPACING, cm FIGURE 35. Thermal neutron flux vs. source detector distance for different hydrogen contents. (From Czegledi, I . , Nuclear Borehole Geophysics in Industrial Application of Radioisotopes, Foldiuck, G . , Ed., Elsevier, Amsterdam, 1980. With permission.
271
272
Activation Analysis
'0
2
10 2 0 5 0 I00
5
POROSITY, O/o FIGURE 36. (n,y) intensity vs. porosity for various borehole diameters (r = 60 cm). (From Czegledi, I . , Nuclear Borehole Geophysics in Industrial Application of Radioisotopes, Foldiuck, G . , Ed., Elsevier, Amsterdam, 1980. With permission.)
O
0
.
2
3
4
5
6
7
8
Ey MeV
FIGURE 37. (n,y) spectra; I in cement, I1 in water-bearing sandstone, 111 in oil-bearing sandstone. (From Czegledi, I . , Nuclear Borehole Geophysics in Industrial Application of Radioisotopes, Foldiuck, G., Ed., Elsevier, Amsterdam, 1980. With permission.)
where A is the activity of the radiation source; i is the number of y-quanta produced in the (n,nl) reaction, En,,, and Z, are inelastic and total scattering cross-sections, respectively; p is the density of the medium; I, and I, are distances of the site of the (n,nl) reaction from radiation source and detector, respectively; V is the volume. In addition to the (n,nl) reaction, fast neutrons can undergo the reactions (n,p), (n,2n), and (n,cx). Table 8 shows some important properties of elements which can be activated by neutrons. Special attention should be given to oxygen which generates a particularly hard y-radiation, useful for the detection of oxygen. As carbon does not produce y-emitting nuclides, the C/O ratio cannot be determined by fast neutron activation. The only main application of the method is activation of oxygen for detecting water circulation behind a casing.
Volume 11
273
TABLE 8
Fast-Neutron Activation Characteristics Of Some Elements Roduct of reaction (radioactive isotope)
Isotope
Relative abundance in the product (%)
Type of reaction
Threshold energy
(MeV)
Isotope
Half-life t
,
7.3 s 30.0 s 7.35 s 40.0 s 11.6 s 62.0 s
0.3 min 2.3 min 12.4 s 5.0 min 5.8 rnin
3.8 min 3.8 min 5.1 min
Energy of gamma MeV (frequency) 6.13 (76) 7.10 (6) 0.2 (96) 1.36 (54) 6.13 (76) 3.0 1.64 (100) 0.98 (15) 0.58 (15) 0.40 (15) 1.61 1.78 (100) 1.78 (100) 2.1 (25) 4.0 (0.2) 3.1 (10) 0.32 (96) 0.93 (4) 0.61 (1) 1.44 (100) 1.44 (100) 1.044 (9)
TABLE 9 Main Capture Gamma Rays Energy of K, Na, Mg, and CI in the Low-Energy Range (keV) and their Relative Intensities
VII. OTHER USES OF ISOTOPIC NEUTRON SOURCE ACTIVATION ANALYSIS A system was set up at Ben-Gurion Uni~ersity,~ to measure the elemental content of the Dead-Sea Products. The raw material was carnalite having the following composition: KC1, 23.9%; NaCl, 3.5%, CaCl,, 0.5%; MgCI, 32.7%, and H20, 39.3%. The final product composition is: KCl, 98.9%; NaCl, 0.4%; CaCl,, 0.03%; MgCl,, 0.3%, and H20, 0.15% (the values above are related to particular samples). The neutron source was -5 Ci 252Cf and the gamma detectors were 45 cc coaxial Ge(Li) or a 3 in. x 3 in. NaI. Samples of 1 kg were investigated. Irradiation and measurement took place in two different layouts: first, the neutron source, the sample and the gamma detector were all in line. In this case, a thick layer (8 cm) of lead was placed between the source and the sample. In the second layout, the neutron source and the gamma detector were at right angles with the sample at the vertex. The detector was shielded from direct neutrons and gamma rays from the source. The expected gamma rays in the low energy range are found in Table 9. The gamma
-
274
Activation Analysis INTENSITY
HGURE 38. Prompt gamma spectrum (n,y) reaction in carnalite low energy range. (From Shani, G . , Elemental Analysis of Dead-Sea Products Using 252CfPrompt Gamma Measurement, report to Dead Sea Works, 1986. With permission.)
spectra measured in the low energy range with NaI and Ge(Li) detectors are shown in Figures 38 and 39. Peaks related to the investigated elements are seen along with many background peaks (from the source and construction materials). The C1 is quite dominant. Spectra in the high energy range (1 to 8 M a ) are shown in Figures 40 and 41; less peaks are seen and the identification of elements is easier. Particular attention was paid to the detection of NaCl (i.e., Na), the most dominant peak in prompt gamma detection of Na is that of 477 keV. Unfortunately, when NaI scintillator is used, this peak cannot be separated from the 51 1-keV line. We have found that another peak appears due to inelastic scattering of neutrons, at 440 key. This peak is separated and quite easy to measure. It is seen in Figure 42. A thermal neutron activation method has been used by Borsaru and EislerZ5 to determine alumina grades in both dried and undried bulk bauxite samples. The accuracy for bauxite containing 48 to 62% alumina was 0.45% A120,. The essential parameters for accurate alumina determinations were the count rates of both the 1.78-MeV 28A1y-rays and the thermal neutrons. The analysis method was based on obtaining a measure of the count rates of the neutrons that produce "A1 (2.3 min half-life) in the bulk sample via the 27Al(n,y) 28A1reaction, and of the 1.78-MeV y-rays emitted by that radioisotope. These neutrons were produced by a 36-pg 252Cfsource located at the bottom of a hole drilled into a polyethylene block that was surrounded by paraffin bricks. After irradiation (6 min), the samples were transferred within 15 s for counting (5 min) by a 127 X 127 rnrn NaI(T1) y-ray detector that was some 7 m away from the source.
Volume 11
275
NUMBER OF COUNTS
FIGURE 39. Prompt gamma spectrum from carmelite - log scale. (From Shani, G . , Elemental Analysis of Dead-Sea Products Using 252CfPrompt Gamma Measurements, report to Dead Sea Works, 1986. With permission.)
The grades of alumina were predicted from the neutron and y-ray counts and from the sample weights by the technique of stepwise multiple linear regression. The linear regression model, which used the constant coefficients, A, B, C and D had the form
where y represents the number of 1.78-MeV y-rays recorded during the 5-min counting period (in thousands), w is the weight (in kilograms) of the bulk bauxite and sample box together, n is the number of neutrons recorded during the same counting period (in thousands), and E is the difference between the predicted grade (y) and the chemically assayed grade (Y). The radioisotope 2SA1is also produced by reactions other than 27Al (n,y) and can, therefore, interfere with measurements based on that reaction. The 28Si (n,p) 2%1 reaction could lead to interference. This is a fast neutron reaction with an energy threshold of 3.8 MeV. The magnitude of the interference depends inversely on the degree of thermalization in the neutron flux incident on the sample. Another fast neutron reaction that can lead to interference is 31P(n,a) 28A1.However, because of the low concentration of phosphorous in the bauxite deposit sampled (<0.07%), and because of the low cross-section of this reaction (1.5 mb at 5 MeV), the interference from phosphorus was considered to be insignificant.
276
Activation Analysis
INTENSITY
NGURE 40. Prompt gamma spectrum from (n,y) reaction in carnalite - high energy range. Sea Works, 1986. (From Shani, G . , Elemental Analysis of DeadSea Products Using 252CfPrompt Gamma Measurement, report to Dead Sea Works, 1986. With permission.)
Yet another possible source of interference is the formation of 56Mn via the reactions "Mn (n,y) 56Mnand 56Fe(n,p) 56Mn. This radioisotope (2.58 h half-life) emits y-rays with energies of 0.847, 1.811, and 2.113 MeV. The most important source of interference is the 1.811-MeV y-radiation, which cannot be resolved by NaI(T1) detectors from 1.78-MeV yradiation. Brain concentration of mercury as low as 100 ppm were determined by Al-Hiti et a1.26 by detecting the 368-keV prompt y-radiation emitted during the '99Hg (n,y) 200Hg reaction at doses of 120 rnrem. The assay was accurate to within 2 3.2%. lg9Hgisotopic concentration is 16.84%; the reaction cross-section is 2500 b for thermal neutrons and the emitted y-ray energy is 368 keV. The subjects were irradiated by fast neutrons from two identical 24'Am-Be neutron sources, each of approximately 2.2 X lo7 neutrons per second. A transportable system for the determination of phosphorus in sheep bone by in vivo neutron activation analysis was discussed by Whineray et al.27 With two 10-Ci isotopic neutron sources (241Am/Beor 238pUIBe)and a single 7.5 X 7.5 cm NaI(T1) detector, serial changes in leg bone phosphorus were determined with a precision of 13% in 15 min of experimental time. This precision could be reduced to 5% by incorporating two large detectors into the system. The neutron sources were stored in a boron-doped wax-filled drum about 20 m away from the sheep. The detector was also stored about 20 m away from the sheep, in the opposite direction to the neutron sources. To further decrease the possibility of activating the detector
Volume 11
277
INTENSITY
-5439ke' kev
F'IGURE 41. Prompt gamma spectrum from (n,y) reaction in camalite - high energy range, Na I (TI)detector. (From Shani, G., Elemental Analysis of DeadSea Products Using 25ZCf Prompt Gamma Measurement, report to Dead Sea Works, 1986. With Permission.)
crystal, the detector was placed behind a wax wall, 15 cm thick, with a 2-cm lining of Li2C0,. After a 300-s activation, the sources were returned to the storage drum. The detector was positioned within the lead shielding and the y-spectrum of the induced activity collected for a period of 300 s starting 65 s after the irradiation ceased. The activity was observed by the detection of the 1.78-MeV y-ray in "Si.
28A1activity also may be produced by thermal neutron capture in 27Alwhich, however, is not present in sufficient quantity in sheep to be a problem. A possible source of interference is the 1.64-MeV y-ray from 38Cl (half-life 38 min) from neutron capture in 37C1. The detection limits in a tissue-equivalent phantom for elements of clinical interest: N, 0,Na, P, C1, Ca, and Cd were investigated by Matthews and S p y r o ~ When . ~ ~ the total time of an experiment is greater than about five half-lives of the radioactive isotope being measured, then the technique of cyclic activation is more sensitive than the conventional delay technique which makes use of only one period of irradiation followed by one period of counting. The degree of uniformity of activating flux which could be obtained in a bulk matrix would be better with neutrons of high energy. (a,n) sources have the disadvantage that their y-ray dose rates are much higher than
278
Activation AnalySis
A
CHANNEL
NUMBER
FIGURE 42. Prompt gamma spectrum from elastic and inelastic scattering of neutrons from Na.
those from 252Cfsources; the y-ray dose rate from an 241Am-Besource is about ten times that from a 252Cfsource for the same neutron emission rate. 238Pu-Beneutron sources have less than half the y-ray dose rate of "'Am-Be sources. A 5-Ci 241Am-Besource with a total neutron emission rate of 1.1 X lo7 ns-' was chosen by Matthews and Spyrou. Cyclic activation analysis technique differs from conventional analysis where a single irradiate-wait-count sequence is employed in that a number of successive sequences are performed and the detector response per cycle is accumulated in order to enhance the signalto-noise ratio for the isotope of interest. Givens et al.29 derived an expression for the cumulative detector response and considered the optimization of timing parameters: for the n-th counting period
thus the cummulative detector response for all n periods is
+
where Dl = the detector response for conventional activation; T = the cycle time = ti f + t, + f and ti, f , and tc have the same meaning as for conventional activation; t, = transfer time, i.e., time elapsed from the end of counting period to the start of the irradiation period; n = the number of cycles = (total experiment tirne)/T. For a given total experiment time (t, = nT), the maximum cumulative detector response occurs when ti = tc with transfer times equal to zero. The detection limits obtained using a Ge(Li) detector (11% efficiency relative to a 7.5 X 7.5 cm NaI(T1) for the 1.332-MeV y-ray from T o ) for certain elements of clinical
Volume 11
279
TABLE 10 Detection Limits Determined from Measurement of Prompt y-Rays (ti = 1800 s)2" Element
?-Ray energy (MeV)
Detection limit ( P P ~
interest, homogeneously distributed in solution within the phantom, is shown in Table 10. The detection limit is defined by the relationship: signal 2 2 Vbackgound. The oxygen content of the tissue equivalent phantom was measured using two different reactions2' both yielding short-lived radioactive products. 1 6 0 makes up 99.8% of stable oxygen and the threshold for the 1 6 0 (n,p) I6N reaction is approximately 10 MeV, I6Ndecays with a half-life of 7s emitting y-rays of 5.619 MeV and 6.130 MeV. A 7.5 X 7.5 cm NaI(T1) detector was used to detect these high energy y-rays. A Ge(Li) detector was used to detect the 0.197-MeV y-rays from I9O (t,,, = 29 s) produced by the thermal neutron capture reaction ''0 ( n , ~ 1) 9 0 on ''0 (isotopic abundance = 0.204%). Cyclic activation method determining short half-lives was used by 0zek et to measure short halflife using Equation 22. For large n, (1 - e-"'3 approaches unity and the variation of D, with n becomes linear so that:
where a is the slope and b is the intercept. Then, from equation (23)
A 300-mCi Ra-Be neutron source, embedded in polyethylene, was employed to irradiate a 0.35-g hafnium sample. The sample, encapsulated in a polyethylene irradiation tube, was transferred between irradiation and counting positions by a fast pneumatic system controlled by preset clocks. The 0.217-MeV photopeak resulting from the I7'Hf (n,y) '79mHfreaction was detected using a 7.5 x 7.5 cm NaI(T1) crystal. A thermal-neutron irradiation technique that uses a 252Cfneutron source has been developed by Borsaru et al.,O for the simultaneous determination of iron and aluminum (expressed as A120,) in iron ore on a conveyor belt. Although the speed of the conveyor has no direct effect on the iron measurements, it must not exceed about 3 mlmin if good accuracy for alumina is required. Accuracies of 0.6% I% and 0.1% A120, were obtained. Fast-neutron activation analysis using "'Am-Be neutron sources has also been adapted to bulk analysis. Successful applications include the determination of silicon (expressed as SiO,) in iron ores with an accuracy of 0.15% SiO,, and the simultaneous determination of alumina and silica in bauxites with accuracies of 0.7% A1,0, and 0.3% SiO,. A combination of fast- and thermal-neutron activation has been applied to the determination of soil in shredded sugar cane with an accuracy of 0.1% soil.
280
Activation Analysis
In the case of alumina determinations, use of the thermal-neutron reaction 27Al(n,y) 2sAl gives the best accuracy. The P-decay of the radioisotope 28A1,which has a half-life of 2.3 min, is followed by the emission of 1.78-MeV y-radiation. Samples were irradiated by a 252Cfneutron source, which was located in a polyethylene neutron "howitzer" to obtain a well-thermalized neutron flux for the above reaction. This source is more suitable for exciting aluminum because its average neutron energy is lower than that of (a,n) neutron sources. Consequently, interference from the fast-neutron reaction 28Si (n,p) 28A1, which occurs at neutron energies above about 4 MeV, is negligible. Other reactions that could interfere with the alumina measurement are the fast-neutron reaction 56Fe(n,p) 56Mn and the thermal-neutron reaction 55Mn(n,y) 56Mn. Both produce the radioisotope 56Mn,which has a half-life of 2.58 h and emits y-radiation at 0.847, 1.81, and 2.11 MeV during its decay. The 1.81-MeV y-radiation is potentially the most serious because the resolution of NaI(T1) detectors is insufficient to resolve it from the 28A1yradiation at 1.78 MeV. The interference from the 56Fe (n,p) 56Mn reaction is negligible because of its small cross-section for thermalized neutrons and the short irradiation time of 6 min. In the irradiation facility which was designed to favor the fast-neutron reaction 28Si(n,p) 28A1,samples of 25 to 30 kg are irradiated with a 241Am-Befast-neutron source enclosed in a cadmium cylinder to remove any thermal neutrons emitted by the source. The method for determining iron used a NaI(T1) y-ray detector to monitor the characteristic prompt y-rays (7.64 MeV) arising from the thermal-neutron capture reaction 56Fe (n,y) 57Fe.A second NaI(T1) detector, located downstream from the first, is used to monitor the 1.78-MeV radiation arising from the 27Al(n,y) 28A1reaction for determining alumina.30 A 3He thermal-neutron detector was located underneath the conveyor belt to measure the thermal-neutron flux. The fast-neutron method employed a 20 Ci 241Am-Beneutron source irradiating 3-kg bauxite samples resulting in the reactions 27Al(n,p) 27Mgand 28Si(n,p) 28A1.The alumina concentration was determined directly from measurements of sample weight and the 0.844MeV y-radiation arising from the decay of 27Mg (half-life 9.5 min). Corrections were necessary for the Compton tail of the 28A1peak at 1.78 MeV, which extends into the counting window around the 0.844-MeV peak. The main thermal-neutron reactions that occur in manganese ore are 55Mn(n,y) 56Mn and27A1(n,y) 28A1. While manganese can be determined directly from the 2.11-MeV yradiation arising from 56Mnand the thermal-neutron flux, the measurement of alumina (1.78 MeV) is complicated by the presence of 56Mnradiation at 1.81 MeV.
VIII. ISOTOPIC NEUTRON SOURCE ACTIVATION ANALYSIS IN
MEDICINE In vivo neutron activation has opened a new era of research on the elemental composition of the human body. Both partial body and total body neutron activation analysis are commonly used. Portions of the body selected for partial body activation analysis are the hand, the arm, and the trunk. Such measurement may be particularly useful for studying patients with diseases that affect various parts of the skeleton differently. Comparison of the technique has to take into account a variety of factors: dose to the patient, cost, reliability, availablity of source, nature and cost of complementary facilities required, and the degree of expertise needed by the operating personnel. Neutron activation studies of body calcium have provided data useful for the diagnosis and management of a variety of metabolic disorders. MeaPGNAA surement of sodium, chlorine, and nitrogen also appear to be useful ~linically.~' can be used for the in vivo determination of cadmium in liver and kidney. Total body nitrogen and potassium measurements serve as indices of protein and muscle mass content, and hence are useful in assessing the roles of diet and nutrition in these body components.
Volume 11
281
CHANNELS ( 3 3 keV/CHANNEL) FIGURE 43. Delayed gamma spectrum from activation of a human subject. (From Cohn, S . H . , At. Energy Rev., 18, 599, 1980. With permission.)
A typical gamma spectra of the same human subject, following exposure of the subject to 238PuBe neutron source is shown in Figure 43.'' The sensitivity of neutron activation analysis is a function of several factors: average flux density produced by the neutron source, nuclear parameters of the target elements, detection efficiency, background interference from the presence of "noise" in the detection system, and interference from "competing" reactions. Generally, fast neutrons are used for irradiation because of the poor penetration of thermal neutrons in the human body. The fast neutrons are sometimes thermalized by the use of moderators and also by the body (elastic scattering with body hydrogen). An a , n neutron source consisting of a bank of 14 encapsulated 50-Ci sources of 238Pu,Be (E -4.2 MeV) positioned above and below the length of the patient was used for total body activation analysis.32 An array of 12 238Pu,Besources symmetrically arranged above and below the subject has been successfully employed for irradiation of the torso.33The neutron emission of a , n sources (E -4.2 MeV) is adequate for homogeneous irradiation of the superficial bones. These sources (particularly 252Cf),are relatively inexpensive and do not require the maintenance and expertise for operation necessary for sources such as the cyclotron. The lower energy neutrons (E -2.3 MeV) emitted by 252Cfare thermalized as they pass through the superficial soft tissues. The energy is then optimal for activation of calcium and s0d;J.n A thermal neutron flux is required for the measurement of 49Ca;a fast-neutron flux is required for the measurement of phosphorus. The body element studied most intensively is calcium. The successful application of neutron activation analysis to the measurement of partial or total body calcium content (absolute levels) depends essentially on meeting two requirements: a uniform thermal-neutron distribution must be obtained in order to expose the target element in the body to a standardized neutron fluence; and a quantitative measure of the induced 49Caactivity in the body must be obtained with a detection system that has an invariant counting sensitivity. The uniformity of the neutron flux density within the body is influenced by the energy spectrum of the neutrons emitted by the source, the construction of the irradiation facility with respect to scattering and thermalization of neutrons, the thickness of premoderator used to generate thermal neutrons at the body surface and the size and shape of the various regions of the body.
282
Activation Analysis
For the measurement of calcium, which is concentrated almost entirely in the skeleton, the problem of delivering uniform fluence to the target is more difficult than that experienced with homogeneously distributed elements, such as N, Na, and C1. Uniformity of the flux density declines with decreasing incident neutron energy. At the low end of the scale is 252Cf,with an average energy of 2.3 MeV. It is used with the forearm, where the uniformity is adequate but is not suitable for irradiation of the total body. Two parameters are considered in the selection and application of moderators used to enhance the uniformity of the flux density: thickness of the moderator and its position with respect to the body. A symmetrical arrangement of 14 50-Ci sources of 238PuBewas employed for irradiation by the Brookhaven A polyethylene moderator, 1.9 cm in thickness was fitted by sections as closely as possible to the body. At the Toronto facility, 12 238PuBe sources were used, premoderated by a wooden board, 4 cm in thickness, on which the patient rested during the i r r a d i a t i ~ n . ~ ~ The use of the lower energy 4.2-MeV neutrons from 238PuBesources in place of 14MeV neutrons allows a reduction of dose to the patient for the same Ca activation because of lower ratio of dose to number of incident neutrons; higher ratio of thermal to incident neutrons, and higher ratio of thermal to fast neutron flux density resulting from use of the ' 'broad-beam" source. An in vivo neutron activation technique of the measurement of total body Ca based on the T a (n,a) 37Arreaction was developed at the University of W a ~ h i n g t o n , the ~ ~ .Uni~~ versity of Bim~ingham,~' and at the Sloan-Kettering I n ~ t i t u t eThe . ~ ~air containing the induced 37Aris exhaled by the subject and collected and measured in vitro. The reaction involves ""Ca, which is considerably more abundant than the 48Ca used in the standard activation technique, thus the dose to the patient can be reduced; it is
Volume I1
283
FIGURE 44. Irradiation geometry for activation of a hand. (From Cohn, S . H . , At. Energy Rev., 18, 599, 1980. With permission.)
McLellan et al." reported a sensitivity of 0.5 mglkg in a liver-sized phantom with a neutron dose of 0.4 rad. Harvey et al.45applied the method to the in vivo detection of Cd in human beings, and studied four subjects with suspected Cd poisoning. The patients all had very high liver Cd levels (between 35 and 200 mgkg), compared with -1 to 2 mglkg for nonexposed subjects. Harvey et al.46 described the performance of a portable system utilizing a 10-Ci238pUBeneutron source, designed for screening industrial workers exposed to cadmium. A clinical 252Cfneutron activation facility was also designed and used for in vivo Cd measurement by a group in Swansea, Wales4' The detection limit was 5 mg of Cd for a dose of 0.7 rem. A sensitive and highly developed system for the measurement of in vivo Cd was built by Vartsky et al.48 It employed a 238hBeneutron source in a highly shielded collimator arrangement. The neutron source for this technique was 85 Ci 238PuBehoused in a collimator made of epoxy resin heavily doped with Li,CO, and 6LiF. It was designed to provide a rectangular beam, 13 x 20 cm, at the level of the bed, situated 50 cm above the source. The fast-neutron flux density at the level of the bed was calculated to be 7.2 X lo3 n c m - ~ S. - l .48 The gamma-ray detection system consists of two Ge(Li) detectors, each having
-
an efficiency of 25%. Total body measurement of nitrogen provides a quantitative estimate of muscle mass. It is of value in the assessment of patients with conditions such as the malabsorption syndrome associated with muscle wasting. The n,2n reaction has a high neutron energy threshold (1 1.3
284
Activation Analysis
MeV). The product13N decays by positron emission to 13Cwith a 10-min half-life; the only measurable radiation is that of the 51 1-keV annihilation quanta. It is necessary to use fast neutrons for the irradiation of an extended object such as the human body, because of the poor penetration of the body by slow neutrons. The total energy available from the capture of a thermal neutron is 10.83 MeV. Approximately 15% of the de-excitations take place directly to the ground state of I5N. The thermal neutron capture cross-section of 14Nis relatively small (0.08 b). The technique employing the thermal neutron reaction is superior in many aspects to the n,2n technique. A more uniform neutron flux density is produced by the reactions, and consequently there is minimal interference from other reactions. Mernagh et a1.49reported measurement of partial body nitrogen-utilizing 238PuBeneutron sources. Neutrons were provided by four collimated 5-Ci 238Pu,Besources, arranged to give a bilateral irradiation of the subject. The 10.83-MeV gamma rays were detected by two heavily shielded 12.7 X 10.2 cm NaI(T1) detectors. In Brookhaven, prompt gamma neutron activation technique was used for measurement of total body nitrogen. The neutron source, (85 Ci 238PuBe)was designed to provide a rectangular beam 13 x 60 cm at the level of the bed, 50 cm above the source. The total body was scanned by moving the bed over the beam.3' Absolute values of total body nitrogen were determined by using body hydrogen as an internal standard. The lower legs of a phantom were irradiated by Agard50 for 10 min with 4 238PuBe neutron sources immersed in water. The 3.1-MeV 49Ca gamma rays from the legs were counted by two 8 in. dia. by 4 in. NaI(T1) scintillation detectors in the whole body counter at the Toronto General Hospital. The activity was such that there was a statistical error of 2%. The reproducibility of the results was determined from a series of 10 irradiations and the standard deviation was found to be + 2.3%. The expected interference from the 3.1-MeV peak in 37Sproduced by the 37C1(n,p) 37S reaction was estimated to be about 2% and an experimental assessment of this interference showed that the contribution made by 37Sto the 49Capeak was about 4%. The only reaction producing a measurable radioactivity as a result of neutron bombardment of calcium for a limited tie is the 48Ca (n,y) 49Careaction. This is a thermal-neutron reaction for which the cross-section is 1.1 b. Since the isotopic abundance of 48Cain natural calcium is only 0.18%, however, there are only about 220 g of 48Ca in a human body containing 1000 to 1200 g of calcium. 49Cadecays with a half-life of 8.9 min emitting beta rays and then gamma rays of 3.09 MeV. The use of fast neutrons of energies greater than 4.0 MeV introduces a problem. The chlorine in the body contributes another gamma ray of energy 3.1 MeV through the reaction 37C1(n,p) 37S. This gamma ray is not separable from the 49Cagamma ray by scintillation detectors commonly used in whole body counters. There are three possible methods of dealing with this problem: using neutrons of energies less than 4.0 MeV, the threshold for the 37C1(n,p) 37Sreaction; using a detector capable of rsolving the 49Caand 37Speaks; and minimizing the amount of 37Sproduced by using neutrons whose energies are as close to 4.0 MeV as possible and correcting for any interference where necessary. The spectrum obtained with the human legs, after subtracting the background, is shown in Figure 45. The additional 24Naand 38Cl peaks seen in this spectrum over the phantom spectrum is due to the sodium and chlorine present in the soft tissue which was absent in the phantom. The 28A1, 1.78-MeV peak of 28A1is produced by the reaction 31P(n,a) "A1 which has a threshold of 1.9 MeV. The half-life of "A1 is 2.3 min. The net counts obtained in the 49Capeak were 492 + 27/10 min. Vartsky and Thomas5' used Cd sheets to improve thermal neutron uniformity in a phantom by 16%. The introduction of the Cd sheet improved the uniformity of the thermal flux in the body, but it also reduced the amount of induced activity, with comparatively little change in the radiation dose.
Volume 11
I
1.0
I
I
20
30
285
ENERGY (MeV) FIGURE 45. Gamma spectrum of activated human legs. (From Agard, E. T . , In Vivo Neutron Activation Analysis, Ph.D. thesis, University of Toronto, Toronto. Canada, 1970. With permission.)
1 - 1
-
Neutron Reflector Inspected Object
Premoderator -Neutron Source
FIGURE 46. Cross-section of the exit port of irradiator.52
A facility for regional in vivo neutron activation analysis of skeletal calcium was described by Evans et al.52In the regional or partial body techniques, selected areas are irradiated and the induced 49Cais measured. The facility employed a collimated beam of neutrons obtained from a 3-mg 252Cfsource. Within the storage shield, the source was surrounded by 7.5 cm of lead to shield the 252Cffission gamma rays. Surrounding the lead were blocks of borated (1.0%)water-extended polyester (WEP) which provided a minimum shielding thickness of - 60 cm. The neutron exposures were measured with a BF, counter calibrated with a 252Cf source and the gamma ray exposures were measured with an ionization chamber. The exit port of the irradiator was 20 x 30 cm. Figure 46 shows the irradiator in cross-section. The amount of premoderator could be varied in 2.5-crn increments. With this arrangement,
286
Activation Analysis BISMUTH LEAD
lOcm u
l RON POLYETHYLENE (Pb,B doped)
LIVER,
KIDNEYS
' 3 8 ~ ~ - NEUTRON ~e SOURCE RGURE 47. Cross-section of in vivo measurement facility. (From Morgan, W . D . , Phys. Med. Biol., 26, 413, 1981. With permission.)
thermal neutron uniformity was obtained. The counting facility was located in a room adjacent to the irradiation room including two opposing 29 cm diameter by 10 cm thick NaI(T1) detectors. A plexiglas phantom of a human foot was used to study positional variation of ' . human the thermal neutron flux. The mean thermal flux was (5.4 + 0.7) n ~ m - ~ s - A hand phantom was constructed of paraffin and 23 g of CaCO, to simulate bone. A comparison was made by Morgan53of the isotopic neutron sources 252Cfand 238PuBe for partial-body in vivo neutron activation analysis. Depth distributions of thermal neutron fluences in a water phantom are very similar for the two sources. The peak depth occurs at 5 cm. This value is approximately 2 cm less than the values obtained with uncollimated neutrons produced in broad-beam irradiations. The 252Cfneutrons were found to have an advantage of approximately 1.4 over the '"PuBe source, with respect to the fluence-to-dose ratio. The use of 252Cfsource minimizes the on-line fast-neutron damage in Ge(Li) semiconductor detectors, and it is subject to much less stringent transport regulations than 238PuBe. A schematic cross-section view of the Brookhaven facility is shown in Figure 47. The thermal neutron distributions were determined in a water tank with a 6LiF:ZnS scintillator. The results are shown in Figure 48. The distributions of the 238PuBeneutrons and that of 252Cfneutrons indicate a little difference between the two sources. In prompt gamma neutron activation analysis, the yield (I) of photons emitted per second by a specific nuclear transition is given by
.
+
where n = number of target atoms, = neutron fluence, u = reaction cross-section, and = nuclear transition probability for a given photon.
E
287
Volume I1
Depth In water (cm) FIGURE 48. Thermal fluence depth distribution in water phantom for two neutron sources, normalized to dose to the phantom. (From Morgan, W . D., Phys. Med. Biol., 26, 413, 1981. With permission.)
For in vivo analysis, a constraint is imposed by the maximum dose that may be delivered to the subject. It is, therefore, of fundamental importance to achieve the maximum neutron fluence, 4, per unit of dose D. Figure 48 shows the thermal-neutron fluence distributions for the two sources expressed as counts per rem of radiation incident on the phantom. It can be seen that the 252Cfneutron spectrum generates nearly 40% more thermal fluence per incident dose than the 238pU Be spectrum.53The sensitivity (in couts per g) of in vivo analyses is directly proportional to the neutron fluence per unit dose. The detectability of an element also depends on the background level above which the signal is observed. The detection limit is usually defined in terms of some multiple of the standard deviation (SD) of the background counts. The higher fluence has a direct benefit on the detection limit of an element. The major disadvantage of 25ZCfis its short half-life (2.65 y). Even so, over a 10-year period, and for a neutron output of at least 2 x 10' ns-', 252Cfis more economical than an (ol,n) source.52 The difference in peak depth might be due, in part, to the predominantly small-angle scattering of fast neutrons by hydrogen nuclei which tends to increase the spread of thermal fluence with depth.53 A system was designed by Krauel et a1.54for the in vivo measurement of the cadmium content of the liver or kidneys. In comparison with the major body elements, "'Cd has a large radiative neutron capture cross-section. The radiative emission results in a cascade of y-rays with the strongest intensity being a transition of energy 559 keV. The source of neutrons was 10 Ci 238PuBeisotopic source, which emitted approximately 2 x lo7 n s-'. The source was mounted on a bismuth cylinder (8 cm diameter x 9 cm thick) and contained within a paraffin block heavily doped with Li2C03.The block had an aperture which results in a collimated beam of fast neutrons approximately 9 cm in diameter. The bismuth cylinder provided an additional 20% of useful beam in the aperture, by reflecting without significant loss in energy a substantial number of the neutrons originally emitted in the backward direction. Figure 49 shows the distribution of slow neutron flux as measured by activating bare indium foils in a trunk-like container filled with water. The flux would diminish to 36% of maximum at the extremities of a normal adult liver. The composite efficiency defined as number of y-rays detected per unit mass Cd per unit dose, shown in Figure 50 indicate that at the extremity of the liver furthermost from the detector the efficiency for detection of Cd
.
288
Activation Analysis
DISPLACEMENT FROM CENTRAL AXISlcm) X-OR Y- DIRECTION
DEPTH. IN TISSUE ( c m ) 2- DIRECTION
FIGURE 49. Relative slow neutron flux distribution. (Reprinted with permission from Int. J. Appl. Radiat. Isot., 31, Kravel, J. B. et al., Copyright 1980, Pergamon Journals, Ltd.)
2 04I
2 4 6 8 1012 Depth in Tissue (cm) z-direction
FIGURE 50. Relative detection efficiency distribution. (Reprinted with permission from Int. J . Appl. Radiat. Isot., 31, Kravel, J. B. et al., Copyright 1980, Pergamon Journals, Ltd.)
is only 10% of the maximum efficiency. Varying the size of the liver phantom from 1250 to 1900 cm3 had the effect of varying the apparent concentration by 20%. An instrument was described by Morgan et al." for the measurement of liver and kidney cadmium by in vivo neutron activation analysis. Accurate organ localization by ultrasound is important, otherwise errors of 40 and 25% in individual and group kidney measurements, respectively, can occur. The detection limit (2 SD of the background) was 2.2 mg cadmium in the kidney and 1.5 pg g-' (wet weight) in the liver for a local dose of 4.7 mSv. Sodium kinetics were studied by Cohen-Boulakia et al.56in the hands of 14 subjects by local in vivo neutron activation analysis. Hands were irradiated with 252Cfsources giving absorbed doses of 8 cGy. The variation in 24Naradioactivity was plotted against time, and each curve fitted to a function that was the sum of two exponentials. Two 200-pg sources of *'*Cf were fitted equidistantly on a ring at the center of a 1-m3paraffin cube surrounded by a 2-mm cadmium envelope and a 5-cm lead shielding. To restrict irradiation, as far as possible, to the hand, the subject's forearm was protected with a cadmium bracelet (Figure 44). The y-dose rate may be estimated to be 0.2 cGy min-' and the mean neutron dose rate to be 0.28 cGy min-l. One minute after the irradiation was over, the activity induced in the subjects hand was measured with two low-background sodium iodide scintillators (12.7 X 12.7 cm), placed in a 10-cm low-activity lead shield. The total y-activity spectrum was
Volume 11
Channel
289
Channel
FIGURE 51. Delayed gamma spectrum of a hand irradiated for time Tc, after delay Td. (From Cohen-Boulakia, F. et al., Phys. Med. Biol.,26, 857, 1981. With permission.)
recorded between 1.10 and 3.50 MeV. The total absorption peaks corresponding to 24Na, = 38 min) can be easily identified in Figure 51. After 39Ca(T,,, = 8.8 min) and 38Cl a 3-h decay period, almost nothing but the 24Napeaks are left. A prompt gamma in vivo neutron activation analysis facility for measurement of total body nitrogen was described by Beddoe et a1.57The quantitative assessment of the nutritionally important components of body composition (protein, water, and fat) provides a basic tool for research into the metabolic and nutritional problems of critically ill patients requiring intensive care. The construction and calibration of a facility that provides bilateral irradiation of patients with neutrons from two 20 GBq 238PuBesources was described. Patients were scanned over a 36-min period, and composite prompt y-spectra are collected from two 5 in. X 4 in. NaI(T1) detectors, placed on either side of the patient, using a conventional spectroscopy analysis system. A ratio of nitrogen to hydrogen counts corrected for body habitus and background was derived from which protein can be estimated. This technique, combined with the measurement of water by tritium dilution, enabled protein, water, and fat to be estimated with precisions of 4.2, 1.5, and 6.3%, respectively, for a total dose equivalent (neutrons and tritium betas) of less than 0.5 mSv per examination. There are two neutron activation techniques which have been utilized for the measurement of total body nitrogen (TBN) in human subjects. The first method to be developed was a "delayed gamma" method depending on the fast neutron reaction, I4N (n,2n) I3N; 13N decays by P+ emission to 13C with a half-life of 10 min. Nitrogen assessment depends on measuring the 0.51 1-MeV annihilation gammas by whole body or shadow-shield counters. The second technique is a "prompt gamma" technique which utilizes the 14N ( n , ~ )15N* reaction, the 15N* having a lifetime of the order of 10-15s before decaying to its ground state. About 15% of the deexcitations occur with the emission of 10.8-MeV y-rays. A prompt gamma technique utilizing PuBe neutron sources was built at Auckland, as described in Figure 52. Vartsky et al.58 found that the ratio of nitrogen to hydrogen counts was much less dependent on body habitus than nitrogen counts alone. This is because both the nitrogen and hydrogen signals are dependent on thermal neutron capture, with the capture crosssections of the two elements varying in the same manner with neutron velocity. The actual habitus corrections are largely due to the different attenuation coefficients for 10.8- and 2.22-MeV gamma rays in human tissue. Using body hydrogen as an internal standard, the mass of nitrogen (MN)in a subject is given by
290
Activation Analysis
Schematic diagram of prompt gamma facility: a, Pu-Be sources; b, aluminum source transfer tubes; c, bismuth reflector; d, lead shielding; e, aluminum tank (with re-entrant collimator) containing water, boric acid, and borax; f, detectors (without housing); g , patient couch assembly, h, concrete base; i, LiF powder; j, water, boric acid, and borax; k, paraffin wax shielding. (From Beddoe, A. H. et al., Phys. Med. Biol., 29, 371, 1984. With permission.) FIGURE 52.
where M, is the total body mass of hydrogen, q is a conversion factor determined from an anthropomorphic phantom containing known masses of nitrogen and hydrogen, and X,/X, is the nitrogen hydrogen counts ratio corrected for background. M, is assumed to be a fixed percentage of body masss9or can be determined from fat and body mass5' or can be estimated a.s'For a very ill patient, from a combination of total body water (TBW), fat, and body m@ a more elaborate method is needed." Total body carbon via the inelastic 12C (n,nry) 12C fast-neutron reaction was also measured and provides another measure of the total fat content of the body. A technique has been developed by Glaros et a1.6' for in vivo determination of lithium content in the head (and potentially in the whole body and in selected organs) of patients undergoing lithium therapy. It was based on the measurement of tritium induced by the 6Li (n,ol)T nuclear reaction after neutron irradiation of the body. The fraction of tritium exhaled in the expired air in the form of HT was collected, separated from the other gases, and counted in a high-sensitivity beta counter. The feasibility of the technique was demonstrated by measurements of lithium in the head of a sheep and in the whole body of rats, following the administration of 6LiCl (enriched 6Li isotope, 95.46% abundancy). The precision of the technique was acceptable for clinical applications based on a maximum propagated error of 8.4%. The snesitivity was 1 count per day (from T activity) per 10 mSv (total dose) and 1 pg of 6Li. Following the 6Li(n,a)T reaction, the two nuclei 4He(2.06 MeV) and 'H(2.74 MeV) are propelled in almost opposite directions with ranges (in water) of 6 and 45 Fm, respectively. In water, the T particles form mainly HT and HTO in the ratio of 0.10 + 0.01, with a higher HT yield in organic compounds. Data on H, clearance from rat brains and cat brains suggest a biological half-life of less than 4 min.62 Studies on the clearance of inert gases from human bone have shown that there are at least two exponential release rates of "Ar produced from calcium in bone.63 Some 30% of the Ar formed in the bone remains trapped 20 h after irradiation. However, the HT produced is not trapped and can be collected within the first 20 rnin after the start of irradiation.
Volume 11
291
Neutron Source
Am-Be(0.l CI 1
FIGURE 53. Neutron-gamma separation by NE 213 liquid scintillator and a pulse shape discrimination system.
IX. THE USE OF ORGANIC LIQUID SCINTILLATOR Usually gamma spectroscopy is done with NaI(T1) crystal scintillators or with Ge(Li) solid-state detectors. When prompt gamma-ray spectrum is measured, the detector is placed in the vicinity of the neutron source. Such a situation causes sometimes severe difficulty because of neutron interactions with the detector; either (n,y) reactions with the detector elements or radiation damage (more severe in solid-state detectors). These problems can be avoided by using organic scintillator detectors which are capable of distinction between gamma radiation detection and neutron detection. The organic scintillators have a fast response and do not suffer radiation damage. Their interaction with neutrons is by inelastic scattering (proton recoil) with the scintillator hydrogen and with gamma rays by Compton scattering. In both cases, the resultant light puls is proportional to the incoming radiation energy. To obtain the true radiation energy spectrum, the distribution of the scintillator light pulses has to be unfolded. This is done with proper computer codes which unfold the measured data according to a given response matrix of the scintillator. One such code is FORIST.' Th'e most common organic scintillator used for such cases is known by its commercial designation NE213. The NE213, like some other organic scintillators, provides a shorter light pulse due to gamma interaction (a few nanoseconds) than due to neutron interaction (a few tens of nanoseconds). This is due to the difference in stopping power dE/dx for the two kinds of radiation. The pulses are fed into an electronic system which measures the pulse fall time and provides a pulse of height relative to this fall time. This technique is called pulse shape discrimination (PSD). An example of such time distribution is shown in Figure 53. The electronic system used for neutrons or gamma ray spectroscopy is shown in Figure 54. The system has two branches one for energy spectrum measurement and the other for PSD. The PSD output is used to trigger the multichannel analyzer so that gamma only or neutrons only are analyzed. The scintillator linearity is tested by measuring pulse height due to Compton edges of
292
Activation Analysis
PRRISION
I COMPUTER
FIGURE 54.
Neutron-gamma spectrum measurement system.
a set of gamma sources generally used for energy calibration. An example of such a test is shown in Figure 55. An example of raw (before unfolding) data of gamma ray spectrum emitted from an AmBe neutron source is shown in Figure 56 and in Figure 57 after unfolding. The line at 4.44 MeV due to lZCdeexcitation is clearly seen. Other examples are shown in Figures 58 to 60.
Volume 11
Compton Edge Energy (KeV) FIGURE 5 5 .
System linearity calibrated with standard gamma sources.
293
294
Activation Analysis
Measured Gamma Pulses (arb.units ) FIGURE 56.
PuBe gamma spectrum with Ne213 liquid scintillator before un-
falding.
Gamma Energy (MeV) LlGURE 57. PuBe gamma spectrum of Figure 56 after unfalding.
Volume 11 ** ii
I
I
I
PARAFFIN
-
Cn H 2 n t 1
GAMMA
ENERGY, MeV
FIGURE 58. Unfalded gamma spectrum due to fast neutrons interaction with paraffin.
GAMMA
ENERGY,MeV
FIGURE 59. Unfalded gamma spectrum due to fast neutrons interaction with starch.
295
I
0
.
H
. 0.
I
C
0 :
I
WOOD
-
.
-
0
. . 0
GAMMA
-
ENERGY, MeV
FIGURE 60. Unfalded gamma spectrum due to fast neutrons interaction with wood.
REFERENCES 1. FORIST, Spectrum Unfolding Code, PSR-92, Oak Ridge National Laboratory, Oak Ridge, TN, 1982. 2. Kumar, A. and Nagarajan, P. S., Int. J. Appl. Radiat. Isot., 29, 59, 1978. 3. Ansell, K. H. and Hall, G . E., Proc. American Nuclear Soc. Topical Meeting, Vol. 2, American Nuclear Society, Augusta, GA, 1971, 1. 4. Rieppo, R., Int. J. Appl. Radiat. Isot., 35, 41, 1984. 5. Handbook on Nuclear Activation Cross-Sections, IAEA Tech. Rep. No. 156, International Atomic Energy Agency, Vienna, 1974. 6. Macklin, R. L. and Pomerance, H. S., Proc. 1st Int. Conf. Peaceful Uses Atomic Energy, Geneva, 5, 96, 1956. 7. Sher, R., in Handbook on Nuclear Activation Cross-Section, IAEA Tech. Rep. No. 156, International Atomic Energy Agency Vienna, 1974, 1. 8. Albinsson, H., in Handbook on Nuclear Activation Cross-Section, IAEA Tech. Rep. No. 156, International Atomic Energy Agency, Vienna, 1974, 15. 9. Beckurts, K. H. and Wirtz, K., Neutron Physics, Springer Verlag, Berlin, 1964. 10. Hughes, D. J., Pile Neutron Research, Ch. H . Addison-Welsey, Reading, MA, 1953. 11. Rieppo, R., Int. J. Appl. Radiat. Isot., 32, 219, 1981. 12. Vanska, R. and Rieppo, R., Int. J. Appl. Radiat. Isor.. 30, 513, 1979. 13. Rieppo, R., Int. J. Appl. Radiat. Isor., 31, 789, 1980. 14. Wormald, M. R., et al., Int. J. Appl. Radiat. Isot., 30, 302, 1979. 15. Clayton, C. G . and Wormald, M. R., Int. J. Appl. Radiat. Isot., 34, 3 , 1983. 16. Clayton, C. G. and Wormald, M. R., in Industrial Application of Radioisotopes, IAEA S T U h b 508, International Atomic Energy Agency, Vienna, 1982. 17. Wormald, M. R. and Clayton, C. G., Int. J. Appl. Radiat. Isor., 34, 71, 1983. 18. Clayton, C. G., et al., Int. J. Appl. Radiat. Isor., 34, 83, 1983. 19. Clayton, C. G. and Coleman, C. F., Int. J. Appl. Radiat. Isor., 36, 757, 1985. 20. Wormald, M. R., et al., Int. J . Appl. Radiat. Isor., 30, 297, 1979. 21. Shani, G. and Nir-El, Y., Coal Composition Analysis Using Nuclear Method, report submitted to Israeli Ministry of Energy, 1984. 22. Shani, G. and Nir-El, Y., Oil Shale Analysis Using Thermal Neutron Prompt Gamma Measurement, submitted to Israel Ministry of Energy, 1984. 23. Czegledi, I., Nuclear Borehole Geophysics in Industrial Application of Radioisotopes, Foldiuk, G., Ed., Elsevier, Amsterdam, 1986.
Volume I1
297
24. Shani, G., Elemental Analysis of Dead-Sea Products Using 252CfPrompt Gamma Measurement, report to Dead Sea Works, 1986. 25. Borsara, M. and Eisles, P. L., Int. J . Appl. Radiat. Isot., 32, 43, 1981. 26. Al-Hiti, K., et al., Int. J. Appl. Radiat. Isot., 31, 563, 1980. 27. Whineray, S., et al., Int. J . Appl. Radiat. Isot., 31, 443, 1980. 28. Matthews, I. P. and Spyrou, N. M., Int. J. Appl. Radiat. Isor., 33, 61, 1982. 29. Givens, W. W., et al., Nucl. Instrum. Methods. 80, 95, 1970. 30. Borsaru, M., et al., Int. I . Appl. Radiat. Isot., 34, 397, 1983. 31. Cohn, S. H., At. Energy Rev., 18, 599, 1980. 32. Cohn S. H. et al., J . Nucl. M e d . , 13, 487, 1972. 33. McNeill, K. G., et al., J . Nucl. Med., 14, 502, 1973. 34. Cohn, S. H. and Dombrowski, C. S., J. Nucl. Med., 12, 499, 1971. 35. Mernagh, J. R., et al., Phys. Med. Biol., 22, 831, 1977. 36. Lewellen, T. K., et al., J. Nucl. Med., 16, 672, 1975. 37. Lewellen, T. K., et al., J . Nucl. M e d . , 18, 929, 1977. 38. Bell, C. M. J., et al., J . Nucl. M e d . , 19, 54, 1978. 39. Bigler, R., AppI. Radioisot., 7, 149, 1978. 40. Catto, G. R. D. et al., Lancer, i, 1150, 1973. 41. Maziere, B., et al., J. Radioanal. Chem., 37, 357, 1977. 42. Boddy, K., et al., Phys. Med. Biol., 19, 853, 1974. 43. Smith, M. A. and Tothill, P., Phys. Med. Biol., 24, 319, 1979. 44. McLellan, J. S., et al., Phys. Med. Biol., 20, 88, 1975. 45. Harvey, T. C., et al., Lancet, i, 1269, 1975. 46. Harvey, T. C., et al., in Progress and Problems in vivo Activation Analysis, Proc. 2nd Symp., Scottish Universities Research Reactor Center, East Kilbridge, Scotland, 1976. 47. Chummins, J. C., et al., in Nuclear Activation Techniques in Life Sciences, Proc. Symp. Vienna, 1978, International Atomic Energy Agency, Vienna, 1979, 719. 48. Vartsky, D., et al., Phys. Med. Biol., 22, 1985, 1977. 49. Mernagh, J. R., et al., Phys. Med. Biol., 22, 831, 1977. 50. Agard, E. T., In Vivo Neutron Activation Analysis, Ph.D. thesis, University of Toronto, Toronto, Canada, 1970. 51. Vartsky, D. and Thomas, B. J., Phys. Med. Biol., 21, 139, 1976. 52. Evans, H. J., et al., Phys. Med. Biol., 24, 181, 1979. 53. Morgan, W. D., Phys. Med. Biol., 26, 413, 1981. 54. Krauel, J. B., et al., Int. J. Appl. Radiat. Isor., 31, 101, 1980. 55. Morgan, W. D., et al., Phys. Med. Biol., 26, 577, 1981. 56. Cohen-Boulakia, F., et al., Phys. Med. Biol., 26, 857, 1981. 57. Beddoe, A. H., et al., Phys. Med. Biol., 29, 371, 1984. 58. Vartsky, D., et al., J. Radioanal. Chem., 48, 243, 1979. 59. McNeill, K. G., et al., J. Parent. Ent. Nutr., 6, 106, 1982. 60. Vartsky, D., et a]., J . Nucl. M e d . , 20, 1158, 1979. 61. Glaros, D., et al., Med. Phys., 13, 45, 1986. 62. Lamar, J. C., et al., J . Pharmacol. Methods, 5 , 255, 1981. 63. Leach, M. O., et al., Phys. Med. Biol., 29, 779, 1984. 64. Vartsky, D., et al., Phys. Med. Biol., 30, 1225, 1985, 65. Shani, G., Int. J. Appl. Radiat. Isot., 24, 519, 1973. 66. Tsechanski, A. and Shani, G., Nucl. Technol., 62, 227, 1983. 67. Ozek, F., et al., Int. J. Appl. Radiat. Isot., 30, 715, 1979.
Volume 11
299
Chapter 6
ACTIVATION ANALYSIS WITH SMALL MOBILE REACTORS Chien Chung
TABLE OF CONTENTS Introduction ..................................................................... 300 The Mobile Reactor .............................................................300 A. The Nuclear Reactor ....................................................301 B. Activation Station .......................................................202 C. Mobile Trailer ...........................................................302
In Vivo Activation ..............................................................304 A. The Detection System ...................................................305 B. Phantom Experiment ....................................................305 C. Calibration in IVPGAA .................................................309 Radiation Dosimetry ............................................................309 A. Neutron Dosimetry ......................................................310 B. Gamma-Ray Dosimetry ..................................................311 C. Safety Assessment .......................................................313 Determination of Elemental Concentration ......................................315 A. In Vivo Determination of Toxic Elements ...............................315 B. In Vivo Determination of Essential Elements ............................318 Discussion ......................................................................319 References.............................................................................. 320
300
Activation Analysis
I. INTRODUCTION Neutrons generated from the core of a nuclear reactor, as mentioned in Chapter 1 of this volume, have been utilized for activation analysis for the past four decades. Typical thermal neutron fluxes available in the reactor core for activation purposes range from 10" to 1015n,/cm2 s, and in pulsed operation may be five orders of magnitude higher. However, when the thermal neutron flux at irradiated position drops below lo9 n,/cmz s, the induced radioactivity of most activated elements falls below the detection limit of modem nuclear instruments. That renders the "conventional" activation analysis impractical when using low flux reactors, or small reactors. A small nuclear reactor, defined as a low-power reactor without heat-removal devices, usually has thermal power output under 100 W, yielding an average in-core thermal neutron flux below lo9 q,/cm2 s. There are 82 small reactors and critical assemblies distributed among 21 countries; most of them are utilized for teaching, training, and educational purposes and occasionally for research in reactor engineering, health physics, and radiation science. Because the neutrons generated from small reactors induce only minute amounts of radioactivity in the sample, "conventional" activation analysis using a low-flux reactor is restricted to the determination of specific elements with large neutron capture cross-sections in sizable samples. Recent development of in vivo prompt gamma activation analysis (IVPGAA) has opened a new era of insight into the elemental composition of the human body. Absolute measurements of some environmental contaminants, such as cadmium, mercury, and silicon in organs, as well as of vital constituents, such as calcium, chlorine, nitrogen, and phosphorus in either the whole body or body parts have been studied for therapy evaluation, clinical diagnosis, and investigation into the modeling of body composition. Detailed clinical application of IVPGAA is summarized by C ~ h n . ~ The principle of IVPGAA, designed for in vivo studies, is to determine elemental concentrations by measuring prompt y-rays emitted during nuclear reactions rather than yrays emitted from radioactive decay. Nuclear reactions on target nuclei, induced by neutrons extracted from a small nuclear reactor, create excited reaction products which in turn deexcite promptly to the ground-state. The de-excitation is usually accomplished by emitting prompt y-rays which are detected external to the body. For instance, the thermal capture reaction of Cd(n,,y) involves high reaction cross-section of a, = 2450 b, emitting 559keV y-rays with a high yield of 73 photons per 100 neutrons captured. Thus, the emission rate of the 559-keV prompt y-rays is nearly 100 yls during the irradiation of 1 mg of cadmium with a low thermal neutron flux of 10,000 n,lcm2 s. On the other hand, total delayed y-rays emitted at the end of a 500-s activation, from all radioactive cadmium isotopes, yield only 0.0001 yls; this is well below the detection limit of even the most advanced lowbackground y-ray spectrometer. In this chapter, activation analysis using an external neutron beam from a small mobile reactor for in vivo activation is described. Although neutrons used in IVPGAA for medical diagnosis can be extracted from any nuclear facility, such as accelerator, neutron generator, and isotopic neutron source, as described elsewhere in this book, characteristicsof the mobile reactor, in vivo medical diagnosis, and radiation safety are emphasized in this chapter in order to elucidate the utilization of the small nuclear reactor for a specific activation analysis.
.
.
Is2
-
11. THE MOBILE REACTOR The Tsing Hua Mobile Educational Reactor (THMER) was designed and constructed by National Tsing Hua University in Taiwan.' It has a record of 1200 h of full power operation for training and research purposes since the reactor went critical in 1976. The
Volume I1
301
FIGURE 1. IVPGAA arrangement using THMER facility: A, vertical neutron beam tube; B, plywood; C, lead y shield; D, boron-doped polyethylene; E, Lucite"; F, irradiated phantom; G, 6LiFneutron cup; H, portable
HPGe detector; I, LN, dewar; J, 6Li,C0, neutron filters; K, neutron beam shutter system; L, neutron shield; M, nuclear reactor core; N, control plates; P, startup neutron source; and Q, neutron reflector.
THMER facility, converted for IVPGAA medical application, contains three major components: the nuclear reactor, activation station, and mobile trailer. A. THENUCLEARREACTOR The nuclear reactor core and neutron reflector of THMER are shown in Figure 1. The cylindrical reactor core, similar in design to the German SUR-100 and the U.S. AGN-201, consists of up to 12 fuel cakes which are made up of 20% enriched U,O, mixed with polyethylene as moderator. To further reduce the critical mass, the reactor core is surrounded by a 20-cm thick layer of reactor-grade graphite as a neutron reflector. The reactor core and part of the graphite reflector are sealed in a gas-tight aluminum tank to avoid the release of gaseous fission products. The total weight of 235Uin the core is 650 g, yielding a maximum thermal neutron flux at the core center of about 5 x lo6 q,/cm2 s, equivalent to a reactor power level of 0.1 W with excess reactivity of 0.3%. The THMER has a negligible temperature rise in the core which is operated at room temperature; no coolant is provided. The large negative temperature coefficient of the core shuts down the reactor automatically whenever the core temperature rise exceeds 10°C above ambient temperature. It can be started up by driving a 370-MBq (10-mCi) 226Ra-Beneutron source from below, and the
.
302
Activation Analysis
power level can be controlled by two control plates which are inserted into the outer graphite reflector to absorb excess neutrom4 Since THMER operates at a very low power level, the P and y activities due to fission are estimated at about 11 GBq (300 mCi). A 10-cm thick lead wall is placed immediately outside the graphite reflector to effectively shield adjacent area from the P and y radiations. About 5 tons of distilled water saturated with boric acid are placed in the stainless steel tank. Water acts as a moderator to thermalize neutrons which leak out of the lead wall, while boron absorbs the thermalized neutrons. To further reduce the leakage of neutrons and y-rays on top of the reactor tank, except for the vertical neutron beam tube aimed at the activation station, a 40-cm thick layer of boron-doped polyethylene and LuciteB are piled above the lead wall to slow down and to absorb the leakage neutrons. Finally, just below the IVPGAA station and above the polyethylenellucite plates, an 8-cm thick layer of Pb bricks are placed to attenuate any y-rays from below and further reduce the y-ray spectral background generated primarily from Compton scatteringof unwanted gammas. The THMER reactor tank, housing all reactor parts and IVFGAA station on top, is 2.1 m in diameter and 2 m in height, and has its bottom screwed to the main beams of the mobile trailer. The top of the 13-ton reactor tank is 1.5 m above the trailer floor, providing enough space for IVPGAA medical application.
B. ACTIVATION STATION The IVPGAA station is on top of the reactor tank of the THMER facility as shown in Figure 1. A vertical neutron beam is extracted from the reactor core and collimated by boron doped polyethylene/Lucite.@' When the THMER is started up and reaches its full power, neutrons from the 10.5-cm diameter beam tube can be shut off by pumping the saturated H3B03solution into the beam tube in 45 s, or at a speed of 1 cm solution-height per second, without interfering with the control of the reactor power level. At the IVFGAA station, the neutron beam can be shut off during loading and unloading of the patient. Once the patient is placed in supine position where the preselected organ was centered at the beam tube, the neutron beam is initiated by pumping off the H3B03solution. In Figure 2, the variation of reactor power level with the closing period of vertical neutron beam is illustrated; only a small + 0.3% variation is observed during the 4% pumpdown. Since 90% of thermalized neutrons are absorbed by the skin and the fmt 4 cm of tissue, they contribute very little towards activating an element deep in the body organ but, rather, they deliver unnecessary neutron doses.5 In order to eliminate the thermal neutrons extracted from the THMER facility, a 5-cm thick 95%-enriched 6Li,C03 absorber in a Lucite@cup is inserted on top of the neutron beam tube. This absorber can completely absorb thermal neutrons because of the high cross-section for the 6Li (n,a) 3H reaction. Even if all the tritium generated by the absorption of thermal neutrons escapes from the absorber to the surroundings, total activity of the long-lived 3H is minor: less than 50,000 Bq in a continuous 1-year IVPGAA diagnostic operation. d In Figure 3, the integrated neutron flux per energy range J- +n (E) dE at skin surface,
dE
measured by activation foil technique and calculated by SAND-I1 code, is shown.6 All of
unwanted thermal neutrons directly from the reactor core are readily absorbed by the 'Li2CO3 filter; secondly, nonthermal neutrons penetrating the skin are slowed down by tissues, thermalized in organs, and can react with nuclei of interest, giving rise to the prompt yrays that are subsequently emitted.
C. MOBILE TRAILER A special feature of the THMER facility is its mobility; as shown in Figure 4, the 13-
Volume 11
r-
P U M P
1
DOWN3 OFF
110
roo to
w
!i
8 d3 g
srn
3 I
00
L < rn
r dp
I
L
0
I
1
1
20
40
80
J
OPERATING TIME, 8 FIGURE 2. Variation of THMER power level and neutron response at the activation station during the shut-off of neutron beam from the reactor core.
FIGURE 3. Integrated neutron flux as a function of neutron energy at the skin surface of the liquid phantom using THMER facility.
303
304
Activation Analysis
FIGURE 4. The THMER mobile trailer for IVPGAA medical diagnosis: 1, reactor tank; 2, control console; 3, power crane; 4, air monitor; 5, H3B03neutron shutter; 6, NIM electronics; 7, air-vent system; 8, power console; 9, emergency air-blower; 10, IVPGAA station; 1 1 , transformer; and 12, medical cabinet.
t reactor tank is housed in the front of a 4 x 3 X 11.5 m trailer. The trailer also houses a control console, emergency blower, heavy-duty crane, diesel generator, air-conditioning system, and medical accessories. The reactor operation is performed in the control console, which includes an instrument column and a control panel. The instrument column contains the control power supplies, the neutron monitoring system, and area monitoring instruments. The control panel contains control switches, the power recorder, the alarm system, and the safety interlock system. A fission product monitor for both gases and particulates is also included. In addition, both reactor operator and medical researcher, sitting near the console, are protected by an iron armor lined with B,C plate to attenuate scattered y-rays and absorb thermal neutrons. The emergency ventillation system is installed in the front section of the trailer. The unit consists of a 1-hp blower, with an absolute filter for removing the radioactive particulates in the air of the trailer in case of emergency. An overhead crane of 1-ton capacity is designed for loading and unloading heavy pieces such as medical equipment. It can travel in three directions throughout the trailer. The trailer is provided with four independently adjustable legs in addition to wheels. Each leg can be smoothly extended to about 34 cm by cranking its handle. With these legs, the trailer can be leveled on rough terrain. With a total weight of 28 tons, the trailer can be towed by a standard tractor on most major routes around the island. In order to avoid accidental criticality, the reactor fuels are moved out of the core and stored in a back-up vehicle before any field trip; maximum speed of the THMER convoy is limited to 40 krnlh. In the past several years, the THMER has made numerous field trips with cumulative field records of 3000 km on the road to colleges, universities, and technical institutes to support off-campus training courses and research programs, thus reducing the complexity of bringing sick patients to the university.
111. IN VIVO ACTIVATION In in vivo measurements, the quantitative determination is more difficult than in conventional activation analysis using a standard comparator because of differences in organ size and human habits among individuals. The comparison of human with a phantom in in vivo measurements must be justified by providing a uniform neutron flux in the irradiated organ. A steady, nonthermal neutron beam, such as that provided by THMER facility, is recommended for in vivo diagnosis.
Volume 11
305
A. THE DETECTING SYSTEM To detect and analyze the prompt y-rays in IVPGAA experiments, a portable germanium photon detector, with 24-h liquid nitrogen holding time, supported by data collectinglanalyzing electronics and a neutrodgamrna shield, is used. A gamma-X, N-type hyperpure germanium (HPGe) detector, having 25% relative efficiency, is placed next to the phantom. The system resolution of full-width-at-half-maximum, with an estimated scattered neutron flux of 200 dcm2 s, is 2.9 keV at 2223 keV. Prompt y-rays collected by the detector are stored in a 4096-channel spectrum and subsequently analyzed, sorted, printed, and plotted using a multichannel analyzer (MCA) coupled to an IBM personal computer. Before and after each IVPGAA measurement, the HPGe detector efficiency and energy resolution are calibrated and checked using sets of standard sources to ensure the performance of the HPGe detector in a hostile environment of an intense neutron flux. A 1-cm thick LuciteB disk filled with 95%-enriched 6LiF is attached to the window of the HPGe detector to stop thermal neutrons from scattering into the detector active volume. Another 3-cm layer of natural Li,CO, was placed between the liquid nitrogen dewar and the 4-cm lead cylindrical shield to stop the thermal neutrons from scattering into the 1.2-1 liquid nitrogen, thus avoiding the interference with the partial body nitrogen diagnosis. The background y-ray spectrum observed outside of the reactor tank has some features which reflect characteristic construction materials close to the reactor core and dictate the detection limit of an element of interest. A background y-ray spectrum with energy range of 0.25 to 11 MeV obtained on top of the reactor with neutron beam closed is shown in Figure 5. The most intense photopeak in the spectrum is the 2223-keV prompt y-rays from the H(n,y)D reaction. This arises because the reactor components contain about 7 x loz8 hydrogen nuclides. Above the 2223-keV region, the spectrum is dominated by prompt yrays as well as their single/double escape peaks from construction materials near the reactor core, such as carbon (400 kg above the reactor core), iron (425 kg of steel as inner reactor tank), lead (4.6 tons of lead wall as y shield), and aluminum (8 kg of aluminum as reactor fuel tank). In the low energy region, the background spectrum has four major components: (1) Compton scattering background from high energy y-rays, (2) prompt y-rays from construction materials as well as the single and double escape peaks from 2223 keV, (3) annihilation y-rays of 5 11 keV from the pair production of high energy y-rays and P+ decays, and (4) prompt y-rays from the Ge(n,y) reaction within the HPGe detector. However, fission product y-rays from the reactor core, radioactive decay y-rays from the 226Ra-Bestartup neutron source, and capture y-rays from cadmium control plates in the inner reactor tank are not observed.
-
B. PHANTOM EXPERIMENT In order to stimulate the irradiation condition for the human body, a man-llke liquid phantom for diagnostic purpose and a female-like LuciteB phantom for radiation safety investigation were made for IVPGAA studies. The man-like liquid phantom, following the specifications of MIRD,' is made up from 0.5 cm thick LuciteB; the trunk is 20 cm thick, 40 cm wide, and 70 cm high; the leg is 80 cm long, 20 cm thick at thigh, and 4 cm thick at foot, as illustrated in Figure 6A. In order to reproduce the normal content of essential elements in the human body, various chemicals of Ca(NO,),, H,PO,, KCI, Na,SO,, urea, and water were used to fill the phantom. In addition, LuciteB-made hollow kidneys and liver are fixed at the proper positions in the liquid phantom. In order to investigate the concentration of toxic elements in both the liver and kidneys in the liquid phantom, toxic solution can be used to fill the sealed 1833-cm" liver and 144-cm3kidneys for irradiation. As shown in Figure 6B the female-like LuciteB phantom, with dimensions and config-
306
Activation Analysis
I
lo"
PROMPT GAMMA 'RAY ENERGY
( k8V )
F I e J R E 5. Measured y-ray background spectrum of the THMER facility at full-power operation; photopeaks of specific elements are labeled, single escape peak (S) and double escape peak (D) for those underlined photopeaks are also shown. (Reprinted with permission from Int. J. Appl. Radiar. Zsot., Chung, C., Yuan, L. J., Chen, K. B., Weng, P. S., Chang, P. S., and Ho, Y. H., A feasibility study of the in vivo prompt gamma-ray activation analysis using a mobile reactor, Copyright 1985, Pergamon Journals Ltd.)
uration identical to the commercially available Rando phantom, was designed and fabricated for internal dose measurements for IVPGAA diagnosk6 LuciteB was chosen as the construction material because it is stable with respect to environmental factors and resistant to irradiation well over 10,000 Gy. In addition, the density and effective atomic number of Lucitem are similar to that of Reference Man.' The phantom was made within a mode to normal relationship with body contour; it was terminated horizontally at the shoulders but
Volume 11
307
FIGURE 6. (A) The man-like liquid phantom and (B) the female-like Lucitem phantom used for IVPGAA diagnosis at THMER facility.
308
Activation Analysis
+ 0
1
I
1
{/fi++-
L p- phmtmf liver
IBI'
K- kidney
.2
'a
1
DISTANCE, cm FIGURE 7. Distribution of thermal neutron flux along (A) Z-axis, (B) X-axis, and (C) Y-axis in the irradiated phantom using activation foils techniques: A, from Rh-foils and 0 , from Infoils. (Reprinted with permission from Inr. J. Appl. Radiat. Isot., 36, Chung, C., Yuan, L. J., Chen, K. B . , Weng, P. S . , Chang, P. S., and Ho, Y. H., A feasibility study of the in vivo prompt gamma-ray activation analysis using a mobile reactor, Copyright 1985, Pergamon Journals Ltd.)
enclosed the full scapulae. The upper third of the thighs was included, with a flat cut at that level to establish a base. Since the phantom was designed to insert dosimeters everywhere within the body, the phantom was sectioned every centimeter transversely and 0.5-cm diameter holes were drilled every 4 cm2 longitudinally. The sectionized phantom can be assembled by inserting LuciteB pins in every second hole. In Figure 7A, the thermal neutron flux in the man-like phantom along the beam direction (Z-axis), determined by activation foils and normalized to fission track data, is ill~strated.~ The supine-posterior irradiation, using the 6Li,C0, thermal neutron absorber in the beam tube, yields a small standard deviation of 2 5 % to the mean neutron flux in the irradiated
neutrons is fairly uniform throughout the body. This arrangement is very suitable for partial body IVPGAA to investigate the elemental composition of a body organ since most of the elements of interest are readily activated by thermalized neutrons.
Volume 11
309
Since the dimensions of irradiated organ vary among individuals, neutron flux distribution in a phantom has to be determined in order to establish the correction factors due to organ size, body curvature, and interorgan interference. In both the longitudinal axis (Xaxis) and transversal axis (Y-axis), as illustrated in Figure 7B and 7C, thermal neutron fluxes distribute symmetrically to the irradiated organ and have a -15- to 20-cm field width of 50% of maximum flux. These results are again different from those using isotopic neutron sources in which the thermal flux slowly drops to 50% of its maximum with 45-cm width from the 1I -cm wide beam slot.9 Compared to other facilities using fast neutrons, the neutron dose is well localized in the irradiated organ; fewer neutrons are scattered to other organs, thus reducing the interorgan interference.
C. CALIBRATION IN IVPGAA Unlike conventional neutron activation analysis, no comparator is used in IVPGAA for cabibration. Instead, the organ containing the specific amount of elements of interest is positioned directly over the collimated neutron beam and irradiated under the same conditions as the patients. The specific countrate, in terms of counts in photopeak area per unit time per unit weight of elements of interest, is used for calibration in acutal IVPGAA diagnosis. For instance, cadmium chloride and mercury chloride solutions in extrapure grade may be filled in the sealed, LuciteB liver and kidneys for the investigation of the concentration of these contaminants. As shown in Figure 8, prompt y-rays from both Cd(n,y) and Hg(n,y) reactions are clearly detected in the high-resolution MCA spectrum. The net counts in the interested photopeak area, representing the concentration of toxic elements during the preselected counting period, are deduced and labeled in the figure. Another factor that dictates the calibration is the stability of neutron beam, or the THMER thermal-power output, during the irradiations of both phantom and patient. The previous THMER operating experience indicates no more than a 5% fluctuation of reactor power from its preset level. Therefore, the uncertainty due to the fluctuation of neutron beam is at the same order of, or even less than, the statistical error of photopeak area. The use of ultrasound for organ localization prior to irradiation is recommended for in vivo measurements. In general, the depth of any irradiated organ is about 1 to 10 cm from the skin for healthy adults,'" which is located within the operating range of modem ultrasound scanner. Since the center, size, and depth of organ are to be determined beforehand, it is important to use the ultrasound scanner for in vivo measurement of elemental concentration in organs.
IV. RADIATION DOSIMETRY Unlike other nuclear medical techniques, the IVPGAA requires neutrons to pass into the human body, therefore, the radiation safety, in particular the neutron doses and associated health risk, must be documented before applying the newly developed technique clinically. In IVPGAA diagnosis, all tissues and organs in the human body receive various amounts of neutron and y-ray doses though the irradiated organ receives the highest. Since more than one organ of the body is exposed, the irradiation of one particular organ causes simultaneously exposures to neighboring organs and always has some degree of risk because of their sensitivity to neutron and y-ray radiations or the importance to health of any damage that results. For the purpose of radiation protection, the International Commission on Radiological Protection (ICRP) specifies a number of organs and tissues to which the radiation doses have to be measured because of their susceptibility to radiation damage, the seriousness of such damage, and the extent to which this could be treatable." Although the radiation doses V at skin were reported in previous IVPGAA works ranging from 500 kSv to 10,000 ~ S per scan, few of them ever reported the radiation doses of the irradiated organ as well as other radiation-sensitive t i s s ~ e s . ' ~
310
Activation Analysis
Ge- 326.0 k e V
Fr-352.3 kcV
.:<-.
Am.'
-.
1 , - - - -, J ...
800
660
...
mo
.
PROMPT GAMMkRAV ENERGY, keV FIGURE 8. Excerpt of the prompt y-ray spectrum from the diagnostic IVPGAA for the contaminated left kidney; major photopeaks in the high-resolution, multichannel spectrum are labeled. (Reprinted with permission from Znt. J . Appl. Radiat. Isot., 36, Chung, C., Yuan, L. J., Chen, K. B., Weng, P. S., Chang, P. S., and Ho, Y. H., A feasibility study of the in vivo prompt gamma-ray activation analysis using a mobile reactor, Copyright 1985, Pergamon and Int. J . Radiat. Appl. Instrum., A39, Chung, C., In vivo partial body activation analysis using filtered neutron beam, Copyright 1988, Pergamon Journals Ltd.)
In IVPGAA diagnosis, neutron beams were either aimed at the relatively radiationsenseless body mass, such as hands and legs for essential elemental determination, or trained at the radiation-sensitive organ where toxic contaminants accumulated. In the latter case, organs and tissues sensitive to radiations, such as gonads, red bone marrow, bone surface, thyroid, breast, and lung, are either the irradiated organ itself or not too far from the neutron beam direction inside the body. Both neutrons and y-rays can scatter into the sensitive organ or tissue and interact with nuclei to cause radiation damage. It is the radiation doses in sensitive organs and tissues, not at the skin, hands, or legs, that the radiation safety in IVPGAA diagnosis should address. A. NEUTRON DOSIMETRY Neutron doses at the phantom skin position were determined using thermoluminescent dosimeters (TLD) and neutron energy spectroscopy techniques. Since the irradiation field of IVPGAA experiments has a high neutron component, the TLD-600, containing 95%-
Volume 11
311
enriched 6LiF, was used to measure the absorbed dose from both thermal neutrons and yrays. Absorbed dose of y-rays, emitted from neutron capture reactions, were monitored by TLD-700. The 99.99%-enriched 'LiF in TLD-700 was chosen because of its low neutron sensitivity. Therefore, reading difference of TLD-600 to that of TLD-700 corresponds to the thermal neutron dose alone. Neutron dose, however, is a function of neutron energy, and the energy range of interest varies by nine orders of magnitude. The neutron energy spectrum is, therefore, needed to evaluate the dose equivalent. The neutron flux-energy distribution on skin surface was established by use of activation foil techniques. The thermal neutron flux was monitored using the 1 9 7 A(n,y) ~ '98Au reaction; the epithermal neutron flux was monitored using Aufoil covered by Cd to eliminate the thermal component; and the fast neutron flux was monitored by the Cd-covered 'I5In (n,,nry) '15"In reaction. The results of these measurements served as input to the SAND-I1 code in which the neutron energy spectrum was mapped.4 The result of the neutron energy spectrum at the skin for kidney irradiation is shown in Figure 3, to which the thermal neutrons are purposely filtered out. Since fast neutrons are rapidly slowed down and thermal neutrons are absorbed in the phantom, activities of some irradiated foils are below the detection limit and the foil activation method is no longer valid for neutron dose evaluation inside the phantom. Instead, the energy and spatial distribution of neutrons in organs and tissues were calculated using two-group neutron transport code by simplifying the experimental data of neutrons at skin surface as a disk neutron source.13 Accordingly, the neutron flux &(En,r,0) at a specific energy En at a distance r and an angle 0 with respect to the skin surface of the impact point, as shown in Figure 6B, can be evaluated for each organ and tissue of interest. Conversion factors of neutron flux-to-dose rate equivalent of Publication ICRP-21, which apply to a cylindrical phantom with log-log interpolation, are used to convert the +,(En,r,O) at preselected organs and tissues into dose rate equivalent.I4 The typical irradiation period of IVPGAA medical diagnosis is 1800 s using THMER facility in order to maintain a compatible detecting sensitivity of toxic contaminants in kidneys and liver, resulting in a neutron dose equivalent per scan of 2890 pSv at the skin surface at the impact point. For the neutron dose rate equivalent at organ and tissue internally, the calculated results are shown in Figure 9. With high conversion factors, intermediate energy and fast neutrons with En 2 10 keV dominate the neutron doses everywhere in the phantom. Neutrons at nonthermal energy are attenuated and slowed down rapidly inside the phantom, reducing the strength by a factor of 10 in every 10 cm of tissue-equivalent material. The only exception is the buildup of thermal and epithermal neutron fluxes owing to the slowing down of neutrons from nonthermal origins; this is expected in the THMER facility since the irradiated organ right over the neutron beam line can interact with a maximum thermal neutron flux for IVPGAA diagnosis. Another feature is the rapid drop of dose rate equivalents as the distance and angle from organ to impact point increases. This indicates the well-collimated neutron beam penetrates the phantom upwardly and scatters very little in other directions.
B. GAMMA-RAY DOSIMETRY Two kinds of TL dosimeters were used to measure the y-ray absorption doses in the phantom. The first group was a pair of commercially available TLD-700 and TLD-600 dosimeters; another TL powders were the CaS0,:Dy with the mole ratio of Dy,O, to CsSO,. 2H,O as 1:1000. The CaS0,:Dy is very sensitive to y-ray dose measurement with a detection limit lower than that of LiF by a factor of approximately 10. However, because its response to y radiation is energy dependent, only the relative readings from CaS0,:Dy were used to cross-check the LiF output. Both CaS0,:Dy and TLD-7001600 were wrapped in one package and inserted in proper
312
Activation Analysis
FIGURE 9. Measured y-ray and calculated neutron dose rate equivalent in various positions inside the liquid phantom, displaced as a function of rICos0.
positions in the female-like LuciteB phantom, as shown in Figure 6B, for a long irradiation to reduce the maximum error at 90% confidence level below 10%. The responses of these TLD were calibrated with a 3500-MBq T o source and all irradiated dosimeters including the control group were measured with a Harshaw-2000 B/C TLD reader. Dose rate equivalents of y-rays in IVPGAA diagnosis were measured and evaluated for organs and tissues of interest and their values are illustrated also in Figure 9. As shown in the figure, y-ray dose rate equivalents drop less drastically than those of neutrons; this is because the majority of y-rays outside the phantom originate from the scattering of high-energy y-rays that escape from the reactor core. Only near the neutron beam line where prompt y-ray flux is more
Volume 11
313
FIGURE 10. Induced radioactivity after the 1800-s IVPGAA diagnosis using THMER facility.
than that of the scattered high-energy y-rays from around. At a distance of more than 40 cm away from the impact point transversally, the y-ray dose rate equivalent in the phantom drops and levels off to 30 ~ S v l h . Neutrons are exclusively used in IVPGAA medical diagnosis and some nuclei interacting with neutrons in the human body eventually become radioactive. The minor amount of induced radioactivity, even below the detection limit, must be calculated in order to evaluate the internal doses in the postdiagnostic period. Using the elemental compositions in Reference Man and assuming their homogeneous distribution in the phantom,' the activity for each activated radionuclide at the end of 1800-s IVPGAA diagnosis is calculated according to the neutron flux distribution inside the phantom. In Figure 10, the induced activity is plotted as the time after IVPGAA diagnosis with major radionuclides labeled. About 62% of the initial activity is from the decays of 0.02 s 24mNa;after its rapid decay, whole body induced activity is reduced to 114 Bq. At 5000 s after the diagnosis, total radioactivity is rapidly decayed down to 10% of initial activity and further reduced to 1 Bq a day after. Integrated internal doses taken up by these internal f3'- and y-ray emitters are estimated to be 0.7 pSv, or 5.4% of the internal doses caused by the natural 40Kin the human body during the first 100 d after diagnosis; the induced radioactivity is considered insignificant compared to the internal natural radioactivity and so any associated health problem can be ignored. C. SAFETY ASSESSMENT An 1800-s IVPGAA kidney diagnosis using the THMER facility yields a modest skin dose from both neutron and gamma radiations around 3200 pSv per scan. A special feature
314
Activation Analysis
TABLE 1 Neutron and ?-Ray Dose Equivalents per Scan for Tissues at Risk in a 1800-s IVPGAA Diagnosis for Kidney Using
THMER I?a&lity Tissue at risk
Risk factor'
Weighting
DE(n)
factor'
(pSv)
DE(y) DE(all) (~SV) (~SV)
Gonads Breast Red bone marrow Lung Thyroid Bone surface Remaindersb Weighted total
"
Parameters taken from Reference 11. Remaining organs include heart, intestine, liver, stomach, and irradiated kidneys.
of the THMER facility is that the filtered neutron beam is well collimated to reduce the neutron scattering to other organs and tissues. This can be reflected from the effective doses of 14.4 pSv per scan at the most radiation-sensitive gonads, or only 0.5% of that at impact point. Comparing to the 260 pSv at gonads vs. 6660 pSv at skin per scan using 238Pu-Be neutron source with a similar detection limit for IVPGAA diagnosis,12the improvement of reducing radiation doses in organs other than the irradiated one is explicit. Internal doses for IVPGAA diagnostic purpose using neutrons are subject to a system of justification, optimization, and limitation of doses as far as the radiation exposure is concerned. The dose equivalents measured and evaluated for those sensitive organs and tissues listed in Publication ICRP-26 are tabulated in Table 1. The weighted total dose equivalents per scan per year from both neutrons and y-rays are 69 pSv; this is certainly well below the recommended annual limit of 5000 pSv and even less than most of nuclear medical diagnoses using external ionization radiations (90 to 9000 pSv per scan) or internally used radiopharmaceuticals (50 to 500000 pSv per scan). In order to estimate the risks of IVPGAA diagnosis for patients, a total of 131 factory workers from 3 chemical processing plants involving internal cadmium contamination are sampled to evaluate their risks, assuming annual IVPGAA medical diagnosis is applied to each ~ o r k e rThe . ~ risk probabilities of leukemia, malignancy, and hereditary effects for the individual are calculated and the results are listed in Table 2. The American Cancer Society has reported that about one in every four adults in the 20 to 65 age bracket will develop cancer at some time from all possible causes; or an average risk of 0.0056 per year during the entire working career. The health implication to the high-risk workers, receiving annual medical diagnostic doses listed in Table 1 continuously until retirement, could be only 0.00084% of the normal risk of dying of cancer caused by all other means including cadmium poisoning. The potential genetic effects among the exposed workers are even more insignificant compared to the genetic damage that occurs spontaneously. The probability of getting serious genetic defects among the first-generation children of exposed workers in IVPGAA diagnosis is 6 x lop8;this number can be compared to approximately one serious genetic defect in every ten live births. Thus, health problems and associated risks for irradiated workers are minor compared to other causes of fatality. In partial body IVPGAA on hands and legs for essential element determination, the effective dose equivalent is much less than those in kidney irradiation because all sensitive
315
Volume 11 TABLE 2
Risk Assessments of Radiation Doses Received by IVPGAA Diagnosis of Cadmium Contamination for High-Risk Factory Workers Using THMER Facility Factory workers age group (years)
Parameter
20 - 39
40 - 49
250
Number of workers" Expected number of childrena Weighted leukemia significant factor" Weighted malignancy significant factor" Annual hereditary effect risk probability Annual leukemia risk probability Annual malignancy risk probability Individual annual risk probability Population annual risk probability Statistical numbers taken from Reference 6. Parameters taken from Reference 15.
organs and tissues are far from the irradiated hands and legs. In accordance with the radiation protection standards, the internal doses for irradiated patients in both specified organ and handsllegs irradiations are well below the recommended dose limitation. A conclusion is drawn that the radiation safety for irradiated patients is highly acceptable.
V. DETERMINATION OF ELEMENTAL CONCENTRATION Some of the contaminants are very toxic, cumulative poisons. In the human body, pollutants are normally present only in minute amounts; the clinical symptoms of toxicity depend on the chemical form of the pollutant, and on whether the exposure is through contact, ingestion, or inhalation. In Figure 11, the distribution of major pollutants in the human body is illustrated among the uptake organs. On the other hand, observation of the change of essential elements such as C, Ca, CI, H, N, Na, 0 , and P in the human body is of considerable value for medical diagnosis of various diseases. Initial medical diagnosis demands the knowledge of the quantity of these elements through bulk analysis, while repeated follow-up diagnoses may monitor the progress of medical therapy for bone disease as well as transport, nutritional, and metabolic disturbances. For both toxic and essential elements in human beings, the IVPGAA technique may be applied to the patients and the quantity of some of the elements mentioned above can be determined with reasonable accuracy and precision.
A. IN VZVO DETERMINATION OF TOXIC ELEMENTS The health effect of occupational exposure to cadmium has been studied for many years. Cadmium is one of the toxic heavy metals which is used in various industries; it is absorbed occupationally by workers via inhalation of polluted air or ingestion of contaminated food and water. The initial cadmium uptake is transported from the lungs or gastrointestinal tract by the blood to the liver and kidneys. Mercury, the third member of the zinc and cadmium family, is another toxic poison. Metallic, inorganic, and organic mercury are used in various fields, including medicine and industry. The uptake is primarily by inhalation of dust or liquid aerosol during handling of mercury compounds. Metallic mercury and some of its compounds produce an appreciable vapor concentration at ambient temperatures resulting in an inhalation risk. The dust of inorganic compounds can also be inhaled and absorbed through intact skin.
316
Activation Analysis
Mg, Mn, Be, Zn C Si, As. Co Hg. CI. Se, Cd
Cd, Hg
AS, Be, Ni, Cr F
Cd
FIGURE 11. Sketch showing the main accumulation organs of major pollutant elements. (Reprinted with permission from Chang, P. S . , Ho, Y. H., Chung, C., Yuan, L. J . , and Weng, P. S . , Nucl. Technol., 76, 241, 1987. Copyright 1987, American Nuclear Society, La Grange Park, Illinois.)
Toxicologically, cadmium and mercury are preferentially retained in the renal cortex in both kidneys and liver.16 The current monitoring methods for these toxic elements involve the in vitro bioassays, such as blood contaminant measurement, quantitative urinalysis, and tissue assay by atomic absorption spectrophotometry. Since the normal values of both cadmium and mercury in urine and blood are very low, correlation with diseases is poor in most in vitro bioassay. Normal content of toxic cadmium and mercury in the kidneys and the liver as well as their nuclear properties are listed in Table 3. Average cadmium concentrations in the liver for "normal" men in the U.S., U.K., and Sweden were reported up to 2 kglg wet weight in liver.4 The critical concentration of cadmium in the kidney, defined as the threshold value above which overt renal damage occurs and becomes a potentially serious health problem, is reported as being between 58 mg to 78 mg in both kidneys, or -6 to 8 times higher than the normal content. In the Reference Man, however, mercury concentration in organs at risk is much less than that of cadmium. In both kidneys, normal content of mercury is 0.87 mg; a lesser or smaller amount of mercury, about 0.54 mg, is found in the liver, or 11% of the whole body mercury is distributed in critical organs.
TABLE 3 Toxic and Essential Elements in 1800-s IVPGAA Medical Diagnosis Using THMER Facility Natural abundance Element
Nuclear reaction
Capture crosssection a,. barn
RY) Prompt y ray (MeV)
photons/100 captures
Organ at risk Skeleton Kidneys Liver Whole body Kidney Liver Whole body Whole body
Note: Normal content is that in organ or whole body of Reference Man from Reference 8.
Normal content g 9.9 rng 4.0 rng 91 g 0.87 rng 0.54 rng 1800 g 784 g
IVPGAA detection limit Ifjog 2.2 rng 2.5mg 31 g 2.3 rng 4.1 mg 582 g 312 g
TOTAL SKIN DOSES ( I0 m8v
FIGURE 12. (A) Percentage uncertainty and (B) the minimum detectable amount of the composition of essential elements as a function of total neutronlgamma skin doses.
Detection limit of toxic elements is defined as two background counts of the photopeak area with 100%uncertainty. Using the y-ray detecting system in a 1800-s IVPGAA diagnosis, the detection limit of cadmium is 42 and 62% of the normal content in kidneys and liver, respectively. However, detection limit of mercury in critical organ is at least five times higher than the normal content, owing to the relatively low capture cross-section and lower energy of the photopeak for mercury. Although the IVPGAA diagnosis using THMER facility is not suitable for the investigation of organ mercury with normal quantity, the in vivo measurements are certainly applicable to those exposed individuals with high internal contaminations of cadmium and mercury. On the other hand, patients with high concentrations of toxic elements in organs at risk actually spend less irradiation time in IVPGAA diagnosis to attain the same detection sensitivity of cadmium and mercury as those having normal contents. Thus, patients with high exposure of toxic contaminants receive fewer radiation doses as the irradiation period is reduced.
B. IN VZVO DETERMINATION OF ESSENTIAL ELEMENTS Elemental determination of essential contents in human beings by means of in vivo measurement is of considerable value for medical diagnosis of various diseases. To demonstrate the capability of IVPGAA technique using THMER facility, calcium, chlorine, nitrogen, and phosphorus are determined in partial body IVPGAA using the man-like liquid phantom. The phantom with proper compositions of these elements, also listed in Table 3, was placed on top of the THMER facility with right thigh centered at the vertical neutron beam tube. Diagnostic irradiation at 0.1 W normal reactor power level varied from 500 to 20000 s. Photopeak areas of those prompt y-rays listed in the table at various irradiation periods were interpreted to estimate the percentage uncertainty of the concentration of essential elements. The results of the percentage uncertainty, primarily due to the counting statistics, is shown in Figure 12A. Background areas of prompt y-rays at various irradiation periods were summed to obtain the detection limit of such photopeak. The detection limits of these essential elements of interest are listed in Table 3 for an 1800-s partial body IVPGAA and plotted in Figure 12B as a function of skin doses at other irradiation periods. Both the detection limit and uncertainty of essential elements determined by IVPGAA using THMER facility can be improved substantially by increasing the irradiation time which in turn also increases the total skin doses equivalent. The percentage uncertainty of calcium can be lowered to 5% of its normal content with 12-mSv total skin dose. For chlorine,
Volume I1
319
nitrogen, and phosphorus, the skin doses is 38 mSv to obtain the same uncertainty. Since the neutron beam is well collimated and localized near the irradiated leg, the effective doses equivalent are even less than those estimated for kidney irradiation discussed previously. Even with the longest irradiation time of 20000 s, the total skin doses of 38 mSv are still far less than the imposed limit of 20,000 mSv recommended by ICRP. Thus, essential elements can be determined in partial body IVPGAA using the THMER facility with minimal skin doses.
VI. DISCUSSION The feasibility of IVPGAA diagnosis of elemental composition has been demonstrated by partial body irradiation of a phantom using small mobile reactor for the first time. The detection limit and sensitivity of essential elements of Ca, C1, N, and P in the whole body as well as toxic Cd and Hg in contaminated organs have been measured in various irradiation periods with minimal radiation doses. The performance of present IVPGAA system, with its unique mobility and relatively soft neutron energy spectrum, may be further improved by the following modifications. The suitability of an IVPGAA facility is indicated by the low detection limit of element of interest for a minimal dose, in addition to the requirements of portability, mobility, and a rapid diagnosis process. Although the IVPGAA system using the THMER facility has the advantage of mobility and has the capability of detecting many elemental concentrations in vivo, the system still can be improved substantially by further lowering both the detection limit of elements of interest and the effective doses equivalent received during diagnosis. Despite the fact that higher neutron flux and longer irradiation time yield better statistics or lower detection limits, they also increase the effective doses proportionally. Thus, increasing the reactor power or diagnostic period can not improve the IVPGAA performance. Explicit improvement can be made by employing a larger semiconducting detector and/or a multidetector system using a summed matching multiplexer. The experimental configuration in Figure 1 allows two to four portable HPGe detectors positioned on opposite sides of the phantom, thus increasing the efficiency substantially. The same counting statistics would be achieved with only a fraction of the irradiation time, therefore reducing the effective dose equivalent accordingly. The accuracy of IVPGAA measurement and detection limits are governed also by spectral background which can be suppressed by using an anti-Compton coincidence system. In consideration of the limited space at the detector position along the irradiation plane, a high density Bi,Ge,O,, (BGO) detector may be selected to suppress the Compton background originating from high energy y-ray scattering. The Compton suppression spectrometer applied to high-level radioenvironment can effectively suppress the spectral background," thus providing the alternative of selecting a multidetector system. Although the radiation doses to the patient in IVPGAA diagnosis are small, they are nevertheless not insignificant and every possible effort should be made to reduce the unnecessary doses and confine the irradiation to the irradiated volume only. The radiation dose can be further reduced by irradiating only a small portion of body mass; for instance, IVPGAA applied to the hand is a sensitive, precise technique for the absolute measurement of calcium composition in bone with a collimated neutron beam of much smaller neutron fluence, or shorter irradiation period. On the other hand, y-ray doses caused by high energy scattering gammas can be attenuated effectively by adding Pb cover around the patient; with a 4 cm thickness of lead, the y-ray doses may be further reduced by 70%. Currently, investigation and research using THMER facility involve clinical studies of mice and pigs. Both toxic and essential elements are determined by LVPGAA technique apd the results are compared to the data from autopsy and biopJy. Complete and thorougb
320
Activation Analysis
understanding from the clinical experiments using mice and pigs are required before applying the IVPGAA to patients. Nevertheless, from all preliminary studies and investigations, the IVPGAA diagnosis using a small mobile reactor, such as the THMER facility, is highly feasible and technically promising.
REFERENCES 1. Yuan, L. J. and Weng, P. S., Educational functions of the Mobile Educational Reactor, Atomkernergie Kerntechnik Suppl., 44, 1045, 1984. 2. Miki, R. and Itoh, T., Operation and utilization experience of UTR-KINKI, a low flux university research reactor, in Proc. 1st Asian Symp. Research Reactors, Institute for Atomic Energy, Rikkyo University, Tokyo, Japan, 1986, 44. 3. Cohn, S. H., In vivo neutron activation analysis: principles and clinical applications, in Nuclear Medicine and Biology Advance, Raynaud, C., Ed., Pergamon, New York, 1983, 1049. 4. Chung, C., Yuan, L. J., Chen, K. B., Weng, P. S., Chang, P. S., and Ho, Y. H., A feasibility study of the in vivo prompt gamma-ray activation analysis using a mobile nuclear reactor, Int. J. Appl. Radiat. Isot., 36, 357, 1985. 5. Chung, C., In vivo partial body activation analysis using filtered neutron beam, Int. J . Radiat. Appl. Instrum. A, A39, 93, 1988. 6. Chen, C. P., Radiation dose of medical in vivo prompt gamma-ray activation using mobile nuclear reactor, MSc thesis, National Tsing Hua University, Taiwan, ROC, 1987 (in Chinese). 7. Snyder, W. S., Ford, M. R., Warner, G. G., and Watson, A., Tabulation of dose equivalent per microcurie-day for source and target organs of an adult for various radionuclides, Report ORNL-5000, Oak Ridge National Laboratory, Oak Ridge, TN, 1974. 8. International Commission on Radiological Protection, Task Group on Reference Man, Publication ICRP23, Pergamon Press, New York, 1975. 9. Morgan, W. D. Ellis, K. J., Vartsky, D., Vasumura, S., and Cohn, S. H., Calibration of a 238Pu-Be facility for partial-body measurements of organ cadmium, Phys. Med. Biol.. 26, 577, 1981. 10. Chang, P. S., Chung, C., Yuan, L. J., and Weng, P. S., In vivo activation analysis of organ cadmium using the Tsing Hua Mobile Educational Reactor, J . Radioanal. Nucl. Chem., Articles, 92, 343, 1985. 11. International Commission on Radiological Protection, Recommendation of the ICRP, Publication ICRP-26, Pergamon Press, New York, 1977. 12. Vartsky, D., Ellis, K. J., Chen, N. S., and Cohn, S. H., A facility for in vivo measurement of kidney and liver cadmium by neutron capture prompt gamma ray analysis, Phys. Med. Biol., 22, 1085, 1977. 13. Lewis, E. E. and Miller, W. F., Computational Methods of Neutron Transport, John Wiley & Sons, New York, 1984, 68. 14. International Commission on Radiological Protection, Data for Protection Against Ionizing Radiation from External Source, Publication ICRP-21, Pergamon Press, New York, 1973. 15. Weng, P. S. and Chen, T. C., Health implications of annual dose equivalents in Taiwan, R. 0.C., Nucl. Sci. J . , 22, 96, 1985. 16. Chang, P. S., Ho, Y. H., Chung, C., Yuan, L. J., and Weng, P. S., In vivo measurement of organ mercury by prompt gamma activation analysis using a mobile nuclear reactor, Nucl. Technol., 76, 241, 1987. 17. Chung, C., Yuan, L. J., and Chen, K. B., Performance of a HPGe-NaI(T1) Compton suppression spectrometer in high-level radioenvironmental studies, Nucl. Instrum. Methods Phys. Res., A243, 102, 1986.
Application of Activation Analysis
Volume 11
323
Chapter 7
ACTIVATION ANALYSIS OF BIOLOGICAL MATERIALS
.
T Sato
TABLE OF CONTENTS I.
Introduction .....................................................................324
I1.
Activation Analysis .............................................................324 A. Sampling and Sample Preparation .......................................324 1. Characteristics of Biological Sample .............................324 2. Sampling and Sample Preservation ..............................325 3. Homogenization.................................................. 326 4. Drying ...........................................................326 5. Preseparation Prior to Irradiation .................................327 B. Standards ................................................................327 C. Irradiation and Gamma-Ray Measurement ...............................328
I11.
Application .....................................................................333 A. Instrumental Neutron Activation Analysis (INAA) ......................333 1. Human Organs and Tissues ......................................333 a. Liver .....................................................333 b. Other Tissues .............................................333 c. Hair ......................................................334 2. Human Body Fluids .............................................336 a. Blood .....................................................336 b. Urine .....................................................337 c. Amniotic Fluid ...........................................337 d. Milk ......................................................337 3. Medicalscience .................................................338 4. Animal Tissues and Body Fluids .................................339 5. Botanical Materials ..............................................341 6. Short-Term Irradiation NAA .....................................341 B. Epithemal Neutron Activation Analysis (ENAA) .......................342 C. Fast Neutron Activation Analysis (FNAA) ..............................343 D. Instrumental Photon Activation Analysis (IPAA) ........................344 E. Charged Particle Activation Analysis (CPAA)...........................345 F. Radiochemical Neutron Activation Analysis (RNAA) ...................345
References.............................................................................. 349
324
Activation Analysis
I. INTRODUCTION Most of the elements are present in variable amounts in all living organisms. Of these, a large number of elements occur in living tissues in such small amounts that their precise concentrations could not be measured with the analytical methods formerly avai~abl~. They are frequently described as trace elements. No clear line of demarcation, fitting all elements in all circumstances, can be drawn between trace and major elements. Those elements that occur or function in living tissues in concentrations conveniently expressed in micrograms per gram or micrograms per milliliter are generally considered as trace elements. At present, 26 of the naturally occuring elements are known to be essential for animal life. These consist of 11 major elements and 15 elements generally accepted as trace elements, F, Si, V, Cr, Mn, Fe, Co, Ni, Cu, Zn, As, Se, Mo, Sn, and I. Essential elements are always present in tissues participating in the metabolic reactions of organisms. Nonessential elements present in traces can be regarded as impurities in the organisms due to exogenic factors, and they accumulate or squeeze out chemically similar essential elements. But a classification of the trace elements into essential and nonessential or toxic groups may be inaccurate and misleading. All essential elements become toxic at sufficiently high intakes, and the margin between levels that are beneficial and/or harmful may be determined by the homeostatic capacity of animal species and of living systems of those. The toxic property of those such as F and Se were well demonstrated before they were shown to be essential nutrients. It would not be surprising, therefore, even if some of the trace elements now regarded as toxic elements or contaminants, such as Ge, Br, Sr, and Cd, are added to the essential element list by the further refined and developed experimental techniques. The analysis of trace element concentration of the materials in the biosphere has been done on a large scale in many countries. A large number of techniques, each with their own modifications and improvements, has been applied. A variety of methods creates serious difficulties when attempts are made to compare the values analyzed for trace elements. It is impossible to know whether the reported differences represent the true variations in individual samples or' if they reflect differences from the methods used. At very low concentration levels, the difference due to methodological errors can lead to quite erroneous conclusions. d At present, activation analysis, especially neutron activation analysis in both its instrumental and radiochemical techniques, is an important method for the in vitro determination of trace elements and is widely applied to many kinds of materials in the biosphere. Although it is difficult to quote well-documented data on the actual numbers of determinations done, the increasing importance of activation analysis, which has many decisive advantages, has been well recognized on trace element analysis of a variety of biological materials.'-'1 The number of applications every year is enormous. We cannot search all these publications in the journals or reports for the broad biological field. Chemical Abstracts or International Nuclear Information System may help the reference citation when the publication is a less-accessible journal or report. The international conference series entitled, Modern Trends in Activation Analysis and Nuclear Activation Techniques in the Life Sciences deal with all aspects of contemporary activation analysis and are very useful to bridge the gap between life scientists and analytical chemists.
11. ACTIVATION ANALYSIS A. SAMPLING AND SAMPLE PREPARATION 1. Characteristics of Biological Sample The biological materials, typically referred to as living tissues, have specific characteristics which bring forth many problems in sampling and preparation steps for activation analysis. These are
Volume 11 1. 2.
3. 4.
5. 6.
325
Materials available for analysis are often limited with respect to their amounts, and it is almost impossible to reproduce the desired specimen ad libitum. In many cases, collection of a series of samples with definite history for a specific group is difficult from a social or ethical point of view. The biological materials except for hard tissues contain a large amount of water ranging 70 to 80%. The living tissues and organs consist of complex components, such as protein, fat, blood vessels, membrane, body fluids, etc. In the sampling of specimens, anatomical knowledge and techniques are required in addition to the analytical considerations. Collected living tissues change rapidly in various manners with the lapse of time, for example, coagulation of blood or autolysis of brain. The abundances of elements with atomic numbers lower than Ca are degrees of percent order, while the other elements are generally present in extremely low abundances, ppm levels or less.
Sampling and sample preparation are thus the most important procedures prior to activation on biological materials. Behne has shown that the analytical errors for the elements of interest following the degeneration were caused in sampling and sample preparation of tissue^.^ Iyenger and c o - w ~ r k e r srevealed ~,~ the postnatal changes, such as cell swelling, inhibition, and autolysis, on the elemental composition of rat liver as an example. It is necessary to standardize the sampling time and storage conditions for autopsy samples. In activation analysis, if the sampling and sample preparation are processed successfully, it may be said that this analysis will be almost finished. For successful work, close collaboration between the analyst and biomedical or life scientist is necessary. If no due function between the both is done, the elemental determination in arbitrarily selected materials may lead only to an accumulation of largely useless data. A standardized guideline on sampling and sample preparation should be designated. For the ultra-trace element analyses, the adequate contamination control procedures should also be previously developed. The advisory group of the IAEA examined the possible sources of errors arising in application of neutron activation analysis to biological materials and attempted to recommend the practical and effective means to avoid them.' The topics discussed here are very helpful for the practical applications. Some significant items on sampling and sample preparation, mainly for living tissues, will be stated individually.
2. Sampling and Sample Preservation Living tissues will, in general, be collected by a pathologist, who, unlike the analyst, may not be fully aware of the need for analyst and life scientist to co-operate in sampling. A guideline for sampling procedures according to the materials will help to minimize the variabilities due to this source. The problem of nonuniform distribution of elements in tissues should also be recognized and the specimens sampled should be representative of the organ or tissue. The whole organ or the maximum available fraction of it should be collected to reduce the effect of the natural variability of elements in tissues. Quartz- and plastic-made tools and implements are basically recommended. These instruments for sampling and sample preparation are acid-washed and cleaned with high-purity water. The titanium knife is also recommended by the NBS and the IAEA. Stainless-made tools can also be used only except in direct contact with subject. Versieck et al.5eported that needle biopsies are heavily contaminated by numerous trace elements, and a steel surgical blade is still not acceptable for the determination of some trace elements, especially chromium and nickel. The contaminations from the devices commonly used for blood collection were investigated.' Although the transfer of copper and zinc is negligible, the most important contaminations for a variety of elements were found in the first 20-ml samples. In the case
326
Activation Analysis
where doubts exist as to contamination of the specimens at collection, the outer surfaces of the samples should be removed and a cortical membrane of organ may be useful to prevent the contamination in sampling and following preservation. Except for such biological samples as some kinds of plant materials, living tissues are generally liable to change rapidly in quality. Care also should be taken of the change in elemental composition in autopsy tissues by elapse of time. The living tissues, the water and body fluids wiped out with filter paper, should be stocked immediately in a deep freezer ( - 20°C or below) until following sample preparation. The materials are doubly enclosed in polyethylene bags. It is necessary to pay attention to the possibility of losses of volatile compounds even during storage at low temperatures.' Tissues autopsied for a pathological study are often preserved in 10% formaldehyde solution, but the preservation in this solution elutes many elements. No chemical fixatives should be used and samples should not be rinsed with water or any other medium, nor should they be pierced with a metal instrument. Such body fluid samples as milk, blood, or urine, if obtained in large volume, should also be frozen or freeze-dried in some cases for subsequent treatment. Fluid samples in small amounts are penetrated into a filter in the form of a disk which is then dried. Materials such as beans and seeds enclosed in natural bag can avoid external contamination prior to irradiation by postirradiation removal of bag. 3. Homogenization
Homogenization is the essential procedure, especially for samples of bulk, to obtain the representative specimen because of the complex structure of sample, the distribution of different constituents, and the different size and form of the constituents in biological materials. The nature of biological materials makes homogeneity evaluation difficult, as typically suggested by the inhomogeneities of Cr and As in the NBS bovine liver. No problems arise when a little sample is directly enclosed in an irradiation material. The problem of contamination from blenders has been well known, and when the tissues with different physical properties are present in one sample as a whole fish, homogenization is also particularly difficult by conventional means such as a blender. An apparatus for homogenization and drying of biological materials at nitrogen temperature was constructed.'O The versatile procedure for various biological materials has been developed by Iyenger." This brittle fracture technique (BFT) has been successfully applied to bone" and living tissues12and has been recommended by the IAEA for the preparation of autopsied samples. For example, hair sample is placed in a TeflonB-container along with a TeflonB ball. The container is cooled in liquid nitrogen for 3 min and then vibrated at 3000 clmin for 2 min. Fine hair powder is obtained by repeating this procedure a few times. A contamination from Teflonmwas F and to a certain extent Li. When the F or Li analysis is desired, a pure quartz of Sb and Si. After the technique was modified, the BFT was used to handle kilogram-size samples.13In assessing the degree of homogeneity of bulk sample, the homogeneity test for reference materials is suggested.l4 4. Drying
Drying is also an important procedure in sample preparation of biological specimens, especially for living tissues. Autopsied materials should be immediately dried since the wet weight changes in preservation in a freezer. Some common procedures employed for this purpose include ventilation-, oven-, vacuum-, or freeze-drying, and also wet and dry ashing. All these techniques are apt to introduce error. An available procedure should be selected with great care as to contamination and loss of trace elements, and be chosen according to the various chemical properties of elements of interest, to the major elemental composition of matrix, and to the nature of sample. Ventilation-drying by filtered air is reasonable to such samples of low water content as washed hair and some kinds of plant materials. Although
Volume 11
327
a preirradiation ashing can concentrate the elements at very low content in sample, this method should be avoided as much as possible with respect to contamination or loss. Ovendrying under different temperatures does not always lead to constant drying. Constant weight cannot always be obtained on biological soft tissues since there may be a continuous slow loss of organic matter as well as water, even at temperatures near to 100°C. Heat-drying also has the disadvantage of loss of volatile elements. Iyenger et a1.I5.l6have studied drying by an oven and lyophilization. Although oven-drying at 80 to 120°C is a quick and simple procedure, the loss of Hg, I, Sb, and Se has been observed even at low temperature. Freezedrying of rat soft tissues is found to be generally safe with respect to these elements in question in biological study. The only approved drying method is lyophilization in which a frozen sample is dried for at least 24 h using a cold trap at or below - 50°C and at a pressure not greater than 30 Pa (0.2 mmHg). This procedure is applicable to all kinds of biological samples. A material in a desicator containing P,O, is dried under moderate conditions and this method is preferable to all biological material, while it is time consuming. Dried sample is preferably stored in a plastic package under the condition of darkness by refrigeration for the purpose of the protection from photochemical reaction and microorganisms. In publications, trace element concentrations are expressed in various manner of units, micrograms per milliliter for liquids and micrograms per gram based on dry and wet or even ash weight for solid materials. This leads to confusion in comparison between the individual results from different laboratories. Although a modification between the results on different weight bases is applicable for various organs and tissues by the information on Reference Man,'' the conversion ratios are not always accurate nor available for all cases. Wet weight is the weight at sampling and can be changeable according to the time of elapse from sampling or preservation conditions. In many different drying procedures for biopsy samples, lyophilization is recommended; the expression on dry weight bases by lyophilization may be advisable and the results determined are also desirable to be reported along with wet-todry weight ratio. The ratio of dry weight to wet weight is preferable, if possible with respect to quantity of sample, to be determined with the separate aliquots not actually used for analysis.
5. Preseparation Prior to Irradiation Preirradiation separations in NAA may be classified into two cases: the first aim is the removal of interfering elements to concentrate the elements of interest, and the second is to differentiate the matrix into cell constituents. The introduction of these preirradiation procedures loses one of NAAs main advantages. It is difficult to prove that no losses nor contamination have occurred at low concentration levels and, if so, to correct them. These procedures should be avoided as much as possible. But, the removal of interfering elements, for example iron in the determination of Cr and Mn in whole blood, is possible to concentrate the analytes and to improve the sensitivity, selectivity, and accuracy. An additional advantage is the case of the short-lived radionuclide determination, in which it cannot allow sufficient time for separation after irradiation. For the purpose of achieving the fractionation of cell constituents and obtaining the chemical species of interest, preirradiation separations are unavoidable. Many rigid controls of loss and contamination sources before irradiation are required. Some identified major contaminations which originated from the chemical reagents and equipments used in biochemical preparations for NAA are given by Behne et a1.18 and Pietra et a1.19
B. STANDARDS In determination of elements, the relative method, in which sample and standard are irradiated simultaneously and their activities are measured under identical conditions, has been easily applied. Comparative standards used in the relative method have been well
328
Activation Analysis
worked in the determination of only one or a few elements. However, for multielement determination, there have been many kinds of serious limitations in use, the laborious preparation, the problem of the stability during storage, and the danger of loss of the volatile elements. Some comparator methods have been approached for the determination of multielement analysis in biological r n a t e r i a l ~ . ~These ~ - ~ *methods require the detailed knowledge of the reactor constants and the accurate values of nuclear constants. These limitations are impractical in most laboratories. Use of the well-characterized standard reference materials (SRMs) overcomes these limitations being attendant on above-mentioned methods. The SRMs have been originally provided to check various analytical methods and, at present, have been useful as the common and convenient multielement comparative standards. They allow simple drying, indefinite stability during storage, and homogeneity better than ? 1%. They are readily available in sufficient large amounts for subjects of the various biological materials. The biological SRMs available are listed in Table 1 which is mainly based on the compiled data by Muramatsu and However, as can seen from Table 1, few SRMs give the certified values for many kinds of elements of interest in biological field. It is also true that the uncertainties in the certified values are too large for many trace elemenkZ4 As alternative reference materials, some of these type have been introduced, phenolformaldehyde resinzs and gelatin.z6Suzuki et al.27have developed a new synthetic multielement reference material with polyacrylate-acrylamide gel matrix, which is prepared by copolymerization reactions of homogeneous aqueous solutions of a mixture of acrylic acid and acrylamide containing known amounts of the elements of interest. The matrix is analogous to those of biological material, and their composition can simulate the biological samples to be analyzed. This powdered material has solved the problems of the homogeneity and stability of elements during long-term storage. The retention of such volatile elements as As, I, and Hg has been ascertained.
C. IRRADIATION AND GAMMA-RAY MEASUREMENT Although charged particles and photons have been applied to the irradiation of biological materials, activation on the (n,y) reaction by thermal neutron is at present predominant. Neutron irradiation is carried out generally in reactor at a thermal neutron flux of 1012 to 10'3.n-cm~2-s-'.The experimental sensitivities of short- and long-lived thermal neutron Irradiation time may be decided in activation products of 32 elements were ~ompared.~' consideration of the activities of the product nuclides of interest, and for multielement analysis two kinds of time, short and long irradiation, are, for practical reasons, selected. Irradiation, decay, and counting times for typical biological material are given in Table 2 along with the possible competing reactions on the (n,p) and (n,a) by fast neutron. The extent of interference depends on the fastlthermal neutron flux ratio in a reactor. The interference factor (IF) may be expressed as a ratio of the activities by thermal and fast neutron as expressed below,
IF
=
M,
. F,
Mi ' F o
a,. 4,
. . 4th (+ch
where, M and F denote the atomic weight and the isotopic abundances, and the subscript o and i indicate element of interest and interference element, respectively. and a,? are the average cross-section for nuclear fission neutron spectrum and the thermal capture crosssection. +J+,,is a ratio of thermal to fast neutron flux of a reactor used. The IF, calculated on the assumption that +J+,,is 116, is given on the respective reactions in parentheses in Table 2. The underlined interference reactions must be considered in analysis at ultra-trace level.
Volume 11
329
TABLE 1 List of Biological Standard Reference Materials According to Type of Materials Material 1. Body Fluids Blood Animal Human
Milk powder
Supplier
IAEA BCR BI KL
Code No.
A-13 CRM-194 OSSD Contox No. 0100
ARCICL CRM-063 BCR
Remarks
Elements"
Br Ca Cu Fe K Na Rb S Se Zn Cd Pb Cd Cr Hg Pb Pb Ca Cd Cu Fe Mg Mn Mo Se Zn Ca Cd C1 Cu Fe Hg K Mg N Na P Pb Ca C1 Co Cu Fe Hg K Mg Mn Na P Rb Se Zn Ca Cd CI Cr Cu Fe Hg I K Mg Mn Na P Pb S SeZn
Freeze-dried, normal levels CRM-195, -196, mgll OSSE(Cd Hg Pb), mgll Pb control (high, low, med) No. 0141 (As Cd Hg), mgll Non-fat CRM- 150, - 151 (spiked) Environmental levels
IAEA
A-1 1
NBS
SRM-1549
Serum Bovine
NBS
RM-8419
Human
KL
Contox No. 0146 SERONORM Ca C1 Cu Fe K Mg N Na P Zn ( 164) As Co Cr Cu F Hg Ni Pb OSSA Contox Pb No. 0110 SRM-2670 SERONORM (108)
mgll
H-5
Normal levels
IAEA
H-4
Normal levels
Bovine liver
NBS
SRM-1577a
Horse kidney
IAEA
H-8
Human hair
NIES
CRM-5
NYE Urine
B1 KL NBS NYE
2. Other animal and human tissues Animal bone Animal muscle
IAEA
Al Ca Co Cr Cu Fe K Mg Mn Mo Na Ni Se Zn Cu Fe Zn
mgll
SERONORM(IO5) (Se). mgll OSSB, OSSC, mgll Pb control (high, low, med) No. 0140 (As Cd Hg), mgll Freeze-dried, spiked mgll
ARCICL
3. Marine animals NBS Albacore tuna Dogfish muscle NRC
RM-50 DORM- I
Copedod
IAEA
MA-A- I
Fish flesh
IAEA
MA-A-2
Lobster
NRC
TORT- 1
Mussel
NIES
CRM-6
Mussel tissue
IAEA
MA-M-2
Br Ca Cd CI Cu Fe Hg K Mg Mn Mo Cd-Human levels Na P Rb Se Zn Ca Cd Cr Cu Fe Hg K Mg Mn Na Ni Sr Zn As Hg Se Zn As Cd C1 Co Cr Cu Fe Hg K Mg Mn Na Ni Pb Se Zn Ag As Cd Co Cr Cu Fe Hg Mn Ni Pb Sb Se Zn Ag As Cd Co Cr Cu Fe Hg Mn Ni Pb Sb Se Zn As Ca Cd C1 Co Cr Cu Fe Hg K Mg Mn Mo Na Ni P Pb S Se Sr V Zn Ag As Ca Cd Cr Cu Fe K Mg Mn Na Ni Pb Zn As Br Ca Cd Co Cr Cu Fe Hg Mg Mn Na Rb Se Sr Zn
Dogfish liver (DOLT-1) Environmental levels Homogenized
Homogenized
List of Biological Standard Reference Materials According to Type of Materials Material Oyster tissue
4. Aquatic plants Aquatic plant Chlorella 5. Other plants Citrus leaves
Code No.
NBS
SRM-1566
BCR NIES
CRM-060 CRM-3
NBS
SRM-1572
Elementsa
Remarks
Ag As Ca Cd Cr Cu Fe Hg K Mg Mn -ble grade lobster tomalNa Ni Pb Rb Se Sr U V Zn ley homagenate
Cotton cellulose IAEA
V-9
Hay powder
IAEA
V-10
Kale
BOWEN
Bowen's Kale
Olive leaves Pepperbush
BCR NIES
CRM-062 CRM-I
Pine needles
NBS
SRM-1575
Potato powder Rice flour
ARCEL NBS
SRM-1568
Rye flour Tomato leaves
IAEA NBS
V-8 SRM-1573
Wheat flour
ARCICL NBS
SRM-1567
Al As Ba Ca Cd Cr Cu Fe Hg I K Mg Mn Mo Na Ni P Pb Rb S Sr Zn Ba Ca C1 Cr Cu Hg Mg Mn Mo Na Environmental levels Ni Pb Sr Ba Br Ca Cd Co Cr Cu Fe Hg Mg Environmental levels Mo Ni P Pb Rb Sc Sr Zn A1 As Au B Ba Br C Ca Cd C1 Co Cr Cs Cu F Fe Ga Hg In K La Mg Mn Mo N Na Ni P Pb Rb S Sb Se Si Sr Th U V Zn Cd Cu Hg Mn Pb Zn As Ba Ca Cd Co Cu Fe K Mg Mn Na Ni Pb Rb Sr Zn AlAsCaCrCuFeHgKMnPPb RbSrThU Ca Cd Cu Fe Mg Mn Mo Ni Pb Zn As Ca Cd Co Cu Fe Hg K Mn Na Pb Se Br Ca C1 Cu Fe K Mg Mn P Rb Zn Environmental levels AsCaCrCuFeKMnPPbRbSr Th U Zn Ca Cd Cu Fe Mg Mn Mo Ni Se Zn Ca Cd Cu Fe Hg K Mn Na Se Zn
NBS BCR
SRM-1569 CRM-273
Cr CaFeKMgNP
6. Others Brewers Yeast Single cell protein "
Supplier
The certified or recommended values are available.
A polyethylene bag as an enclosing material is adequate to integrated neutron flux of -10'7-n-cm-2. Sample is heat-sealed into a polyethylene bag. Aluminum and vanadium in polyethylene are main impurities in analysis by short-term irraaiation. Iron, scandium, and zinc are observed in long-term irradiation. These impurities can be generally neglected in the determination of biological materials, but a blank test is desirable for the determination of ppm level or less. Although polyethylene is easy to use, highquality quartz ampule is used at the irradiation by higher integral neutron flux. The ampule should be previously cleaned by boiling in aqua regia and washing with distilled water. It contains impurities, K, Na, Sb, and Sc, in question for biological materials. It is recommended to previously analyze the impurities in enclosing materials used. After irradiation, quartz ampule is allowed to decay to minimize the activities induced from itself. It should be washed by HNO, if it is counted nondestructively, and if not so, it is cooled to liquid nitrogen temperature to lower the internal gas pressure due to the radiolysis of organic substances and to retain the volatile elements. Iyengar3' investigated the loss of sample weight due to the matrix decomposition of blood components and milk during long-time irradiation. A loss of sample weight up to 11% on 5 d after irradiation was observed.
Volume 11
331
TABLE 2 Nuclear Data,30Analytical Conditions, and Interfering Reactions of Biological Materials on NAA
Element Na Mg A1 Si S C1 K Ca Sc
v Cr Mn Fe Co NI
Product nuclide 24Na *'Mg =A1 31S~ "S 4ZK 49Ca 46Sc Z 'V T r 56Mn 59Fe @Co "NI TO
Cu Zn Ga Ge As
Se Br Rb Sr Mo Cd Sb
I Cs Ba Au Hg
%Cu 6'Zn 72Ga 77Ge 76As 15Se "Br "Rb n7mSr %Mo%"Tc 115~du51n IZzSb '24Sb 1281 I34Cs "'Ba 19RA~ 2"3Hg
Half-life 15.02 h 9.46 min 2.24 min 2.62 h 5.0 min 37.3 min 12.36 h 8.72 min 83.8 d 3.76 min 27.70 d 2.58 h 44.6 d 5.27 years 2.52 h 70.8 d 5.10 min 244.1 d 14.10 h 11.30 h 26.3 h 118.5 d 35.34 h 18.8 d 2.80 h 66.02 h 53.4 h 2.68 d 60.20 d 24.99 min 2.06 years 82.9 min 2.70 d 46.8 d
Analytical 'Y-ray (keV) 1369 1014 1779 I266 3103 1642 1525 3084 889 1434 320 847 1099 1173 1482 81 1 1039 1116 834 265
Interfering reaction 24Mg(n,~), 27Al(n.u) "Al(n,p) (1.4E-I) '%i(n,p) (3.9E-3), "P(n,a) (1.2E-3) 31P(n,p)(1.6EO), 34S(n,u)(4.OE-3)
559
265 776 1077 388 141 336 564 1691 443 796 166 412 279
Note: Analytical conditions are signified as follows. 1. t, = 1 to 10 min, t,,,,, = 1 to 2 min,,,,,,t = 2 to 5 min. 2 . t , = 2tolOmin,t,,, = 1 h , t, ,.,, = 10min.3.t,, = 1 0 h , t = 5 t o 8 d , t = 1 t o 2 h . 4 . = 30 d, t,,,,, = 3 to 5 h. Radiochemical separation is desirable in case of (RS) and is t,, = 10 h, t,",
,,,,
,,..,
necessary in case of RS in most of the samples.
Because the activities from biological samples are in general very weak, samples are often measured under a condition of close adhesion to a detector. At short sample-detector distances, the efficiency becomes very sensitive to the variations in the distance or in the sample dimensions. Constant counting condition among the samples is, therefore, required. When samples are irradiated in the pellet in a diameter of 10 to 12 mm, this form is effective to obtain geometrical constancy in gamma-ray measurement. Bremsstrahlung produced by high-energy P particles, for example by 32P,can be reduced considerably by surrounding the sample with absorber of low Z material such as acryl. Typical gamma-ray spectra of human liver irradiated with thermal neutrons are shown in Figure 1.
332
Activation Analysis
99 UZES
-
9111
+
--
X - O Z L
Bjgs 6601 quse LLOL
.-
=--I
3
( 3 a ) wVz
LPE P 3 5 , ~ 9EE )Iz* ELE
Wcoz
+
@ S s r 8LZ essl S 9 2
.t I
)
f
, I
(U
13,s
(U
m
OZE
7 t
(UE (U
&j
Z
E
..
m
Volume 11
333
111. APPLICATION Because of the high sensitivity and versatility in addition to its multielement capability, thermal neutron activation analysis has been successfully applied to many kinds of biological materials. It is impossible to summarize all research on biological materials ever done by INAA, since the applications of NAA in this field have been multitudinous ever since the 1970s. The publications selected in this section mainly outline the publications on INAA.
A. INSTRUMENTAL NEUTRON ACTIVATION ANALYSIS (INAA) 1. Human Organs and Tissues Trace element researchers have been interested in the concentrations of trace elements in nearly every human organ or tissue and body fluids. The elemental composition of the human tissues and body fluids were compiled in the work by Iyenger et al.' The importance of essential elements has been recognized as well as the toxicity of some elements. A variety of elements are closely related to human health and disorder. A meaningful understanding of trace element requirements in human metabolism and health depends on the determination of the concentrations of trace elements in body tissues and fluids. NAA as a multielement technique has covered a substantial part of the research on the first step determining the contents of elements in normal healthy individuals and thereby on the correlation with disorder or diseases. Heydorn2 presents the recommended concentrations for a number of trace elements in a variety of human tissues and blood, and Cornelis3+eviewed the detailed recent investigation on NAA.
a. Liver Liver is physiologically a very important organ and has drawn most of the attention of trace element researchers. Many publications dealt with this organ to aim the multielement determination by NAA. Liver contains a variety of trace elements with high contents compared with the other organs or tissues. The normal concentration levels of trace elements in healthy human liver obtained by NAA are presented in Table 3, which is based mainly on the data by RNAA from Lievens et al.3' with additional data on INAA. They analyzed 25 trace elements in 8 segments of each of 5 normal human livers. The results showed a marked homogeneity for the elements Cd, C1, Cu, Fe, Mg, Mn, Rb, Se, and Zn since their CV are smaller than 10%. The highest range observed for the elements As, Br, Co, Cr, Hg, La, Mo, Na, and Sb within a liver is smaller than the range observed among the five livers. Persigehl et al.s8 pointed out that the concentrations in the normal individuals as well as in the different organs are not always fixed values and depend on age, if the subjects were in good health, and if the samples were treated with no contamination or loss. The contents of Co, Cr, Cs, Fe, Rb, Sb, Sc, Se, and Zn increased in liver with age. Trace element concentrations may be also affected by food intake and environmental factors. Tijoe et al.3' discussed the rare-earth element (REE) distribution patterns in human liver and other tissues. An interesting phenomenon, a reduced retention of the heavier REEs in the liver or an increased retention of the lighter REEs that may be related to the specific metabolic function of this organ, was reported. These findings were not observed for aorta, heart and kidney.
b. Other Tissues Attempts have been made to determine simultaneously the normal concentration of multielements in a variety of human organ and t i s s ~ e s . The ~ ~ .representative ~~ studies for the other tissues are presented in Table 4. Trace elements are not always distributed homogeneously in tissues. This heterogeneity results from the functional differences in different parts of organ or tissue. The higher content of Cd in the cortex than in the medulla of kidney is well recognized, and Damsgaard et a1.49
334
Activation Analysis
TABLE 3 Reference Values of Trace Element Concentration in Human Liver Element (unit)
n
Mean
Range
Ref.
2.3-12.3
33
As (ppm)
5
6.5
Au (ppb)
11
0.16
Br (ppm)
5 18
2.06 3.22
0.72-7.12 2.3M.54
33 34
Cd (ppm)
5 15 18
2.61 1.49 7.61
0.81-7.14 0.1145.2
33 36 34
23-39 29-61
33 34
CO (ppb)
Cr (ppb)
Cs(ppb)
5 18
34 48
5 15
5.4 40.7
Range
Ref.
20 14
3.143
33 36
171 220
148--173 137-288
33 34
1.41 1.79
1.07-2.12 0.962.93
33 34
0.37 0.71
0.16-4.72
33 36
4.86 6.8
2.9-6.3 3.9-6.3
33 34
11
2. &20
13.4
2.5-17.7
33 34
36
2.2-10.1
33 36
5 18
11.8 13.5
5.7-25.0 4.0-16.0
33 34
Cu (ppm)
5 18
7.4 9.0
4.6-8.4 3.8-30.2
33 34
Fe (ppm)
5 18
205 226
21450 32-5 12
33 34
5 18 3
77 131 56
55-108 22480 33-93
33 34 35
Hg (ppb)
Mean
0.26 0.27 0.60
0.22-0.33 0.31-0.97
33 36 34
7.0
2.5S13.4
37
59.0 56.2
52.5-46.0 30.4--108
33 34
Note: Unit is based on wet weight.
also showed that kidney tissue is very heterogeneous, as far as Se and Zn are concerned. Brain is a most complex and highly specialized organ in the body. NAA has been applied in studies on the topographical distribution of trace elements in the different regions of brain. The concentrations of Fe, Rb, and Zn were found to differ significantly between defined functional regions and to relate to metabolic functions associated with these region^.^' Distinct patterns of distribution were also shown for As, Mn, and Se.41Markesbery et aLS8revealed several different patterns in the concentrations with aging. The concentrations of Al, C1 and Na increase with increasing age, while those of K, P and Rb decline. For Ag, Co, Fe, Sb, and Sc, the increase up to the 40 to 79 age range and then the decline were observed. Bratter et a1.43showed that the trace elements are distributed in varying degrees within a bone and throughout the skeltone their variation seems to be related to the functional and structural conditions of the sampling site. c.
Hair
Hair can be readily collected from individuals and can be easily handled. Many researchers have also been interested in human hair as a biopsy material. To date, a considerable amount of data on trace elements in the hair of normal healthy populations have been reported by researchers in more than 20 countries.59In total, 40 elements were determined. RyabukhidO drew some preliminary conclusions comparing the compiled data. The trace element distribution profiles within several segments of human long hair were in~estigated.~]
Volume 11
335
TABLE 4 Applications of NAA for Various Human Organs and Tissues Organ or tissue
Brain
Bone
Dental tissue Eye Kidney
Method
Elements
RNAA ENAA INAA INAA INAA INAA ENAA INAA INAA RNAA INAA INAA
As Mn Se Ag-Zn(l8)
Ref.
41 42
Ba-Zn(25) Ag-Zn(l1) Co-Zn(8)
Topographical distributions in 24 brain areas Roles of trace elements in Alzheimer's disease and in aging Iliac crest of 69 ancient skeletons, normal levels Skeletal diseases patient and control 9 sections across the tibia
Co-Zn(5)
Ecological area, stomatological operation condition
46
Co-Zn(7) Ag-Zn( 14) Se Zn
Normal and different types of senile cataractous lenses Relative distribution of trace elements in various tissues Difference in the concentration between cortex and medulla Normal level of trace elements Elemental homogeneity in tissue, accumulation by inhaled dust Summary of literature data of 31 elements Distribution of elements for normal and disease tissues Positive correlations for each elements Trace element distribution in normal tissue, Menkes disease Normal skin, benign and malignant lesion, tissue contamination
47 48 49
Nail Pancrea Pineal body Placenta
INAA INAA RNAA INAA INAA INAA RNAA
Au-Zn(7) Co-Zn(7) Ca-Zn(8) As-Zn(5)
Skin
INAA
Cu Mn Zn
Lung
Remarks
Br-Zn( 13) Au-Zn(22)
43 44 45
50 51
52 53 54 55 56
Today, hair analysis trends toward two main circumstances. One intention is to evaluate the environmental exposure. Hair has a property to adsorb and retain trace elements from its environment on its surface. The great efforts have concentrated on using hair as an indicator to assess the degree of exposure to the environmental trace element pollution.h2h5 Another focuses on the question of whether hair is an effective index of the burden of elements within human organs or tissues and whether it gives a correlation between a certain clinical symptom and the trace element content in it. Hair is one of the metabolic final products which, owing to its growth, reflects the biomedical history of an individual. The higher Hg content in head hair of dentists and persons who consumed mercurycontaminated fish are until now well recognized. The level of Hg in hair reflects the mercury intake with foods even under normal conditions. Figure 2 presents the contents of Hg in normal human hair, liver, and kidney. It appears that hair can be regarded as a sensitive indicator of the mercury accumulation in kidney. In order to discuss the significance for the other element pollution in the body, it is necessary to know the distribution of various elements between hair and critical organs. The applications of hair analysis with diseased patients are described in the item of medical science. There is the problem of washing in hair analysis. It appears questionable whether a removal of the external contamination by the IAEA washing procedure is perfect for hair analysis in assessment of the internal body burdens. Although the IAEA procedure may be considered as adequate in monitoring the trace elements in hair from the environmental exposure, it showed the leaching of some elements from the interior of the materia1.59.65A more detailed examination of the washing procedure should be studied with respect to the degree of the removal of exogeneous elements as well as to the degree of retainment of endogeneous elements. Multielement analysis of advantage on NAA becomes a complicating factor, since it cannot be expected that a particular washing procedure will be adequate for all elements and for the various ways of contamination.
336
Activation Analysis
Hg in hair ( u g l g ) FIGURE 2. Relationships between Hg concentration in hair and liver and kidney; 0,Reference 66; a, Reference 67.
2. Human Body Fluids a. Blood Whole blood is constituted of various components, serum, red and white blood cells, platelets, etc. Since serum is the primary transport medium that canies nutrients to the metabolizing cells and removes their metabolites,the majority of the publications deal with -~' and C o r n e l i ~reviewed ~~ the trace element concentrations in serum and p l a ~ m a . ~ *Versiek the normal levels of 18 trace elements in human blood plasma or serum. The report by W~ittiez'~ deals with the studies on the role of trace elements in human health and disease
Volume I1
337
and also gives the composition of literature data for elemental contents obtained by NAA in human serum. Trace elements in erthrocytes can also similarly be determined with INAA.74 The concentrations of 14 elements in platelets have been reported by Iyengar and cow o r k e r ~ , ~who " ~ ~ investigated with great efforts the avoidance of the contamination in sampling and sample preparation of platelets for trace element analysis. Ward and Ryan77 determined the concentrations of 27 elements in whole blood, in which Al, Ba, Br, Ca, Cu, I, Mg, Mn, Mo, Rb, and V were irradiated after a removal of Na by HAP. Mosulishvili et al.7nand Lin79 instrumentally analyzed multielements in human whole blood. Mosulishvili et al. drew the conclusion that for most essential elements, the intervals of age-dependent concentration variations were rather smaller; on the other hand, for several rare-earth, e.g., La and Tb, the tendency of element accumulation with age should be noted. One of the important problems in the analysis of trace elements at very low levels in blood is the interfering reactions. In the analysis of A1 and As, the contributions from the 28A1and 76Asproduced by the ( n p ) reaction should be taken into account. It is also impossible to determine accurately the contents of Cr or Mn in whole blood without the correction due to the contribution from the 54Fe ( n p ) 5'Cr or 56Fe (n,p) 56Mnreactions. Few publications have investigated these effects on analysis of whole blood. The contributions by the respective reactions using the Fe concentration in whole blood' are calculated, in a neutron flux of loL2order, to be equivalent to 3.5 ng for Cr and 5.4 ng for Mn.
b. Urine The elemental composition of urine reflects the function of kidneys in regulating the electrolytes and water metabolism of the body. Urine excretes the bulk of As, Br, Ca, C1, Co, F, Mg, Na, P, Rb, etc. Cornelis et a1.80 determined the total amounts of 17 major and trace elements in urine in 24-h collections by INAA and RNAA. The problems in analysis of urine, collection, and sample preparation, and contamination hazards during irradiation were systematically examined in detail. An apparent transfer of Cr from the polyethylene bag was observed. c. Amniotic Fluid Amniotic fluid performs various functions including fetal protection and temperature regulation. Ward et a1.81determined the levels for 30 or more elements in amniotic fluid using RNAA. Some elements showed significant difference in the variations of the element concentrations between normals and the varying gestational periods. The values of Co, Rb, and Se in amniotic fluids with normal pregnancy and with prolonged pregnancy did not show any significant difference, while the zinc values with prolonged pregnancy were significantly lower than those with normal case.82
d. Milk In order to assess the daily intake of trace elements by infants, it is important to obtain detailed knowledge of their concentrations and variations in human milk. Milk is the only source of nutrients during the neonatal period. The levels of trace elements in milk, which are about one tenth of the levels encountered in most of the living tissues, are extremely low.' NAA has been proved to be a most important technique used in the analysis of trace elements in milk. This is well illustrated by the interlaboratory comparison of A-1 1 Milk Powder conducted by IAEA.n3 NAA could contribute to estimate the concentrations of 21 elements in 27 elements for which definite results were received, and contribute to 40% of all results and all results for 7 elements.84 Little information is available on the change in composition of many elements throughout lactation. Dang and co-workersn5radiochemically determined the concentrations of As, Cu, Mn, Mo, and Zn in human milk at different stage of lactation. Except for As, the concen-
338
Activation Analysis
trations of the other trace elements showed a declining trend with the progress of lactation. It is also observed that their levels in breast milk were influenced by food intakes by mothers. They also determined the concentrations of trace elements in breast milk obtained from mothers of two different socioeconomic Significant difference in Zn level was found in the results between two groups. Ten elements, Al, Br, Ca, C1, I, K, Mg, Mn, and Na in human milk were analyzed by INAA which is rapid, simple, and sensitive enough for the determination of these elements." The results obtained were compared with those of two other types of infant diet, infant formulas and cow's milk. The selenium contents in human colostrum and transitional and mature milk were estimated by INAA." The higher values were found in colostrum, and a significant decrease with increasing time post partum was observed. Mature milk exhibited a selenium content of 230 ppb with a range of 90 to 432 ppb dry weight (n = 45). For analysis of major and trace element in cow's milk and the IAEA A-1 1 Milk Powder, both instrumental and radiochemical NAA, for Au, Hg, and Se by the latter, were applied for the determination of 16 element^.'^ The results obtained by NAA were compared with those by AAS and PIXE, subsequently the reproducibility and, therefore, precision for most trace elements by NAA was quite satisfactory.
3. Medical Science Symptoms and progress of diseases are often marked by changes in the elemental composition of body tissues and fluids. It is not always clear whether such changes are cause or consequence of disease, but most medical researchers would agree that it is important to measure them to monitor the progress of the condition. Activation analysis has potentially made an important contribution to medical science, and the importance of it has been increasing. The present state of activation analysis technique has been described in detail in the reviewg0 and in the section of disease at the international symp~siurn.~' Heydron2 presents a detailed survey of trace element anomalies in terms of various diseases. Blood and serum have often been chosen as the objective materials, even though the concentration of an element in blood or serum may not actually reflect its concentration at its site of action. A total of 13 elements in whole blood of cancer patients (breast tumor, Hodgkin's disease, testicarcinoma, and uterine cancer) and controls determined by INAA.92 Statistical analysis showed that, with a very high probability, Co and Fe are lower, and Na, C1, La, and Ta are higher in the cancer patients. Chromium, zinc, and bromine also showed differences between the two groups. Significantly lower levels of Co, Se, and Zn were found in maternal blood serum and cord serum of women with prolonged pregnancy as compared to those in sera of mothers with normal pregnancy.'O The serum samples of the patients suffering from cancer, Down syndrome, and Banti syndrome were analyzed.69The cancer patients had below normal concentrations of Al, Co, Cu, Fe, Mn, Rb, Se, and Zn. The Down syndrome patients were found to have similar deficiencies in Co, Cr, Cu, Fe, Mn, Sb, and Zn. RNAA was used for the determination of Cu in serum and cerebrospinal fluids of schizophrenic patients against controls.93The serum molybdenum concentrations in healthy subjects and in patients with diseases of the liver and biliary system were determined by Versiek et a]." The level was found to be markedly elevated in the initial phase of acute viral hepatitis in parallel with the liver function tests. The significant correlations were found between the serum molybdenum concentration and the serum levels of GOT and GPT. Trace element correlations in hair and tissues have also been studied. The elemental concentrations of 20 elements in head hair of cancer patientsg5and impaired renal functional patients following chronic hemodialysisg6were measured. Significant differences with the cancer patients were observed for several elements, especially for Au, I, and Se. The hair of the dialysis patients contained about ten times more iodine than that of the control group. The contents of 13 elements in hair samples from the controls and diseased infants (Muco Cataneous Lymphnode Syndrome and Acute Hepatitis) were analyzed.97
Volume 11
339
Damsgaard et al.55 determined the trace element distribution in placental tissue and amniotic fluid with special emphasis on Cu in relation to trace elements. There was no significant difference between the concentrations of As, Mn, Se, and Zn in normal placental tissues and tissues from males affected with Menkes disease. The distribution profiles of Co, Cr, Se, and Zn were shown for three parts, such as head, body, and tail, of normal pancreas, and pancreatic cancer and pancreatic calculi.53 Manganese, copper, and zinc in normal skin and benign and malignant lesions were analyzed.56 The significant differences in Cu and Mn concentrations were associated with malignancy or benignity: the average values of Mn in normal skin and in benign and malignant lesions were 0.1, 1.1, and 4.7 pg/g dry, respectively, and the Cu concentrations in malignant sampl.es averaged 308 pglg compared to a value of 4.3 pg/g for normal skin. INAA was applied for the analysis of 19 minor and trace elements in cholesterol-type gallstone.9xGallstone is one of the more common and important diseases. In comparison with the concentration levels of the elements encountered in normal fluids and tissues, the contents of Al, Ca, Cu, I, Mn, P, and S showed very high values. concretion^^^ and renal stonesloo were also analyzed by INAA for 7 and for 12 elements, respectively. The concentrations of 1I elements in human dental calculus were determined.lO' The regional distribution of Cu and eight trace elements was investigated in the brain of a deceased patient with Wilson's disease and compared against a control brain. lo* The copper contents in diseased brains are higher by a factor of 1.9 to 6.2 than the value of a control of 23.2 ~ g / dry g weight on average. For the other elements, neither of these concentrations changed significantly nor decreased in the diseased brain samples. Ehmann et al.42determined the concentrations of 18 elements in human whole brain with Alzheimer's disease. These results indicate a significant increase in the mean values (age matched) for Br, Cl, Co, Hg, and Na, and a decrease for Cs and Rb in Alzheimer's disease as compared to control samples. An interesting application of INAA is the determination of trace elements in human tissues ' ~ ~ tissues of patients after a removal of the hip-joint prostheses made of C o - C r - a l l ~ y s . The with metal implants exhibited a heavy burdening by corrosion product (Co-Cr-Ni) from the prostheses.
4. Animal Tissues and Body Fluids A variety of species of animals have been commonly used as models of the human biosystems in nutritional, physiological, and biochemical studies. Rats and mice have been selected as especially convenient animals for these studies in terms of size, cost, and ease of handling. The elemental composition and variations in these animal tissues and body fluids have also been investigated. In view of the importance of the normal levels of trace elements, Kollmer et a].'" determined the concentrations of nine elements in brain, liver, spleen, uterus, ovary, and feces of rats using RNAA. Thereafter, various organs of rats were investigated by many researchers. These results are summarized in Table 5 along with those of mice. The concentrations of As, Cr, Sb, and Sc were in the magnitude of the detection limits or less in most of tissues. Sato and Katolo6 referred to the effect of the commercial diet intake with respect to trace element contents. MaziCre et a1.lo5determined the variation of the elemental composition of different organ and tissues in terms of age (20 d to 22 months). The more interesting accumulations of Fe in muscles and testis were revealed in addition to renal accumulation of Cd and Hg. In terms of age-dependence, SatoLogalso exhibited the detailed variation pattern of the contents of six elements in various organs of rats during mainly lactation period. Several variation patterns, (1) a steady state without significant variation, (2) accumulation until a steady level, (3) depletion until a steady level, (4) permanent depletion, and (5) initial drop followed gradual increase were revealed in their concentrations as a function of postnatal age. Ohmori and has hi mot^"^ showed the variations of 7 trace
340
Activation Analysis
Volume 11
341
element levels in guinea pig hair from 8 to 33 postnatal weeks. A total of 30 elements in 7 rat brain regions were determined by INAA."' Hypothalamus and hippocampus had higher elemental concentrations than other brain regions. The variations in concentrations of 12 elements in rat and mouse milk were investigated by INAA.Il2 The variation patterns on the progression of lactation day were given for each individual element, and the concentrations of Na, Mg, C1, K, Br, Rb, and I seem to be influenced by ordinary maternal dietary intakes. Both RNAA and INAA methods were applied for 18 elements in H6 solid tumors and livers from control mice and mice with tumors.lL3The concentrations of Al, C1, Cu, Mn, and Se were observed with a significant difference in the livers of the mice with tumors compared to the control group. INAA and RNAA were applied to the determination of trace elements in aquatic animals,'I4 in liver of various wild animal^,"^ mice organ of different inbred strains,Il6 and the new reference materials, shark muscle powder1l7and m u ~ s e l . "KostiC ~ and DraSkovid'19 investigated the distribution of Co, Cr, and Fe in samples starting with water system components, also species living in these systems, and biological tissues from rat and human organs. Czauderna and co-workers have applied INAA for the investigation of the variations in contents of Co, Fe, Hg, Rb, Se, and Zn in various mice organs after injections with selenodiglutathione, seleno-cystine, or NazTeO, in the presence of glutathione or cysteine,Iz0 and with seleno-methione and glutathi~ne,'~' and HgCI, and organic Se-compounds.'22
5. Botanical Materials Plant materials have been mainly analyzed in terms of the assessment of environmental contamination, the distribution of elements related to the composition in soil, and the intake of trace elements from foods. Since the elemental abundances in plant materials generally reflect the geological circumstances, the applications of INAA for these materials have been n~ultitudinousin the last few years. Especially, there are numerous publication^^^^-'^^ about the multitrace-element concentrations in cigarette tobacco from many countries in the world because of the demand for information on the inorganic elements which have been suspected of toxicity in tobacco leaves as well as in tobacco products and smoke. In a recent paper, the retention of the elements in cigarette to the cigarette ash,lZ7the inhalation of the smoke,'2a and the elemental changes in the cigarette filter before and after ~ m o k i n g "were ~ investigated. The recent applications for a variety of the botanical samples are summarized in Table 6 . 6. Short-Term Irradiation NAA As can be seen from Table 2, the radionuclides with half-lives of more than a few minutes have been routinely used in thermal NAA. The use of nuclides with half-lives in the range of a few seconds to 1 min can reduce the total experimental time. Only 10 min or less are required for one analysis including data evaluation, and a large number of samples can be analyzed routinely. This method is also advantageous for biopsy samples which are small and where repeated sampling is difficult or impossible since the samples are not destroyed during the irradiation, but can be used for further tests. Although the difficulties inherent in this method have precluded routine utilization, this method offers the possibility of the determination of many more elements and may expand the applicability of INAA. Guinn and Miller reviewed the advantages and disadvantages of short-term irradiation NAA.'47 They also investigated the applicability for 12 elements (Ba, Br, C1, F, Ge, Pb, S, Se, W, Y, Zr) and determined the contents of Br, C1, Pb, and Se in the National Bureau of Standards (NBS) orchard leaves and bovine liver. The representative application of this method is the determination of Se via 77mSe(T= 17.4 s). The NBS bovine liver and mice organs,I4' fish tissue^,'^'^'^^ and various tissues of
342
Activation Analysis
TABLE 6 Applications of NAA for Plant Materials Material Animal diet Aquatic plant
Crop Food Marine organism Medical plant
Method INAA INAA RNAA INAA RNAA INAA RNAA INAA INAA
Pine needle Seed SRM (tea leaves) Sugar cane
INAA INAA INAA INAA INAA INAA ENAA INAA
Tea leaves Herb plant Rice plant
INAA INAA INAA
Vegetable
INAA
Remarks
Ref.
Comparison with the catalogue values Possibility of accumulation of heavy metals, distribution in different parts Heavy metal pollution in aquatic ecosystem, computerderived analysis of data Tea, ginger, sesame, etc., environmental levels
130 131
Egg plant, potato, green pepper, etc., environmental levels Relation between the composition of the organisms and that of earth crust Distribution in leaves, petioles, rhizome, soil 12 species, environmental levels Roots, leaves, barks Change of the contents in progress of time, rinsing effect Relationship between cultivating conditions and varieties Correction for Na on Mg and Al, for Mg on Al
134
Characterization of pathogenic races of sugarcane smut fungus Transfer into drinkable portion Coincidence counting with Ge(Li) and NaI(T1) Withering disease of low-land rice occuring near iodine plant The control of Br content in vegetable
132 133
135 136 137 138 139
140 141
142 143 144 145 146
miniature swineI5O were analyzed. Wet tissues were lyophilized to remove water. This step greatly reduces the I9O contribution in the range of the 77mSephotopeak and significantly enhances the measurement precision. Serum samples were dialyzed against deionized water prior to lyophilization for desalting.lS0The detection limit for dialyzed-lyophilized serum of 1 ml is 5 ng. The detection limits obtained, 0.03 to 0.08 pg for 24 soft tissues, 0.15 pg for bone, and 0.3 pg for whole blood, are well below the normal Se content of the respective tissues. The results for the NBS bovine liver showed excellent accuracy and precision. Cyclic INAA via 77mSeapplied for the study on the Se contents in six biological SRMs and selenoproteins in bovine kidney.I5' Cyclic INAA through use of short and medium-lived radionuclides has been also applied to the botanical and zoological SRMs for the simultaneous determination of up to 17 elements within a few minutes of experimental time.'52 In this method, the irradiation-decay-counting of a sample is cyclically repeated. The gamma-ray spectrum of each cycle is cumulated to drastically improve counting statistics of the photopeak of interest. The radionuclide 6 6 Cwas ~ used for the determination of Cu in liver biopsies of up to about 5 mg in size.lS3The optimal conditions to minimize the main interference from the gamma rays of 24Naand 38Clwere discussed. The lithium analysis via the 'Li (n,y) 'Li (T = 0.84 s) reaction was investigated for precision, interference, and detection limit.Is4This method was applied to a few biological samples including the Bowen's Kale and the NBS orchard leaves following P-counting with a Cerencov detector beginning at 0.3 s after the end of irradiation. B. EPITHERMAL NEUTRON ACTIVATION ANALYSIS (ENAA) In INAA of biological material, the interferences due to the high activities induced from Br, C1, Mn, and Na which present in much higher concentrations, are imperative. ENAA
Volume 11
343
is an alternative method to solve these problems. A number of elements which are of particular interest from biological point of view, As, Cd, I, Mo, Sn, Sr, etc. exhibit the strong resonance peaks at neutron energies in the range of 5 to 500 eV. On the other hand, as the crosssections in the region of a resonance neutron of the interfering elements are relatively lower compared with those for a thermal neutron, it is expected that the activities of the abovementioned elements would be relatively enhanced in comparison with those of the interfering elements. In ENAA by reactor neutrons, thermal neutrons are filtered out by an absorber with a high thermal neutron absorption cross-section. Until recently, most of the studies have been performed using cadmium as a thermal neutron filter. It is, however, practically disadvantageous because of the residual activity produced from cadmium which may cause a radiation safety problem in both removal of a sample from container and reuse of it for subsequent irradiations. More recently, boron and boron compounds, such as B4C and BN, have been used as a filter. These compounds have some favorable physical properties, enough thermal resistivity and strong resistance to radiation damage, and there are only weakness that the impurities in these compounds are activated. A serious weakness in use of these materials is the exothermic 'OB (n,ol) 7Li reaction, which causes the excessive heat generation within a sample container. It is striking at the irradiation by high flux reactors. This heat accelerates the thermal decomposition of organic compounds in biological samples producing high pressures in a sample container. Chisela et al.'" investigated the heat generation in boron carbide. Alfassi discussed different type of ENAA and their relative advantage^.'^^ Iodine, one of the biologically essential elements which is in very low concentrations in usual biological materials, has been determined by many researchers on various animal tissues,'58 various foodstuff^,'^^ and blood serum. 16* S R M S , 1~5 9~milks,160 ~ Phosphorus content in rat femur was determined by 31P(n,cx) 28A1reaction with a B4C filter without the interference of A1.Ib3Similarly, A1 and P in bones by measuring the 28A1 activity in bare and Cd-covered samples irradiated on reactor neutrons were simultaneously determined. 'M The application of multielement determination has also been done. Kostadinov and D j i n g ~ v adeveloped '~~ a scheme for INAA based on a combination of thermal and epithermal neutron irradiation. The concentrations of 27 elements in SRMS of the NBS and the IAEA and human serum and plasma were determined. ENAA proved to be the preferable technique for the determination of As, Ba, Cd, Cs, Eu, Rb, Sb, Sr, U, and Yb. The high advantage factors for elements As, Br, Cd, Cu, Fe, I, Mg, Mn, Mo, Sb, Se, Si, Sn, Sr, and Zn were also ~ b t a i n e d . ] ~The ~ . ]detection ~~ limits of 24 elements were studied in the NBS orchard leaves and bovine liver and the IAEA animal mussel, and Bowen's Kale.I6* The lower detection limits have been found for some elements, As, Au, Ba, Br, Cd, Mo, Ni, Sb, Se, Sm, and U, with a cadmium filter. The use of B in conjunction with Cd filter leads to the theoretically improved sensitivities for 21 elements in biological material.169 The use of ENAA via long-lived radionuclide was studied for the determination of trace elements in human erythrocytes, plasma, urine, and some biological SRMs.I7OThe concentrations of Br, Cs, Fe, Rb, Se, and Zn were determined after minimal decay time. This method provides similar accuracy and reliability, but is faster in time compared with a conventional thermal neutron activation.
C. FAST NEUTRON ACTIVATION ANALYSIS (FNAA) The application of FNAA with reactor neutrons or of the use of 14-MeV neutrons generated by an accelerator is still useful as a complementary method of thermal NAA, especially for light elements. Ahafia and Jiggins"' have considered the effects of sample mass and matrix composition on the yields of the radionuclides produced by recoil protons in FNAA, especially on the
344
Activation Analysis
reaction 13C (p,n) I3N in the nitrogen determination. The crude protein content of various cornmeals and nonconventional seeds have been measured by 14-MeV FNAA via 14N(n,2n) 13N r e a ~ t i 0 n . This l ~ ~ rapid method is useful for the nondestructive determination of protein content. Instrumental FNAA combined with thermal INAA were applied for the analysis of P and Ca in Ca-hydr~xyapatite'~~ and small bone ~ a m p 1 e s .This l ~ ~ simple technique proved to give a quick and accurate analysis of these elements even in samples which are too small for chemical analysis. Woittiez and Das'75 analyzed the contents of Ca, F, and P in the IAEA Animal Bone using the reactions of (n,p) 44K, 19F(n,2n) 18Fand 31P(n,a) 28A1. The activation using 14-MeV neutrons was applied to the determinations of K, N, P, and Si in fertilizer and plant materials.176The interferences due to carbon and oxygen were considered. Good agreement was obtained between the results by FNAA and those by chemical analyses. For the investigation of the applicability of a neutron generator, the data of the specific count-rates for 66 elements were obtained. The procedure was satisfactorily applied for the analyses of Ca, C1, Fe, K, Mg, N, and Si in three biological S R M S . ' ~ ~
D. INSTRUMENTAL PHOTON ACTIVATION ANALYSIS (IPAA) INAA has been successfully applied to the determination of many elements in single sample, while the strong activities produced from abundant elements distort or mask the lower activities from the elements of interest. An alternative activation method for multielement research is photon activation by the (y,n) or by the (y,p) processes. PAA enables the determination of many of the elements, such as C, N, 0 , F, Ni, Sr, Zr, Mo, I, and Pb, that is difficult by INAA, and PAA has excellent potential for multielement determination as described in the review by Gladney on the applications of various biological S R M S . ' ~ ~ There have been few publications of PAA on biological materials in the past because irradiation facilities are very rare. Chattopadhyay and J e ~ i s developed '~~ an instrumental method for simultaneous determination of 19 elements in the NBS orchard leaves with a 45-MeV electron linear accelerator. Kato and collaborators investigated the sensitivities and precisions of 16 elements with 30-MeV bremsstrahlung and analyzed the multielement contents of the various SRMs, orchard leaves, bovine liver, Bowen's Kale, and Kentucky 1R1 Tobacco Leaves,180and tobacco leaves and commercial cigarettes. lX1Instrumental PAA has been developed for the determination of iodine in a wide range of biological materials, the NBS SRMs, diet, feces.'x2 Reproducibilities of 2 5 to 10% were achieved. IPAA has been applied for the determination of Zr in the NBS orchard leaves and bovine liver, and various rat tissues.'83 The detection limits are 0.1 kg for the orchard leaves, 0.04 kg for the bovine liver and animal tissues. The zirconium contents of animal tissues obtained in this work appear to be significantly lower than the values reported earlier. Galatanu and Engelman~~ analyzed l~~ the element contents in human hair. A careful application on the interferences makes analysis possible with the practical detection limits between 0.1 and 100 kg/g for 14 elements. Yagi and Masumoto developed some new standardization methods. One of these methods requires neither correction of the inhomogeneities of flux between the sample and comparative standard, nor that of the self-shielding effects, and it has been applied to the determination of Co, Ni, Rb, and Sr, in the NIES pepperbush.lS5The precision and accuracy of this method are proved to be valid. The stable-isotope dilution activation analysis, which is applicable only when the self-shielding effect of the sample is negligible, is effective in the case of PAA. The usefulness of this method was verified by PAA of Sr in the NBS tomato leaves and citrus leaves. lg6 The spectroscopy of the low energy photon (LEP), the characteristic X-ray, and soft yray in the energy region of less than 100 KeV, may be used as a complementary method to y-ray spectrometry of the activated sample. Sato and KatolX7investigated the self-absorption effect of LEP in biological samples and an applicability and the relative detectabilitj
Volume I1
345
to y-ray spectrometry of 32 elements for the quasi-biological matrix. They found that Ba, Br, I, Mo, Pb, Se, Zn, and some REEs were detected with high sensitivities by LEPS in comparison with y-ray spectrometry. In Table 7, the results of human liver and kidney by LEPS were shown along with the results obtained by INAA.lS8
E. CHARGED PARTICLE ACTIVATION ANALYSIS (CPAA) There was little utilization of charged particles, such as protons and alpha-particles, for biological materials in the past. CPAA has some disadvantages; a high temperature generation in irradiation, the difficulty in preparation of the target sample, and the necessity of the estimation of the yield curve on competing reactions. This technique may become, however, applied to biological samples due to the recent pervasion of cyclotrons for multipurpose, especially for medical use. CPAA can be also considered as a complementary method for the determination of light elements, which is difficult by NAA. Constantinescu et a1.Ix9 have developed a fast instrumental protein content analysis in cereals for measuring the total nitrogen content through the reaction I4N (p,n) I4O (T = 71 s). A good correlation has been obtained between the results of the nuclear determination and those of the chemical Kjeldahl method. Cantone and co-workers investigated the potentiality of (p,xn) activation analysis by a AVF cyclotron for trace elements analysis in biological materials. The concentrations of Cu, Fe, Se, Sr, and Zn in human serum have been determined by the (p,2n) reaction.lgOThey also investigated the quantitative contents of Cd and Ti in human serum by the (p,n) reaction.lgl Proton activation was investigated for the analysis of Pb in the NBS SRMs with a detection limit of 0.1 ppm, and the Pb contents in serum and red blood cells were also determined.lg2 Phosphorus is one of the light elements which are difficult to determine by INAA or IPAA. Phosphorus in five kinds of the NBS and NIES SRMs could be determined using the reaction of 31P (a,n) 34mCl(T = 32.0 min)."' Phosphorus can be determined at a detection limit of I k g free from interferences due to the matrix elements, and this method is sufficiently accurate, selective, fast, and simple. In this technique, it is very difficult to bombard both sample and comparative standard with the same flux in regard to the intensity and the energy distribution. Yagi and Masumoto have proposed a new internal standard method which is applicable to all sorts of activation analysis, and successfully applied it to determine the contents of P, C1, K, and Ca in control serum by alpha particle activation analysis,194and the contents of Ca, Ti, Fe, Zn, As, Sr, Zr, and Mo in the NBS oyster, brewers yeast, and the NIES mussel by the respective (p,n) reactions. Ig5 The stability of a sample during charged particle bombardment is of fundamental importance. Xenoulis et al.Ig6 investigated the yield alteration on freeze-dried plant and animal specimens as well as on targets prepared by air drying at several temperatures.
F. RADIOCHEMICAL NEUTRON ACTIVATION ANALYSIS (RNAA) With multielemental INAA, it is often necessary to wait a long period of time (about 4 weeks) after irradiation for decay of the interfering nuclides to reach sufficiently low level, and even then, a long counting period may be required to give acceptable precision. In INAA on biological samples, the very strong activities, due to 24Na, 80Br, 36Cl, and the bremsstrahlung of 72P induced from the abundant elements in biological materials often restrict the determination of such elements of interest in biological study as As, Cd, Cu, Mo, etc. with short and medium half-lives, which cannot usually be instrumentally determined. Subsequently radiochemical procedures are required for the separation of these elements. The purpose of radiochemical separation is not the removal of matrix effects occurring in other analytical methods but the elimination of interfering radionuclides with the strong activities or overlapping y-rays, and the sensitivity of elements of weak activities consequently raises.
346
Activation Analysis
Volume 11
347
The hydrated antimony pentoxide (HAP) developed by Girrardi and S a b b i ~ n i has '~~ shown an excellent selectivity for Na with a decontamination factor exceeding 10l0. Among 60 elements tested, only tantalum was retained with sodium. This research stimulated the development of a variety of inorganic exchangers, and the group separation procedures, separating the samples into three to five groups, have developed in conjunction with distillation, ion exchanger, and solvent extraction. The automatic or semi-automatic group-separation schemes have been also developed for the elimination of the risk of systematic and random error. They are, however, scarcely used outside the laboratory where they were designed. Many volatile trace elements, e.g., Hg, I, Sb, Se, etc. are very interesting in biological works. One must be cautious of the loss and the recovery of these elements. Some recent developments in separation techniques on activation analysis are summarized by Braun et a1.19Vhispublication involves new ion exchanger or solvent and new techniques for their uses. Pietra et a1.'99 summarized the applications of 16 radiochemical separation schemes for NAA on various biological samples by themselves. These procedures are related to the separations of elements into groups that allow the determination of up to 50 elements or specific separations for single elements. The other current applications of RNAA for biological materials are summarized in Table 8 on the analyses from single to multielement. One modified approach in radiochemical separation is the concentration of elements or chemical species of interest prior to irradiation. Preconcentration is advantageous for the short-lived radionuclide determination, and also has the advantages of obtaining a large concentration factor and of eliminating the potential interference reactions, as compared with post-irradiation separation. Trace of gallium in the NBS orchard leaves was extracted with dithiocarbamate into an organic phase, followed by back-extraction of Ga with a Pb(NO,), solution.229After separation, the aqueous phase was heat-sealed in a polyethylene vial for irradiation. Vanadium in the NBS bovine liver, the Bowen's Kale,,09 and three botanical SRMsZ30was extracted with 8-hydroxyquinoline. The chemical yields on separation were determined by using carrier-free 48Vas a tracer. Uranium in two botanical NBS SRMs and the IAEA animal bone231is preconcentrated by coprecipitation with PAN in the presence of CyDTA being highly selective for U. The detection limits are about 5 nglg for 0.5 g samples. Copper and magnesium in human serum were analyzed by NAA after the removal of Na by HAP-column and of C1 by evaporation.232The radionuclide, Iz9I, released into the environment with the development of nuclear industry, was determined by the reaction of 1291(n,y)1301 on bovine thyroid gland233and seaweeds.234Ward and Ryan7' used HAP as a scavenger to the determination of 14 short-lived nuclides in the NBS bovine liver, human pooled whole blood, and serum. The results obtained for this SRM agree extremely well with both the certified and the information values. When the desired element is separated or concentrated before irradiation, a chemical yield has to be known. Tsukada et al. used an enriched isotope as an activable tracer.235The contents of Cd in four biological NIES SRMs (Cd contents, 0.070 to 6.7 ppm) were determined by an addition of an enriched stable l16Cd in preconcentration step. This method may be applied to many trace elements. The elemental distribution in subcellular fractions has been studied for 17 elements in beef heart,236for 11 elements in rat liver,Io7for 8 elements in monkey liver and kidney,237 and for 18 elements in bovine kidney.238The fractionation procedure was based on the differential centrifugation of tissue homogenate. The cytosol fraction in rat liver contained the greatest quantities of the elements observed except for Mn. The Mn content in the cytosol relative to the whole tissue is 24%, while those of the other elements are about 70 to 80%. Gel filtration were applied to the fractionation of rat liver cytosol protein,239and to the desalting and fractionation for multielement determination of human serum protein.2* The organic bound Br and C1 in human milk and serum were preseparated by using Bio-Gel
TABLE 8 Applications of RNAA for Biological Materials Remarks
Zr As Sb Au Pt Cd Hg As Cd Hg As Sb Se Cu Mn Zn Ag Cr Mn Zn As Cd Cu Mo Cu Fe Mn Zn As-Zn(5) Cd-Zn(5) Cd-Zn(8) Rare earth(8) Ag-Zn(l2) As-Zn(l2) Au-W(10) and Lanthanide As-Zn(l4) Ag-Zn(l6) Ag-Zn(25) As-Zn(25) Ag-Zn(35)
3 SRMs Fish muscle 2 Plant SRMs Foodstuffs Hair, food 10 SRMs Rice 3 SRMs Human serum Serum, urine Liver, serum Animal tissues 11 SRMs 2 SRMs, liver 3 SRMs Human tissues 9 SRMs 4 SRMs Fish solubles 6 SRMs, liver Human blood cells 3 SRMs, milk 2 SRMs, Hair Rat liver 8 SRMs, organs Animal tissues 6 SRMs 3 SRMs
HNO,/HClO,, extraction of ASH, with Ag-DDTC, 77Astracer tracer Pre-ashing, HAP column, adsorption of l""Cs on AMP, L34Cs HNOJH2S04, HAP and Ag 1 X 8 column, 67Gatracer HNOJH,SO,, Dowex 50W X 2 and 1 x 4 column in HBr medium HNOJH2S04, metal precipitation, Hg-thiocyanate H2S04/Na2S0,,cyclic extraction-stripping using CCI, NaOC1, precipitation as PdI,, ','I tracer HNOJHCIO,, Srafion NMRR ion exchange resin HN03/HCI04/H2S04,extraction with 8-hydroxyquinolinein CHCI, HN0,M2S04, extraction with TBP in toluene, 48Vtracer Pre-ashig, extraction with cuferron in CHCI,, 48Vtracer Fuming HNO,, precipitation as ZrO(H,PO,)-BaZrF6 Saturated Mg(NO,),, trap of hydride by active carbon HN03/H2S04,precipitation as Au, '98Pt(n,y)199Pt(p)-199A~ Teflone bomb digestion, extraction with Ni(DDC), and Zn(DDC), in CHCI, HNO, in autoclave, Cu grain and Zn ferrocyanide column HNOJH2S04, distillation followed by precipitation HNOJH,SO,, C,,-bonded silica gel column after selective complexation HNO,, HAP column, extraction-precipitation Teflone bomb digestion, extraction with DDTC in CHCI,, TDO column HNOJH2O,/HC1O4, extraction with DDTC and PTFE porous membrane HN03M2S04,sequential precipitation Saturated Mg(NO,),, extraction with 4-NDP and Na-DDTC HNOJH2S04, group separation with APDC extraction H2S04/H20,,polyantimonic acid column, Dowex 2 x 8 column HNOJH202, distillation, precipitation with thioacetoamide Wet destruction, volatilization, extraction Saturated Mg(NO,),, scavenging by activated carbon
8 SRMs, blood Rat liver Human Liver Diet 9 SRMs
H2S04/H202,automated, distillation, HAP-Dowex 2 x 8 column HNOJH202, extraction with mercury or zinc amalgam HNOJHCIO,, semi-automated destruction, distillation, ion exchanger HNOJH2S04,distillation, Tip-Zp-HAP column HN0,/H2S04, adsorption on active carbon by a few successive filtrations
Ref.
Volume 11
349
chromatography for the de~alting.'~'Blotcky and co-workers have developed a molecular NAA by combining NAA with such biochemical procedures as gel filtration and HPLC, and analyzed iodoamino acid and thyroid hormones,242chlorinated pesticides,243and trimethylselenium ion2"" in urine matrix. The combination of NAA with biochemical techniques like gel filtration, ion exchange chromatography, isoelectric focusing, dialysis, disk electrophoresis, and ultra-filtration provides a powerful tool for the isolation and identification of important metal-protein Even the introduction of preirradiation separation procedures loses NAA's advantage, NAA can still compete with the other analytical methods, since the advantages, such as high selectivity, sensitivity, and multielement capability of NAA are useful to very small samples produced by biochemical procedures. In order to permit the roles of trace elements in living matter to be fully understood, a knowledge of their localization and association within the cell is indispensable. The requirement of research introducing preseparation procedures on the effect of heavy metals at both cellular and molecular levels may be increased in the future.
REFERENCES 1. Iyengar, G. V., Kollmer, W. E., and Bowen, H. J. M., The Elemental Composition of Human Tissues and Body Fluids, Verlag Chemie, New York, 1978. 2. Heydorn, K., Neutron Activation Analysis for Clinical Trace Element Research. Vol. I and 11, CRC Press, Boca Raton, EX, 1984. 3 . Elemental Analysis of Biological Materials, Current Problems and Techniques with Special Reference to Trace Elements, Tech. Rep. Ser. No. 197, International Atomic Energy Agency, Vienna, 1980, 105. 4. Behne, D., Sources of error in sampling and sample preparation for trace element analysis in medicine, J. Clin. Chem. Clin. Biochem., 19, 115, 1981. 5. Iyengar, G. V., Post mortem changes of the elemental composition of autopsy specimens: variations of K, Na, Mg, Ca, Cl, Fe, Zn, Cu Mn and Rb in rat liver, Sci. Total Environ., 15, 217, 1980. 6. Iyengar, G. V., Kasperek, K., and Feinendegen, L. E., Postnatal changes of the elemental composition of autopsy samples: variations of caesium, cobalt and selenium in rat liver studied by instrumental neutron activation analysis, J . Radioanal. Chem., 69, 463, 1982. 7. Quality Assurance in Biomedical Neutron Activation Analysis, IAEA-TECDOC-323, International Atomic Energy Agency, Vienna, 1984. 8. Versieck, J., Speecke, A., Hoste, J., and Barbier, F., Trace element contamination in biopsies of the liver, Clin. Chem., 19, 472, 1973. 9. Versieck, J., Barbier, F., Cornelis, R., and Hoste, J., Sample contamination as a source of error in trace-element analysis of biological samples, Talanta, 29, 973, 1982. 10. Donev, I. Y., Rapid homogenisation and drying of biological materials, J. Radioanal. Chem., 39, 317, 1977. 11. Iyengar, G. V., Homogenised sampling of bone and other biological materials, Radiochem. Radioanal. Lett., 24, 35, 1976. 12. Iyengar, G. V.and Kasperek, K., Application of the brittle fracture technique (BFT) to homogenise biological samples and some observations regarding the distribution behaviour of the trace elements at different concentration levels in a biological matrix, J . Radioanal. Chem., 39, 301, 1977. 13. Nichols, J. A. and Hageman, L. R., Noncontaminating, representative sampling by shattering of cold, brittle, biological tissues, Anal. Chem., 51, 1591, 1979. 14. Kratochvil, B., John, M., Duke, M. and Ng, D., Evaluation of homogeneity of a certified reference material by instrumental neutron activation analysis, Anal. Chem., 58, 102, 1986. 15. Iyengar, G. V., Kasperek, K., and Feinendegen, L. E., Retention of the metabolized trace elements in biological tissues following different drying procedures. I. Antimony, cobalt, iodine, mercury, selenium and zinc in rat tissues, Sci. Total Environ., 10, 1 , 1978. 16. Iyengar, G.V., Kasperek, K., and Feinendegen, L. E., Retention of metabolised trace elements in biological tissues following different drying procedures. Part 11. Caesium, cerium, manganese, scandium, silver, and tin in rat tissues, Analyst, 105, 794, 1980.
350
Activation Analysis
17. Snyder, W. S., Cook, M. J., Nasset, E. S., Karhausen, L. R., Howells, G. P., and Tipton, I. H., Report of the Task Group on Reference Man, ICRP Report No. 23, Pergamon Press, Oxford, 1975. 18. Behne, D., Bratter, P., Gawlik, D., Rosick, U. and Schmelzer, W., Combination of protein separation methods and neutron activation analysis in the determination of protein-bound trace element fractions, in Nuclear Activation Techniques in the Life Sciences. IAEA-SM-227136, International Atomic Energy Agency, Vienna, 1979, 117. 19. Pietra, R., Sabbioni, E., Springer, A., and Ubertalli, L., Analytical problems related to the preparation of samples used in studies on metallobiochemistry of heavy metals pollution using neutron activation analysis, J . Radioanal. Chem., 69, 365, 1982. 20. Lievens, P., Cornelis, R., and Hoste, J., A separation scheme for the determination of trace elements in biological materials by neutron activation analysis, Anal. Chim.Acta, 80, 97, 1975. 21. Tu, S.-D. and Lieser, K. H., Multielement analysis of Chinese biological standard reference material by monostandard instrumental neutron activation analysis, J . Radioanal. Nucl. Chern., Articles, 81, 345, 1984. 22. Tu, S.-D., Hanf, W., and Lieser, K. H., Monostandard instrumental neutron activation analysis of Chinese biological standard reference material using short-lived radionuclides, J . Radioanal. Nucl. Chem., Articles, 83, 283, 1984. 23. Muramatsu, Y. and Parr, R. M., Survey of currently available reference materials for use in connection with the determination of trace elements in biological and environmental materials, IAEAlRW128, International Atomic Energy Agency, Vienna, 1985. 24. Byrne, A. R., Camara-Rica, C., Cornelis, R., de GNU, J. J. M., Iyengar, G. V., Kirkbright, G., Knapp, G. Parr, R. M., and Stoeppler, M., Results of a co-ordinated research programme to improve the certification of IAEA milk powder A-1 1 and animal muscle H-4 for eleven difficult trace elements,
Fresenius Z. Anal. Chern., 326, 723, 1987. 25. Mosulishvili, L. M., Kolomi'tsev, M. A., Dundua, V. Y., Shonia, N. I., and Danilova, O.A., Multielement standards for instrumental neutron activation analysis of biological materials, J . Radioanal. Chem., 26, 175, 1975. 26. Anderson, D. H., Murphy, J. J., and White, W. W., Gelatin multicomponent trace element reference material, Anal. Chem., 48, 116, 1976. 27. Suzuki, N., Iwata, Y. and Imura, H., Synthetic multi-element reference material with pseudo-biological matrix composition, Anal. Sci., 2, 335, 1986. 28. Tout, R. E. and Chatt, A., A critical evaluation of short-lived and long-lived neutron activation products for trace element determinations, Anal. Chim. Acta, 118, 341, 1980. 29. Erdtmann, G., Ed., Neutron Activation Tables, Verlag Chemie, New York, 1976. 30. Lederer, C. M. and Shirley, V. S., Eds., Table of 1~otopes,7th ed., John Wiley & Sons, New York, 1978. 31. Iyengar, G. V., Loss of sample weight during long time reactor irradiation of biological materials, J . Radioanal. Nucl. Chem., Articles, 84, 201, 1984. 32. Cornelis, R., Trace element studies in the biosphere with neutron activation analysis, J. Trace Microprobe Technol., 2, 237, 1984-85. 33. Lievens, P., Versieck, J., Cornelis, R., and Hoste, J., The distribution of trace elements in normal human liver determined by semi-automated radiochemical neutron activation analysis, J. Radioanal. Chem.. 37, 483, 1977. 34. Sato, T., Kato, Y., and Mori, K., unpublished data, 1987. 35. de Goeij, J. J. M., Volkers, K. J., and Tjioe, P. S., A search for losses of chromium and other trace elements during lyophilization of human liver tissue, Anal. Chim. Acta, 109, 139, 1979. 36. Plantin, L.-O., Trace elements in cardiovascular diseases, in Nuclear Activation Techniques in the Life Sciences, IAEA-SM-227195, International Atomic Energy Agency, Vienna, 1979, 321. 37. Cornelis, R., Mess, L., Hoste, J., and Ryckebusch, J., Neutron activation analysis of vanadium in human liver and serum, in Nuclear Activation Techniques in the Life Sciences, IAEA-SM-227125, International Atomic Energy Agency, Vienna, 1979, 165. 38. Persigehl, M., Schicha, H., Kasperek, K., and Feinendegen, L. E., Behaviour of trace element concentration in human organs in dependence of age and environment, J . Radioanal. Chem., 37, 61 1 , 1977. 39. Tjioe, P. S., Volkers, K. J., Kroon, J. J., and de Goeij, J. J. M., Distribution patterns of rare-earth elements in biological materials evaluated by radiochemical neutron activation analysis, J . Radioanal. Chem., 80, 129, 1983. 40. Yukawa, M., Suzuki-Yasumoto, M., Amano, K., and Terai, M., Distribution of trace elements in the human body determined by neutron activation analysis, Arch. Environ. Health, 35, 36, 1980. 41. Larsen, N. A., Pakkenberg, H., Damsgaard, E., and Heydorn, K., Topographical distribution of arsenic, manganese and selenium in the normal human brain, J . Neurol. Sci., 42, 407, 1979. 42. Ehmann, W. D., Markesbery, W. R., Hossain, T. I. M., Alauddii, M., and Goodim, D. T., Trace elements in human brain tissue by INAA, J . Radioanal. Chem., 70, 57, 1982.
Volume 11
351
43. Bratter, P., Gawlik, D., Lausch, J., and Rosick. U., On the distribution of trace elements in human skeletons, J. Radioanal. Chem., 37, 393, 1977. 44. Kalashnikov, V. M. and Zaichik, V. E., Instrumental neutron activation determination of scandium, chromium, iron, cobalt, zinc, selenium, rubidium, silver, antimony, terbium, and mercury in bone tissue, Zh. Anal. Khim., 35, 530, 1980. 45. Kidd, P. M., Nicolaou, G., and Spyrou, N. M., Elemental composition and distribution of human tibia using nondestructive and destructive techniques of analysis, J. Radioanal. Chem., 70, 489, 1982. 46. DraSkoviC, R. J., JaCimoviC, L., StojifeviC, M., PajiC, P., and FilipoviC, V., Investigations of some elements distribution in dental tissues by INAA as a function of ecological and some other parameters, J. Radioanal. Chem., 70, 117, 1982. 47. Ordogh, M. and Rdcz, P., Investigations on inorganic elements in human lenses of normal and senile cataractous character, J. Radioanal. Chem., 37, 451, 1977. 48. Yamaguchi, T., Bando, M., Nakajima, A., Terai, M., and Suzuki-Yasumoto, M., An application of neutron activation analysis to biological materials. IV. Approach to simultaneous determination of trace elements in human eye tissues with non-destructive neutron activation analysis, J. Radioanal. Chem., 57, 169, 1980. 49. Damsgaard, E., Bstergaard, K., and Heydorn, K., Concentrations of selenium and zinc in human kidneys, J . Radioanal. Chem., 70, 67, 1982. 50. De Reu, L., Cornelis, R., Hoste, J., and Ringoir, S., Instrumental neutron activation analysis of minor and trace elements in human kidneys, Radiochem. Radioanal. Lett., 40, 51, 1979. 51. Vanoeteren, C., Cornelis, R., Versieck, J., Hoste, J., and De Roose, J., Trace element patterns in human lung tissues, J . Radioanal. Chem., 70, 219, 1982. 52. Kanabrocki, E. L., Kanabrocki, J. A., Greco, J., Kaplan, E., and Oester, Y. T., lnstmmental analysis of trace element in thumbnails of human subjects, Sci. Total Environ., 13, 131, 1979. 53. Terai, M., Matumoto, M., Suzuki, H., Tanizaki, Y., and Yukawa, M., Trace elements in human pancreas, Trace Elements Anal. Chem. Med. Biol., 3, 183, 1984. 54. Nathan, M., Hiick, A., Demmel, U., Kasperek, K., and Feinendegen, L. E., Elements in the human pineal body, J. Radioanal. Chem., 70, 209, 1982. 55. Damsgaard, E., Heydorn, K., and Horn, N., Trace elements in the placenta of normal foetuses and male foetuses with Menkes disease determined by neutron activation analysis, Trace Elements Anal. Chem. Med. Biol., 2, 499, 1983. 56. Parkinson, T. F., Millikan, L. E., and Anderson, D. F., Manganese, copper and zinc concentrations in human skin lesions, Int. J. Appl. Radiat. Isot., 30, 41 1, 1979. 57. Hikk, A., Demmel, U., Schicha, H., Kasperek, K., and Feinendegen, L. E., Trace element concentration in human brain, Brain, 98, 49, 1975. 58. Markesbery, W. R., Ehmann, W. D., Alauddin, M., and Hossain, T. I. M., Brain trace element concentrations in aging, Neurobiol. Aging, 5, 19, 1984. 59. Ryabukhin, Y. S., Ed., Activation Analysis of Hair as an Indicator of Contamination of Man by Environmental Trace Element Pollutions, IAEA/RL/SO, International Atomic Energy Agency, Vienna, 1978. 60. Ryabukhin, Y. S., Nuclear-based methods for the analysis of trace element pollutions in human hair, J. Radioanal. Chem., 60, 7, 1980. 61. Yukawa, M., Suzuki-Yasumoto, M., and Tanaka, S.? The variation of trace element concentration in human hair: the trace element profile in human long hair by sectional analysis using neutron activation analysis, Sci. Total Environ., 34, 41, 1984. 62. Ohmori, S. and Hirata, M., Determination of bromine contents in blood and hair of workers exposed to methyl bromide by radioactivation analysis method, Jpn. J. Ind. Health, 24, 1 19, 1982. 63. Akashi, J., Fukushima, I., Imahori, A., Shiobara, S., Takahashi, Y., and Tomura, K., Multielement analysis of the hair of mining industry workers, J. Radioanal. Chem., 68, 59, 1982. 64. Obrusnik, I., SkiivPnek, O., UmlaufovP, M. and Hovorka, V., Neutron activation analysis of neonate and maternal hair sampled in areas with different levels of pollution, J. Radioanal. Nucl. Chem. Articles, 89, 561, 1985. 65. Katayama, Y. and Ishida, N., Determination of antimony in nail and hair by thermal neutron activation analysis, Radioisotopes, 36, 103, 1987. 66. Muramatsu, Y. and Parr, R. M., Determination of Some Trace Elements in Hair, Liver and Kidney Cortex by Neutron Activation Analysis, in the Second Research Co-ordinating Meeting, Neuherberg, September 2 to 5, 1985, 17-1. 67. Sato, T., Kato, Y., and Mori, K., unpublished data, 1987. 68. Behne, D. and Jiirgensen, H., Determination of trace elements in human blood serum and in the standard reference material Bovine Liver by instrumental neutron activation analysis, J . Radioanal. Chem., 42, 447, 1978. 69. Nakahara, H., Nagame, Y., Yoshizawa, Y., Oda, H., Gotoh, S., and Murakami, Y., Trace element analysis of human blood serum by neutron activation analysis, J. Radioanal. Chem., 54, 183, 1979.
352
Activation Analysis
70. Kasperek, K., Kiem, J., Iyengar, G. V., and Feinendegen, L. E., Concentration differences between serum and plasma of the elements cobalt, iron, mercury, rubidium, selenium and zinc determined by neutron activation analysis, Sci. Total Environ., 17, 331, 1981. 71. Bratter, P., Negretti de Bratter, V. E., Rosick, U., and Stockhausen, H. B. V., Trace element concentration in serum of infants in relation to dietary sources, Trace Element Anal. Chem. Med. Biol., 4 , 133, 1987. 72. Versieck, J. and Cornelis, R., Normal levels of trace elements in human blood plasma or serum, Anal. Chim. Acta, 116, 217, 1980. 73. Woittiez, J. R. W., Elemental analysis of human serum and serum protein fractions by thermal neutron activation, ECN-147, Netherlands Energy Research Foundation, The Netherlands, 1984. 74. Krivan, V., Geiger, H., and Franz, H. E., Bestimmung von Fe, Co, Cu, Zn, Se, Rb and Cs in NBSOchsenlibir, Blutplasma und Erythrocyten durch INAA und AAS, Fresenius Z. Anal. Chem., 305, 399, 1981. 75. Kiem, J., Borberg, H., Iyengar, G. V., Kasperek, K., Siegers, M., Feinendegen, L. E., and Gross, R., Elemental composition of platelets. 11. Water content of normal human platelets and measurements of their concentrations of Cu, Fe, K and Zn by neutron activation analysis, Clin. Chem., 25, 205, 1979. 76. Kasperek, K., Iyengar, G. V., Kiem, J., Borberg, H., and Feinendegen, L. E., Elemental composition of platelets. Part 111. Determination of Ag, Au, Cd, Co, Cr, Cs, Mo, Rb, Sb and Se in normal human platelets by neutron activation analysis, Clin. Chem., 25, 711, 1979. 77. Ward, N. I. and Ryan, D. E., Multi-element analysis of blood for trace metals by neutron activation analysis, Anal. Chim. Acta, 105, 185, 1979. 78. Mosulishvili, L. M., Shonia, N. I., Ginturi, E. N., Efremova, E. Y., and Kharabadze, N. E., INAA results for metal traces in human whole blood, J. Radioanal. Nucl. Chem., Articles, 88, 121, 1985. 79. Lin, S.-M., Determination of trace elements in human whole blood by instrumental neutron activation analysis, Radioisotopes, 32, 155, 1983. 80. Cornelis, R., Speecke, A., and Hoste, J., Neutron activation analysis for bulk and trace elements in urine, Anal. Chim. Acta, 78, 317, 1975. 81. Ward, N., Bryce-Smith, D., Minski, M., Zaaijman, J. du T., and Pim, B., Multielement neutron activation analysis of amniotic fluid in relation to varying gestational membrane ruptures, Trace Element Anal. Chem. Med. Biol., 2, 483, 1983. 82. Antoniou, K., Vassilaki-Grimani, M., Lolis, D., and Grimanis, A. P., Concentrations of cobalt, rubidium, selenium and zinc in maternal and cord blood serum and amniotic fluid of woman with normal and prolonged pregnancies, J. Radioanal. Chem., 70, 77, 1982. 83. Dybczynski, R., Veglia, A., and Suschny, O., Report on the intercomparison run A-11 for the determination of inorganic constituents of milk powder, IAEAIRL168, International Atomic Energy Agency, Vienna, 1980. 84. Suschny, O., Dybczynski, R., and Veglia, A., Comparison of neutron activation analysis with other analytical techniques for the determination of inorganic constituents of milk powder, J. Radioanal. Chem., 69, 147, 1982. 85. Dang, H. S., Jaiswal, D. D., DaCosta, H., and Somasundaram, S., Determination of trace elements in human milk and commercial milk formulae using neutron activation and radiochemical separation, J . Radioanal. Chem., 70, 163, 1982. 86. Dang, H. S., Desai, H. B., Jaiswal, D. D., Kayasth, S. R., and Somasundaram, S., A sequential multielement separation scheme for determination of As, Mn, Mo, Cu, and Zn in human milk by neutron activation analysis, J . Radioanal. Chem., 77, 65, 1983. 87. Bergerioux, C. and Boisvert, J., Rapid neutron activation method for the determination of minerals in milk, Int. J. Nucl. Med. Biol., 6, 128, 1979. 88. Lombeck, I., Kasperek, K., Bonnermann, B., Feinendegen, L. E., and Bremer, H. J., Selenium content of human milk, cow's milk and cow's milk infant formulas, Eur. J . Pediatr., 129, 139, 1978. 89. Gharib, A., Rahimi, H., Pyrovan, H., Raofli, N. J., and Taherpoor, H., Study of trace elements in milk by nuclear analytical techniques, J . Radioanal. Nucl. Chem., Articles, 89, 31, 1985. 90. Burkinshaw, L., The contribution of nuclear activation techniques to medical science, J . Radioanal. Chem., 69, 27, 1982. 91. Proceedings of an International Symposium on Nuclear Activation Techniques in the Life Sciences, International Atomic Energy Agency, Vienna, 1978, chap. 3. 92. Zdankiewicz, D. D. and Fasching, J. L., Analysis of whole blood by neutron activation: a search for a biochemical indicator of neoplasia, Clin. Chem., 22, 1361, 1976. 93. Lipcsey, A., Ordogh, M., Fekete, J., and Szab6, E., Application of neutron activation analysis and spectrophotometry for the determination of copper level in sera and cerebrospinal fluids of schizophrenic patients, J. Radioanal. Nucl. Chem. Articles, 88, 57, 1985. 94. Versieck, J., Hoste, J., Vanballenberghe, L., Barbier, F., Cornelis, R., and Waelput, I., Serum molybdenum in diseases of the liver and biliary system., J . Lab. Clin. Med.. 97, 535, 1981.
Volume I1
353
95. Moo, S. P. and Pillay, K. K. S., Trace element profiles in the hair of cancer patients, J. Radioanal. Chem., 77, 141, 1983. 96. Tomza, U. and Maenhaut, W., Trace elements in head hair of hemodialysis patients, J. Radioanal. Nucl. Chem. Lett., 86, 209, 1984. 97. Terai, M., Akabane, A., Ohno, K., Sakurai, S., Tsunoda, F., Hashimoto, K. and Nishida, G., An application of neutron activation analysis to biological materials. 11. The comparison of trace element contents in normal and diseased infant hairs, J . Radioanal. Chem., 52, 143, 1979. 98. Al-Kinani, A. T., Watt, D. E., East, B. W., and Harris, I. A., Minor and trace element analysis of gallstones, Analyst, 109, 365, 1984. 99. JaCimovii., L., DraSkoviC, R., and Ostojic, B., Determination of some trace elements in some human concretions, J. Radioanal. Chem., 37, 415, 1977. 100. Denov, I., Mashkarov, S., Maritchkova, L., and Gotsev, G., Quantitative investigation of some trace elements in renal stones by neutron activation analysis, J. Radioanal. Chem., 37, 441, 1977. 101. Molokhia, A. and Nixon, G. S., Studies of the composition of human dental calculus, J. Radioanal. Nucl. Chem., Articles, 83, 273, 1984. 102. Ordogh, M., Fazekas, S., Horvhth, E., 0v4ry, I., Pogany, L., Sziklai, I. L., and Szab6, E., The regional distribution of copper and other trace elements in the human brain with special reference to Wilson's disease, J. Radioanal. Chem., 79, 15, 1983. 103. Hofmann, J., Wiehl, N., Michel, R., Liier, F., and Zilkens, J., Neutron activation studies of the inbody corrosion of hip-joint prostheses made of Co-Cr-alloys, J . Radioanal. Chem., 70, 85, 1982. 104. Kollmer, W. E., Schramel, P., and Samsahl, K., Simultaneous determination of nine elements in some tissues of the rat using neutron activation analysis, Phys. Med. Biol., 17, 555, 1972. 105. Maziere, B., Loc'h, C., Stulzaft, O., Gaudry, A., and Comar, D., Application of neutron activation analysis to the study of the variations of the concentration of trace elements in various organs of rat as a function of age, J. Radioanal. Chem., 37, 617, 1977. 106. Sato, T. and Kato, T., Determination of trace elements in various organs of rats by thermal neutron activation analysis, J . Radioanal. Chem., 53. 181, 1979. 107. Shinogi, M., Fukuda, K., Nakazawa, M., and Mori, I., The study of elements in organisms by neutron activation analysis. 111. The distribution of trace elements in various organs of normal rat and in cell fractions of rat liver, Chem. Pharm. Bull., 28, 2094, 1980. 108. Sato, T., unpublished data, 1980. 109. Sato, T., A study of the postnatal change in trace element levels in rat tissues by thermal neutron activation analysis, J . Radioanal. Chem.. 76, 215, 1983. 110. Ohmori, S. and Hashimoto, K., Neutron activation analysis of trace metals in the hair and organs of small animals treated chronically with Hg and Mn, J . Radioanal. Nucl. Chem. Articles, 89, 277, 1985. 111. Chan, A. W. K., Minski, M. J., and Lai, J. C. K., An application of neutron activation analysis to small biological samples: simultaneous determination of thirty elements in rat brain regions, J. Neurosci. Med., 7, 317, 1983. 112. Sato, T., A study of the developmental changes in trace elements and minerals in rat and mouse milk by thermal neutron activation analysis, J . Radioanal. Nucl. Chem., Articles, 92, 293, 1985. 113. Chatt, A. and Tse, C.-S., Instrumental and radiochemical neutron activation analysis of neoplastic tissues, Trans. Am. Nucl. Soc., 44, 24, 1983. 114. Nagatsuka, S. and Tanizaki, Y., Determination of trace elements in Stenopsyche griseipennis by neutron activation analysis, Radioisotopes, 30, 253, 1981. 115. Turkstra, J., Harthoorn, A. M., Beukes, P. J. L., and Brits, R. J. N., The influence of seasonal changes in the concentration of trace elements in liver tissue of various wild animals determined by instrumental neutron activation analysis, J. Radioanal. Chem., 37, 473, 1977. 116. Siegers, M. P., Kasperek, K., Heiniger, H. J., and Feinendegen, L. E., Distribution of trace elements in organs of mice different inbred streams, J . Radioanal. Chem., 37, 421, 1977. 117. Taguchi, M., Takagi, H., Iwashima, K., and Yamagata, N., Metal content of shark muscle powder biological reference material, J . Assoc. Off. Anal. Chem., 64, 260, 1981. 118. Suzuki, S. and Hirai, S., Determination of trace elements in reference material Mussel by instrumental neutron activation analysis, Bunseki Kagaku, 33, 596, 1984. 119. Kostid, K. and DraSkovid, R. J., Studies of iron, cobalt and chromium distribution in some continental aquatic ecosystems and biological materials, J . Radioanal. Chem.. 69, 417, 1982. 120. Czauderna, M. and Rochalska, M., Studies on the incorporation of Se and Te in the presence of glutathione and cysteine and the distribution of Hg, Zn, Fe, Co and Rb in mice by instrumental neutron activation analysis, J. Radioanal. Nucl. Chem., Articles, 97, 51, 1986. 121. Czauderna, M. and Smogorzewska, E., Studies on the incorporation of Se in the presence of glutathione and the distribution of Zn, Co, Fe, Rb and Cs in mice by instrumental neutron activation analysis, J . Radioanal. Nucl. Chem., Articles, 97, 347, 1986.
354
Activation Analysis
122. Czauderna, M. and Rochalska, M., Studies on the differences in the effects of SeO, and organic Secompounds on the distribution of Hg, Co, Fe, Zn and Rb in mice by instrumental neutron activation analysis, J. Radioanal. Nucl. Chem., Articles, 99, 265, 1986. 123. Ahmad, S., Chaudhry, M. S., and Qureshi, I. H., Determination of toxic elements in tobacco products by instrumental neutron activation analysis, J. Radioanal. Chem., 54, 331, 1979. 124. Faanhof, A. and Das, H. A., Instrumental thermal neutron activation analysis of tobacco, J. Radioanal. Chem., 56, 131, 1980. 125. Giilovali, M. C. and Giindiiz, G., Trace elements in Turkish tobacco determined by instrumental neutron activation analysis, J. Radioanal. Chem., 78, 189, 1983. 126. Mishra, U. C. and Shaikh, G. N., Simultaneous muftielement determination of chewing and snuff tobacco used in India by INAA, J. Radioanal. Nucl. Chem., Articles, 98, 297, 1986. 127. Iskander, F. Y., Egyptian and foreign cigarettes. 11. Determination of trace elements in tobacco, ash and wrapping paper, J . Radioanal. Nucl. Chem., Articles, 97, 107, 1986. 128. Mishra, U. C. and Shaikh, G. N., Determination of trace elements in total particulate matter of cigarette smoke by instrumental neutron activation analysis, J. Radioanal. Nucl. Chem., Articles, 89, 545, 1985. 129. Iskander, F. Y., Egyptian and foreign cigarettes. I. Determination of trace elements in cigarette filter before and after smoking, J . Radioanal. Nucl. Chem., Articles. 91, 191, 1985. 130. Sato, T. and Miyao, Y., Neutron activation analysis of laboratory animal diets, Radioisotopes, 35, 24, 1986. 131. Nagatsuka, S., Tanizaki, Y., and Yamazaki, M., Determination of trace elements in freshwater diatoms by neutron activation analysis, Radioisotopes, 31, 69, 1982. 132. Wells, J. R., Kaufman, P. B., Jones, J. D., Estabraok, G. F., and Ghosheh, N. S., Contents of some heavy metals in plants from Saginaw Bay (Lake Huron) and some small lakes in wilderness areas of Michigan's Upper Peninsula as analyzed by neutron activation analysis, J. Radioanal. Chem., 71, 97, 1982. 133. Sherif, M. K., Awadallah, R. M., and Amrallah, A. H., Determination of trace elements of Egyptian crops by neutron activation analysis. 111. Trace elements in African tea, ginger, canella bark, black pepper, sesame, lady's fingers, jew's mallow, tomatoes, cucumber and marrow, J. Radioanal. Chem., 57, 53, 1980. 134. Awadallah, R. M., Sherif, M. K., Amrallah, A. H., and Grass, F., Determination of trace elements of some Egyptian crops by instrumental neutron activation analysis, inductively coupled plasma-atomic emission spectrometric and flameless atomic absorption spectrophotometric analysis, J. Radioa~lal.Nucl. Chem., Articles, 98, 235, 1986. 135. Harada, T., Oishi, K., and Koyama, M., Radioactivation analysis of calcareous algae and laminariales, and the regularity of distribution of elements in the organisms, from bacteria to mammals, Bull. Jap. Soc. Sci. Fish., 49, 1135, 1983. 136. Kanias, G. D. and Philianos, S. M., Determination of trace elements in a medical plant by neutron activation analysis, J. Radioanal. Chem., 46, 87, 1978. 137. Asubiojo, 0 . I., Guinn, V. P., and Okunuga, A., Multielement analysis of Nigerian chewing sticks by instrumental neutron activation analysis, J. Radioanal. Chem., 74, 149, 1982. 138. Ndiokwere, C. L., Determination of constituent elements in some Nigerian medical plants by thermalneutron activation analysis, J . Radioanal. Nucl. Chem., Letters, 85, 325, 1984. 139. Ishida, I. and Koyama, K., Concentrations of some trace elements in pine needles determined by instrumental neutron activation analysis, Bull. Kanagawa P. H . Lab., 14, 33, 1984. 140. Tano, S., Eguchi, H., Koizumi, Y., and Yamaguchi, H., Comparisons of inorganic elements in barley seeds by neutron activation analysis with respect to varieties and cultivated locations, Radioisotopes. 28, 309, 1979. 141. Suzuki, S., Matsumoto, K., Okada, Y., and Hirai, S., Determination of trace elements in environmental reference material Tea Leaves by instrumental NAA, Bunseki Kagaku, 35, 993, 1986. 142. Amire, 0 . A., Trione, E. J., and Achmitt, R. A., Characterization of pathogenic races of the sugarcane smut fungus by neutron activation analysis, J . Radioanal. Chem., 75, 195, 1982. 143. Ahmad, S., Chaudhary, M. S., Mannan, A., and Qureshi, I. H., Determination of toxic elements in tea leaves by instrumental neutron activation analysis, J . Radioanal. Chem., 78, 375, 1983. 144. Suzuki, S., Hirai, S., and Noda, K., Determination of selenium in herb plants by neutron activation analysis using a coincidence counting method, Bunseki Kagaku, 31, 67, 1982. 145. Fukuzaki, N. and Moriyama, N., Non-destructive neutron activation analysis studies on a withering disease of lowland rice occurring near an iodine plant, J. Radioanal. Nucl. Chem., Articles, 90, 197, 1985. 146. Suess, A. and Staerk, H., The application of activation analysis for the control of bromide accumulation in vegetable, J. Radioanal. Chem.. 37, 905, 1977. 147. Guinn, V. P. and Miller, D. A., Recent instrumental neutron activation analysis studies utilizing very short-lived activities, J . Radioanal. Chem., 37, 3 13, 1977. 148. Hirai, S., Suzuki, S., and Okamoto, M., Determination of selenium in biological materials by neutron activation analysis using 77mSe,Bunseki Kagaku, 27, 435, 1978.
Volume 11
355
149. Naumov, A. P., Abugassa, I. O., and Turhin, V. V., Rapid neutron activation analysis of Se in fish, J . Radioanal. Nucl. Chem., Letters, 105, 141, 1986. 150. McKown, D. M. and Morris, J. S., Rapid measurement of selenium in biological samples using instrumental neutron activation analysis, J. Radioanal. Chem., 43, 41 1 , 1978. 151. Chatt, A. and Jayawickreme, C. K., Studies on selenoproteins in bovine kidney by gel chromatography and neutron activation, Trans. Am. Nucl. Soc., 53, 186, 1986. 152. DeSilva, K. N. and Chatt, A., A method to improve precision and detection limits for measuring trace elements through short-lived nuclides, J. Trace Microprobe Technol., 1, 307, 1982-83. 153. Behne, D.. Bratter, P., Gatschke, W., Gawlik, D., and Rosick, U., Non-destructive neutron activation analysis of copper in liver samples and other biological materials, J. Clin. Chem. Clin. Biochem., 15, 615, 1977. 154. Heydorn, K., Skanborg, P. Z., Gwozdz, R., Schmidt, J. O., and Wacks, M. E., Determination of lithium by instrumental neutron activation analysis, J. Radioanal. Chem.. 37, 155, 1977. 155. Chisela, F., Gawlik, D., and Bratter, P., Some problems associated with the use of boron carbide neutron filters for reactor epithermal neutron activation analysis (ENAA), J. Radioanal. Nucl. Chem., Articles, 98, 133, 1986. 156. Alfassi, Z. B., Epithermal neutron activation analysis, J. Radioanal. Nucl. Chem., Articles, 90, 151, 1985. 157. Rook, H. L., The determination of iodine in biological and environmental standard reference materials, J . Radioanal. Chem., 39, 351, 1977. 158. Sato, T. and Kato, T., Estimation of iodine in biological materials by epithermal neutron activation analysis, J . Radioanal. Chem., 68, 175, 1982. 159. Fardy, J. J. and McOrist, G. D., Determination o f iodine in milk products and biological standard reference materials by epithermal neutron activation analysis, J. Radioanal. Nucl. Chem., Letters, 87, 239, 1984. 160. Alfassi, Z. B. and Lavi, N., Rapid determination of halogens in milk by instrumental neutron activation analysis, J . Radioanal. Nucl. Chem., Articles, 90, 395. 1985. 161. Al-Shahristani, H. and Ahbass, K., Resonance activation analysis of iodine, J . Radioanal. Chem., 27, 105, 1975. 162. Lavi, N. and Alfassi, Z. B., Rapid determination of halogens in blood serum by instrumental neutronactivation analysis, Analyst, 109, 361, 1984. 163. Cesana, A. and Terrani, M., Determination of P in bones and of Al and Si in pottery by activation with reactor neutrons, Int. J. Appl. Radiat. Isot., 35, 405, 1984. 164. Gatschke, W. and Gawlik, D., Simultaneous determination of aluminium and phosphorus by neutron activation analysis, J . Radioanal. Chem., 56, 203, 1980. 165. Kostadinov, K. and Djingova, R., Trace element analysis of biological materials by thermal and epithermal neutron activation analysis, J . Radioanal. Chem., 63, 5, 1981. 166. Hanna, A. G. and Al-Shahristani, H., Resonance activation analysis of biological materials, J . Radioanal. Chem.. 37, 581, 1977. 167. Brune, D. and Bivered, B., Epithermal neutron activation analysis of elements present in trace quantities in biological materials, Anal. Chim. Acta, 85, 41 1, 1976. 168, Kutera, J., Epithermal neutron activation analysis of trace elements in biological materials, Radiochem. Radioanal. Letters, 38, 229, 1979. 169. Parry, S. J., Evaluation of boron for the epithermal neutron activation analysis of short-lived radionuclides in geological and biological matrices, J. Radioanal. Nucl. Chem., Articles, 81, 143, 1984. 170. Chisela, F. and Bratter, P., Determination of trace elements in biological materials by instrumental epithermal neutron activation analysis, Anal. Chim. Acta, 188, 85, 1986. 17 1. Ahafia, A. K. and Jiggins, A. H., The recoil proton effect: the effect of sample mass and matrix composition on the yield of radionuclides produced by recoil protons, Znt. J. Appl. Radiat. Isotopes, 36, 203, 1985. 172. Abdel Samei, M. B., Elshafie, M. A., Hanna, M., Csikai, J. and Juhasz, M., Determination of protein content in some foodstuffs using 14 MeV NAA, J. Radioanal. Nucl. Chem., Letters. 103, 81, 1986. 173. Mizumoto, Y. and Iwata, S., Determination of CaIP atomic ratio in calcium-hydroxyapatite by neutron activation analysis, Radioisotopes, 32, 22, 1983. 174. Chaudhri, M. A., Determination of calcium and phosphorus in small bone biopsies by activation with cyclotron produced neutrons, Int. J. Appl. Radiat. Isot., 30, 179, 1980. 175. Woittiez, J. R. W. and Das, H. A., Determination of calcium, phosphorus and fluorine in bone by instrumental fast neutron activation analysis, J. Radioanal. Chem., 59, 213, 1980. 176. Kafara, S. I., Anisimov, B. V. and Tolkachev, I. V., Automatic activation analysis of fertilizers and plant samples by fast neutrons, J. Radioanal. Nucl. Chem., Articles, 97, 341, 1986. 177. Faanhof, A., Das, H. A., and Zonderhuis, J., Possibilities of the elemental analysis of dry biological material by fast neutron activation analysis, J . Radioanal. Chem., 56, 173, 1980. 178. Gladney, E. S., Elemental concentrations in NBS biological and environmental standard reference materials, Anal. Chim. Acta, 118, 385, 1980.
356
Activation Analysis
179. Chattopadhyay, A. and Jervis, R. E., Multielement determination in market-garden soils by instrumental photon activation analysis, Anal. Chem., 46, 1630, 1974. 180. Kato, T., Sato, N., and Suzuki, N., Multielement photon activation analysis of biological materials, Anal. Chim. Acta, 81,337, 1976. 181, Sato, N., Kato, T., and Suzuki, N., Multielement determination in tobacco leaves by photon activation analysis, J. Radioanal. Chem., 36, 221, 1977. 182. Williams, D. R. and Hislop, J. S., The nondestructive determination of iodine in soils and biological materials by high energy gamma-photon activation, J. Radioanal. Chem., 39, 359, 1977. 183. Sato, T., The determination of zirconium in biological materials by photon activation analysis, J. Radioanal. Nucl. Chem., Letters, 86, 141, 1984. 184. Galatanu, V. and Engelmann, C., Analyse multielementaire des cheveux par photoactivation nucleaire, J . Radioanal. Chem., 74, 161, 1982. 185. Yagi, M. and Masumoto, K., New internal standard method for activation analysis and its application. Determination of Co, Ni, Rb, Sr in pepperbush by means of photon activation, J. Radioanal. Nucl. Chem., Articles, 83, 319, 1984. 186. Yagi, M. and Masumoto, K., Stable-isotope dilution activation analysis for special samples in which the self-shielding effect is negligible. Determination of strontium in biological materials by means of photon activation, J. Radioanal. Nucl. Chem., Articles, 90, 91, 1985. 187. Sato, T. and Kato, T., A study of trace analysis by photon-activation-LEPS, Res. Rep. Lab. Nucl. Sci. Tohoku Univ., 18, 98, 1985. 188. Mori, K., Sato, T., and Kato, T., The determination of Trace Elements in Biological Materials by LEPS with Photon Activation, presented at The 24th Annual Meeting on Radioisotopes in the Physical Sciences and Industries, Tokyo, June 29 to July 1, 1987, 97. 189. Constantinescu, B., Ivanov, E., Plostinaru, D., Popa-Nemoiu, A., and Pascovici, G., Analysis of protein content in cereals by total nitrogen proton activation, J. Radioanal. Nucl. Chem., Articles, 91, 389, 1985. 190. Cantone, M. C., Molho, N., and Pirola, L., Trace elements analysis in biological samples by proton nuclear activation, Clin. Phys. Physiol. Meas., 3, 67, 1982. 191. Cantone, M. C., Molho, N., and Pirola, L., Cadmium and titanium in human serum determined by proton nuclear activation, J. Radioanal. Nucl. Chem., Articles, 91, 197, 1985. 192. Bonardi, M., Birattari, C., Gilardi, M. C., Pietra, R., and Sabbioni, E., Development of proton activation analysis for the determination of heavy metals in biological matrices: excitation functions, irradiation system and selective radiochemical separations, J. Radioanal. Chem., 70, 337, 1982. 193. Masumoto, K. and Yagi, M., Charged particle activation analysis of phosphorus in biological materials, J . Radioanal. Chem., 78, 233, 1983. 194. Masumoto, K. and Yagi, M., Simultaneous determination of P, C1, K and Ca in several control serums by alpha-particle activation analysis applying the internal standard method, J. Radioanal. Nucl. Chem., Articles, 109, 591, 1987. 195. Yagi, M. and Masumoto, K., Instrumental charged-particle activation analysis of several selected elements in biological materials using the internal standard method, J. Radioanal. Nucl. Chem.. Articles, 111, 359, 1987. 196. Xenoulis, A. C., Aravantinos, A. E., and Douka, C. E., The stability of biological specimens during charged particle bombardment, J. Radioanal. Chem., 77, 207, 1983. 197. Girardi, F. and Sabbioni, E., Selective removal of radio-sodium from neutron-activated materials by retention on hydrated antimony pentoxide, J. Radioanal. Chem.. 1, 169, 1968. 198. Braun, T., Bull, P., Fardy, J., Haiduc, I., Macasek, F., McDowell, W. J., Misak, Z., Navratil, J. D., and Sato, T., Some development for radioanalytical separations, J. Radioanal. Nucl. Chem., Articles, 84, 461, 1984. 199. Pietra, R., Sabbioni, E., Gallorini, M., and Orvini, E., Environmental, toxicological and biomedical research on trace elements: radiochemical separations for neutron activation analysis, J. Radioanal. Nucl. Chem., Articles, 102, 69, 1986. 200. Schelhorn, H. and Geisler, M., Zum Einsatz von Radiotracern zur Ausbeutebestimmung in der Neutronenaktivierungsananalyse, J. Radioanal. Nucl. Chem., Articles, 83, 5, 1984. 201. Izak-Biran, T. and Guinn, V. P., Determination of cesium and potassium in marine species by neutron activation analysis, J . Radioanal. Chem., 55, 61, 1980. 202. Stulzaft, O., Maziere, B., and Ly, S., Gallium determination in biological samples, J. Radioanal. Chem., 55, 291, 1980. 203. Foldzifiska, A. and Dybczyiski, R., Neutron activation analysis of biological materials for sub ppm amounts of mercury without determining the chemical yield, J. Radioanal. Chem., 31, 89, 1976. mercury in biological materials, Radiochem. Radioanal. Lett., 58, 175, 1983.
Volume 11
357
205. Gvardjancic, I., Kosta, L., and Dermelj, M.. Determination of iodine in reference materials by activation analysis, J. Radioanal. Chem., 58, 359, 1980. 206. Takagi, H., Kimura, T., Iwashima, K., and Yamagata, N., A simple and rapid method for the determination of iodine in rice samples by radiochemical neutron activation analysis, Bunseki Kagaku, 32, 512, 1983. 207. Nadkarni, R. A. and Morrison, G. H., Determination of molybdenum by neutron activation and Srafion NMRR ion exchange resin separation, Anal. Chem., 50, 294, 1978. 208. Versieck, J., Hoste, J., Barbier, F., Vanballenberghe, L., de Rudder, J., and Cornelis, R., Determination of molybdenum in human serum by neutron activation analysis, Clin. Chim. Acta, 87, 135, 1978. 209. Allen, R. 0. and Steinnes, E., Determination of vanadium in biological materials by radiochemical neutron activation analysis, Anal. Chem., 50, 1553, 1978. 210. Osborn, T. W., Broering, W. B., and Davis, T. L., The determination of zirconium in animal tissues by neutron activation and y-spectrometry, Anal. Chim. Acta, 128, 213, 1981. 21 1. Hoede, D. and van der Sloot, H. A., Apphcation of hydride generation for the determination of antimony and arsenic in biological materials by neutron activation analysis, Anal. Chim. Acta, 11 I, 321, 1979. 212. Zeisler, R. and Greenberg, R. R., Ultratrace determination of platinum in biological materials via neutron activation and radiochemical separation, J . Radioanal. Chem., 75, 27, 1982. 213. Greenberg, R. R., Simultaneous determination of mercury and cadmium in biological materials by radiochemical neutron activation analysis, Anal. Chem., 52, 676, 1980. 214. Brandone, A., Borroni, P. A., and Genova, N., Determination of arsenic, cadmium and mercury in biological samples by neutron activation analysis, Radiochem. Radioanal. Lett., 57, 83, 1983. 215. Rosenberg, R. J., Radiochemical activation analysis of arsenic, selenium and antimony in biolog~cal samples, J . Radioanal. Chem., 50, 109, 1979. 216. Fardy, J. J., McOrist, G. D., and Florence, T. M., Rapid radiochemical separation in neutron activation analysis. Part I. The use of C,,-bonded silica gel and selective complexation for determination of manganese, copper and zinc in biological materials, Anal. Chim. Acta, 159, 199, 1984. 217. Turel, Z. R. and Haldar, B. C., Radiochemical thermal neutron activation analysis of fish solubles, J . Radioanal. Nucl. Chem., Articles, 84, 109, 1984. 218. Tian, W.-Z. and Ehmann, W. D., Radiochemical neutron activation analysis for arsenic, cadmium, copper, and molybdenum in biological matrices, J. Radioanal. Nucl. Chem., Articles, 89, 109, 1985. 219. Miyata, S., Okuno, T., Nakamura, S., Nagata, H., Takada, J., Matsushita, R., and Koyama, M., Simultaneous determination of manganese, copper, zinc and iron in human blood cells by neutron activation analysis with special reference to the extraction using polytetrafluoroethylene (PTFE) porous membrane, Igaku No Ayumi, 129, 187, 1984. 220. Dermelj, M., Byrne, A. R., Franko, M., SmodiS, B., and Stegnar, P., The use of 4-nitro-o-phenylene diamine (4-NDP) and sodium diethyldithiocarbamate (Na-DDTC) in the radiochemical separation of Cd, Co, Cu, Se and Zn from different biological samples, J. Radioanal. Nucl. Chem., Letters, 106, 91, 1986. 221. Shinogi, M., Fukuda, K., Nakazawa, M., and Mori, I., Neutron activation analysis of normal and cadmium injected rat liver using ammonium pyrrolidinedithiocarbamate extraction, Radioisotopes, 29, 368, 1980. 222. Czauderna, M., Simultaneous determination of some trace elements in biological materials by neutron activation analysis, Int. J. Appl. Radial. Isot.. 35, 681, 1984. 223. Byrne, A. R., Dermelj, M., Kosta, L., and ~ u k k - ~ n i d a r iM., t , Radiochemical activation analysis in standardization of trace elements in biological reference materials at the nanogram level, Mikrochim. Acta, 1, 119, 1984. 224. Siripone, C.-I., Wals, G. D., and Das, H. A., Neutron activation analysis of dry biological materials using mineralization with a saturated Mg(NO,),-solution and scavenging by activated carbon, J . Radioanal. Chem., 79, 35, 1983. 225. Tjioe, P. S., de Goeij, J. J. M., and Houtman, J. P. W., Extended automated separation techniques in destructive neutron activation analysis; Application to various biological materials, including human tissues and blood, J. Radioanal. Chem., 37, 51 1, 1977. 226. Czauderna, M., Multielement neutron activation analysis of biological materials using chemical group separation and Ge(Li) gamma spectrometry, J . Radioanal. Nucl. Chem., Articles, 89. 13, 1985. 227. Schelenz, R., Dietary intake of 25 elements by man estimated by neutron activation analysis, J . Radioanul. Chem., 37, 539, 1977. 228. van der Sloot, H. A., Wals, G. D., Weers, C. A., and Das, H. A., Simultaneous elrmination of sodium24, potassium-42, bromine-82, and phosphorus-32 in the determination of trace elements in biological materials by neutron activation analysis, Anal. Chem., 52, 112, 1980. 229. Yu, J. C. and Wai, C. M., Dithiocarbamate extraction of gallium from natural waters and from biological samples for neutron activation analysis, Anal. Chem., 56, 1689, 1984. 230. Heydorn, K. and Damsgaard, E., Evaluation of botanical reference materials for the determination of vanadium in biological samples, J. Radioanal. Chem., 69, 131, 1982.
358
Activation Analysis
231. Bem, H. and Ryan, D. E., Determination of uranium in sea water and biological materials by neutron activation after selective preconcentration with I-(2-pyridy1azo)-2-naphthol, Anal. Chim. Acta, 158, 119, 1984. 232. Woittiez, J. R. W. and Das, H. A., On the possibilities of elemental analysis of human serum by neutron activation analysis to short-lived radionuclides with previous removal of sodium and chlorine, J. Radioanal. Chem., 68, 67, 1982. 233. Handl, J. and Kiihn, W., Activation analytical determination of 1291in bovine thyroid glands, J. Radioanal. Chem., 56, 213, 1980. 234. Yamato, A. and Katagiri, H., Determination of 1291 in seaweeds by neutron activation analysis, Radioisotopes, 30, 159, 1981. 235. Tsukada, M., Yamamoto, D., Yoshikawa, H., Endo, K. and Nakahara, H., Preconcentration of trace elements for neutron activation analysis using activable tracers, J . Radioanal. Nucl. Chem., Articles, 84, 223, 1984. 236. Wester, P. O., Concentration of 17 elements in subcellular fractions of beef heart tissue determined by neutron activation analysis, Biochim. Biophys. Acta, 109, 268, 1965. 237. Sato, T. and Kato, T., Determination of trace elements in subcellular fractions of liver and kidney from monkey by thermal neutron activation analysis, Radiochem. Radioanal. Lerters. 42, 227, 1980. 238. Chatt, A. and Jayawickreme, C. K., Characterizationof metalloproteins in bovine kidneys by instrumental neutron activation analysis, Trans. Am. Nucl. Soc., 49, 162, 1985. 239. Shinogi, M., Nakazawa, M., Fukuda, K., and Mori, I., The study of trace elements in organisms by neutron activation analysis. IV. The binding metal elements in cytosol proteins of normal and Cd injected rat liver, Yakugaku Zasshi, 101, 515, 1981. 240. Woittiez, J. R. W., van Kamp, G. J., and Das, H. A., Neutron activation analysis of human serum proteins, J. Radioanal. Chem., 70, 239, 1982. 241. McKinney, J. D., Abusamra, A., and Reed, J. H., Determination of organic-bound chlorine and bromine in human body fluids by neutron activation analysis, Anal. Chem., 55, 91, 1983. 242. Firouzbakht, M. L., Garmestani, S. K., Rack, E. P., and Blotcky, A. J., Determination of iodoamino acids and thyroid hormones in a urine matrix by neutron activation analysis, Anal. Chem., 53, 1746, 1981. 243. Opelanio, L. R., Rack, E. P., Blotcky, A. J., and Crow, F. W., Determination of chlorinated pesticides in urine by molecular neutron activation analysis, Anal. Chem., 55, 677, 1983. 244. Blotcky, A. J., Hansen, G. T., Opelanio-Buencamino, L.R., and Rack, E. P., Determination of trimethylselenoniumion in urine by ion-exchange chromatographyand molecular neutron activation analysis, Anal. Chem.. 57, 1937, 1985. 245. Sabbioni, E., Pietra, R., and Marafante, E., Metal metabolism in laboratory animals and human tissues as investigated by neutron activation analysis: current status and perspectives, J . Radioanal. Chem., 69, 381, 1982.
Volume 11
359
Chapter 8
ACTIVATION ANALYSIS OF COAL AND COAL EFFLUENTS
.
William D James
TABLE OF CONTENTS I.
Introduction ..................................................................... 360
I1 .
Comparison with Other Techniques ............................................. 360 A. Fast Neutron Activation Analysis ........................................360 B. Trace Element Analysis .................................................362 C. In-Situ Analysis ......................................................... 362 D. On-Line Analysis ........................................................362
I11.
Standardization ................................................................. 363
IV .
MajorIMinor Element Analysis .................................................363 A. Exploration .............................................................. 363 B. Utilization ............................................................... 365 C. Conversion .............................................................. 366
V.
Trace A. B. C. D.
VI .
Summary ....................................................................... 374
Element Analysis ......................................................... 369 Exploration ..............................................................369 Occurrence .............................................................. 371 Utilization ............................................................... 371 Environmental ........................................................... 371 1. Particulate Emissions ............................................371 2. Waste Disposal .................................................. 372 3. Toxicology ....................................................... 374
References .............................................................................. 375
360
Activation Analysis
I. INTRODUCTION Activation analysis techniques have been applied to numerous and varied fields of scientific endeavor. It can be argued that none are more naturally suited to application of the method than the study of the fossil fuels, particularly coal. Coal is considered "dirty" in that it is extremely inhomogeneous and defies our most persistent efforts to characterize it. In addition, many related substances which are produced during mining, combustion, or disposal of coal wastes are of physical forms which resist classical analytical handling and sample preparation. Analytical techniques which require foreknowledge of chemical form or structure, or sometimes even dissolution of the coal material to be studied are often found to be sadly inadequate. The nuclear techniques inherently bypass many pitfalls and have been heavily relied upon over the last few decades for coal and coal-effluent characterization. A survey of existing literature regarding application of activation analysis to fossil fuels reveal interesting but perhaps not surprising trends. Interest in utilization of coal is obviously tied very intimately with economic parameters having to do with cost of producing energy. The need for analytical support for coal utilization and the pressure for coal-related research on technique development and application is also dependent on these same parameters. One possible indicator of the impact variations in these parameters have had on activation analysis applications is through a comparison of coal-related papers presented at international activation conferences to those on other subjects. Figure 1 presents graphically this fraction of papers presented at the major series of activation analysis conferences held over the past 20 years. Primarily shown are data from the Modem Trends in Activation Analysis series of conferences and the Nuclear Methods in Environmental and Energy Research conferences, the latter perhaps better known by activation analysis practitioners as the "Missouri" conferences. In addition, topical nuclear technique meetings which were not focused on any particular application are included. One can quite easily note the large peak representing extensive research interest in fossil fuel analytical methodology during the 1970s which has now greatly subsided. The Missouri conferences, international in scope, but dominated by U.S. researchers, show a considerably greater peak. This information is likely explained by the accompanying plot in Figure 2 of refinery acquisition costs of crude oil over the same time period.' The phenomenon is especially evident in U.S. oriented work due to the reevaluation of energy utilization policies that occurred because of the oil embargo of the early 1970s. In any case, the quantity of reported research on coal and other fossil fuels has reduced in recent times. That is not to say, however, that fewer analyses are being carried out using neutron activation analysis. On the contrary, the spurt of development which occurred in the 1970s has resulted in nuclear techniques which can be used satisfactorily on a routine basis for exploration of coal, assaying its quality, estimation of waste disposal requirements, and evaluation of the impact of its combustion on the environment. The technique has matured into a tool which far surpasses its value as only a basic research method. Activation analysis and related techniques are now providing means for more streamlined, efficient use of coal and thereby adding to the long-term value of this precious natural resource.
11. COMPARISON WITH OTHER TECHNIQUES A. FAST NEUTRON ACTIVATION ANALYSIS Routine proximate coal analysis includes determination of oxygen and nitrogen by nonnuclear techniques. Oxygen content is important to coal-conversion technologies in that catalytic activation of some organic oxygen atoms are thought to be responsible for influencing conversion reactions. Even though significant importance has been placed on knowledge of oxygen concentrations of coal materials, it routinely continues to be determined by
Volume 11
361
1970
Y ERR FIGURE I . Percentage of papers presented at activation analysis conferences which are concerned with fossil fuels. Data from Modem Trends in Activation Analysis series of conferences (MT), the Nuclear Methods in Environmental and Energy Research (Missouri-MO), and topical meetings held in Halifax, Nova Scotia (H), and Kona, Hawaii (K).
1975 YEAR FIGURE 2.
Acquisition cost at U.S. refineries of composite (U.S. plus foreign) crude oil.
362
Activation Analysis
the conventional method of differen~e.~ That is, all other major elements are determined and their sum subtracted from 100%. Nitrogen levels in coal are of importance primarily due to concern for the possible release of nitrogen-containing compounds during conversion. The classical Kjeldahl method for nitrogen is commonly used for quantitation. This technique is highly dependent on the chemical environment of the nitrogen atom. Application to an inhomogeneous matrix, such as coal, is likely to result in underestimating nitrogen content. Activation analysis using fast neutrons is uniquely suited for the accurate and sensitive determination of these two elements in coals and their p r o d ~ c t s .The ~ - ~procedures for both elements are rapid, reliable, and inexpensive. Tedious, time-consuming procedures are avoided and resulting precisions are far better than conventional techniques. Little attention has been paid to these techniques, other than for research purposes, even though the methodologies have been available for many years.
B. TRACE ELEMENT ANALYSIS The inherent advantages of activation analysis have made it the method of choice in coal research and development efforts concerning trace constituents. Its multielement nature, the lack of a requirement for extensive sample preparation and handling, and excellent sensitivity are features which have not been equaled by any other technique. Review of reference material certification programs by the International Atomic Energy Agency, the United States National Institute of Standards and Technology, etc., clearly indicates neutron activation analysis to be a technique which can be and often is used to standardize or evaluate other methods.9-" Most recently, however, significant progress has been made in the field of inductively coupled argon plasma emission spectrometry (ICPES). This powerful technique has the capability to compete with neutron activation analysis in many applications. ICPES requires knowledgeable practitioners to account for numerous possible interferences and can certainly produce erroneous results if care is not taken. However, the lack of requirement for a high intensity nuclear source, such as a nuclear reactor, has prompted many coal researchers to base their work on this emerging methodology. While techniques such as atomic absorption are capable of determining many trace level contaminants in coal and are in fact routinely used for that purpose, breadth of applicability is lacking because of their single elemental nature. They provide useful tools for specific elements for which they are best suited, but are not considered to be most efficient for trace analysis when many elements are of interest. C. IN-SITU ANALYSIS One area in which few techniques can compete with nuclear methodology is in-situ analysis. The development of exploration techniques which occurred during the oil lean years of the 1970s (the oil boom) resulted in the rapid advancement of borehole logging procedures. Of course, nuclear assaying of mining boreholes is not limited to coal production, but is tied very closely to energy production. While methods vary, essentially all depend on assaying of radio-emissions either of natural isotopes present in the formation or of isotopes induced by some nuclear bombarding particle. Information comparable to that obtained through borehole logging can be obtained by other techniques only through the collection and extrusion of drill cores and their subsequent chemical analysis.12 This, of course, defeats the primary advantages of in-situ analysis because it requires much more expensive drilling techniques and consumes much more time.
D. ON-LINE ANALYSIS Perhaps one of the most successfully applied nuclear techniques is that of the on-line analyzers available for installation in coal-fired power combustion facilities. These provide a continuous stream of data to facility operators concerning coal quality and physical pa-
Volume 11
363
rameters which affect the operating efficiency of the plant. Alternatively, nonnuclear methods have not been successfully developed nor fielded.
111. STANDARDIZATION The wide disparity of analytical results which is often found for the characterization of like material using various techniques and performed by different laboratories has been generally recognized for many years. The case for preparation of standard reference materials to provide continuity of quality control has been made.14 Because coal characterization is routinely performed by personnel from widely varying backgrounds and levels of training, one might expect appropriate reference materials to be especially important. In fact, several coal-related standard reference materials have been prepared and are generally available. Perhaps the most heavily utilized and often quoted reference materials are the United States National Institute of Standards and Technology (NIST) series. The first of this series to be produced were single element standard reference materials (SRMs) 1630 and 1631, Trace Mercury in Coal and Sulfur in Coal, respectively, produced about 1971 to 1973. The original trace element standard coal material, SRM 1632, was a blend of commercially available coals obtained from five power plants, carefully blended and bottled. Some 500 bottles were prepared (total of about 40 kg). The companion material, SRM 1633, trace elements in coal fly ash, was collected and prepared in a similar fashion. These materials were made available in 1974. Their popularity with the analytical community resulted in rapid depletion of the NIST inventory and their replacement became necessary. SRMs 1632a, 1633a, and 1635 became available about 1979 to 1983. SRM 1632a is a trace element reference material containing bituminous coal while SRM 1635 is a subbituminous coal material. These standard materials are in general use and available at the present time. The stated purpose for production of these standard reference materials is for the provision of quality control samples, that is samples to be analyzed along with other unknown samples; the results of which to be used in evaluating accuracy of the procedures. Users of routine comparator standard neutron activation analysis, which compares specific activities of unknown samples to known standard materials for elemental concentration evaluation, have, however, often incorporated standard reference materials into their procedures in lieu of primary standards.15.16While this is done much to the objection of many "purist" practitioners of the technique, others claim this use to be a legitimate use of these materials. In any case, use of standard reference materials in coal-related neutron activation for comparator standards, as well as for quality assurance is widespread.
IV. MAJORIMINOR ELEMENT ANALYSIS A large number of variations of neutron activation analysis have become well-established methods for characterization of major components of coal. The technique is beneficial in most all aspects of the coal-utilization cycle, from the earliest exploration stages, through evaluation of the combustion process, to determination of environmental consequences.It is, perhaps, the very applied areas relating to the economic feasibility of utilization that have adopted routine activation techniques to the greatest extent. The largest applications then may be the routine, some would perhaps even say the mundane, processes rather than the somewhat more exciting research and development.
A. EXPLORATION WylieI2 has recently reviewed methodology of nuclear assaying of boreholes and its application to coal logging. These techniques have considerable potential, but are, as yet, far from fully developed. Activation techniques in general use include both neutron activation
364
Activation Analysis
FIGURE 3. Log of captive gamma-ray count rate ratio R. (From Wylie, A. W., Nuclear Assaying of Mining Boreholes, Elsevier, Amsterdam, 1984, 297. With permission.)
followed by decay of radioactive species formed as well as neutron capture (prompt gamma activation analysis) gamma ray logging. The choice of a neutron source for mine borehole studies is strictly limited by the physical constraints of the borehole environment. Spontaneously fissioning 252Cf,beryllium-converted alpha emitters, such as AmBe or AcBe, and pulsed D, T neutron-generator devices have all been satisfactorily used, depending on the neutron energy required to produce the desired information. Perhaps the simplest activation borehole logging technique involves 252Cfexcitation of prompt gamma rays. Most elements potentially present in coal produce prompt gammas when interacting with thermal or near-thermal neutrons. This includes elements, such as carbon and hydrogen which may be of particular interest due to their relationship with the matrix, a major advantage over conventional neutron activation analysis. Much of the potential power of the method, however, has not been realized because of the insufficient resolution of standard gamma-detection devices, primarily scintillator detectors. Incorporation of high-resolution solid-state detectors into these systems promises substantial increase in usefulness, although surprisingly little progress has been made to date. Alternate techniques involving determinations of spectral coefficients or spectral window ratios, however, have been applied more successfully to date. In particular, determination of logs of the ratio "R", where,
R =
I(n,y)(2.9 - 9.6 MeV) I(n,y)(2.1 - 2.4 MeV)
compares signal from energy windows associated with elements found in ash or soils with that associated with hydrogen. Figure 3 demonstrates a typical ratio log for an Australian coal seam at a depth of 125 to 225 ft. Ash content of coal is often estimated from aluminum concentration. The neutron-capture procedure is not directly applicable to this measurement due to spectral interferences from other matrix elements. Aluminum may, however, be estimated by detecting gamma radiation
Volume 11
365
Depth ( f t ) FIGURE 4. Neutron activation log, readout for "A1 at 1.78 MeV. Compare to Figure 3 for the same coal seam. (From Wylie, A. W., Nuclear Assaying of Mining Boreholes, Elsevier, Amsterdam, 1984, 288. With permission.)
from the (n,y) reaction product, "A1, during its subsequent decay. In order to avoid background from prompt gamma rays, the source to detector must be maintained at a minimum distance of about 1.5 m, which limits the flexibility with which the logging tools may be designed. The neutron activation log presented in Figure 4 is seen to provide information comparable to the neutron capture ratio log for exploration of the same coal seam. Fission spectrum neutron energies are generally insufficient to induce particle-emission reactions. Another logging technique of considerable potential is the excitation of coal elements using fast neutrons produced from a particle-accelerator device. The neutron sources can either be used in a steady state or pulsed mode to induce either prompt gammas or gammas from radioactive decay of reaction products for stratigraphic logging of coal seams. Using these techniques, carbon can be determined directly from the delayed spectrum. Instrumentation requirements are generally more extensive, with a multichannel pulse height analyzer being necessary for data acquisition and computer facilities for spectrum stripping and data reduction.
B. UTILIZATION With the increased emphasis which we have experienced during the 1970s on the use of coal as a source of electric power generation, heightened realization of the need for maximum efficiency of coal utilization has taken place. At the same time, stricter enforcement of environmental standards for combustion has contributed to rising costs of power production and as a result made it economically necessary that every use factor affecting efficiency be closely monitored. Traditional means of documenting coal composition, including ash content, rank, and heat value, are not capable of providing pertinent information on a time scale that is of any real value for operational control of the combustion process. As a result, a new family of bulk coal nuclear analyzers has been born. Coal quality analyzers, which more or less monitor coal streams in plants and mines on a continuous real-time basis, have been similarly called Coalscan, Nucoalyzer (Nuclear Coal Analyzer), Sulfurmeter, and CONAC (Continuous On-line Nuclear Analyzer of Coal). Science Application, Inc. has been responsible for much of the developmental work on these devices, with primary support from the Electric Power Research Institute. They are based on prompt neutron activation analysis using a 252Cfsource of excitation, with a continuously moving stream of coal between the source and the gamma ray detection system. Latest
366
Activation Analysis
FIGURE 5. Schematic view of the Nucoalyzer. (From Brown, D. R., et a]., Atomic and Nuclear Methods in Fossil Energy Research, Filby, R. H . , Ed., Plenum Press, New York, 1982, 155. With permission.)
versions have incorporated germanium solid state detectors for high resolution evaluation of the complex spectra produced. Figure 5 depicts a schematic view of the Nucoalyzer." The device addresses the special problems of on-line evaluations of large mass quantities of bulk material, namely the requirement for a high-intensity source to minimize sample throughput while effective measurements can be made and the resulting need for high count rate spectroscopy to allow process control while maintaining satisfactory data statistics.
C. CONVERSION Oxygen is an element of importance to many phases of coal science. Particularly, however, in the area of conversion of coal to liquid or gaseous fuels does it play a significant role. The sites within the coal "molecule" which contain organically bound oxygen atoms are thought to be active sites for conversion catalysis. In addition, the presence of nitrogen in conversion intermediates is thought to affect catalytic processes as we11.18 Conventional analytical methods for these elements' determinations in coal include Kjeldahl procedures for nitrogen and perhaps pyrolytic measurements for oxygen. However, in most cases, oxygen has been determined routinely by difference, as described earlier. For proximate analysis, the resulting level of analytical uncertainties has been considered acceptable, but conversion research demands more precise and specific measurements. The laborious and time-consuming wet chemical methods mentioned before are not considered to be methods of choice for routine analysis of large sample loads. Fast neutron activation analysis of coals and related materials can be performed through excitation, utilizing high energy neutrons produced through the well known D,T fusion reaction of hydrogen. This reaction, which results from the bombardment of tritium targets with energetic deuterons, liberates over 17 MeV of energy, about 14 MeV in the form of
Volume 11
0
60
120
180
240
300
367
360
CHRNNFL NO.
FIGURE 6. Typical multichannel scaling spectrum for oxygen determination showing beam monitor and I6N decay counts. (From James, W. D. and Akanni, M. S., IEEE Trans. Nucl. Sci., Vol. NS-30(2), 1612, 1983. 0 1983 IEEE. With permission.)
kinetic energy of the neutron produced. Neutrons of other energies can be produced by similar reactions, but are generally much less useful. The abundant oxygen isotope, 1 6 0 (99.8%), interacts with energetic neutrons via the (n,p) reaction to form I6N, a 7.1-s beta emitter. Beta decay is accompanied by the characteristic emission of two very high energy gamma rays at 6.1 and 7.1 MeV (69% and 5% relative gamma intensities, respectively), which are commonly used for quantitation.19 These energies are, of course, much higher than essentially all other gammas associated with competing radioactivities produced, permitting the instrumental discrimination of unwanted activities on that basis. Routinely gammas of energy below -4.5 MeV are rejected. Experimentally very few interfering gamma energies fall above that limit. Possible interferences include fluorine, which upon fast neutron irradiation produces 16N from the (n,ct) reaction on 19F, and boron, which produces "Be, another high energy gamma emitter (6.8 MeV), by the (n,p) reaction on "B. Oxygen activity is then recorded using timerlscaler arrangement or a multichannel scaling pulse height a n a l y ~ e rThe . ~ multichannel scaling (MCS) procedure provides the added advantage of integral beam monitoring over short time periods which allows for continuous beam normalization. A typical resulting MCS spectrum is shown in Figure 6. A high degree of automation has been achieved for routine sample analysis.20
368
Activation Analysis
Time. min
FIGURE 7. Typical multichannel scaling spectrum for nitrogen determination showing beam monitor and I3N decay counts. (From James, W. D., et al., J. Radioanal Chem., 32, 198, 1976. With permission.)
Comparison of oxygen results obtained from analysis of bulk coal by fast neutron activation must be accomplished with care. A primary reason the technique has not been universally adopted for routine use concerns the inability to directly compare these results to oxygen determined by difference. Volborth et a1.6and other^'^.^' have adequately pointed out the need for reconsidering the standardized methods of reporting and calculating coal analysis. In any case, few coal-science workers fail to recognize the advantages of the direct oxygen measurement by FNAA. accomplished by employing the transformation, 14N (n,2n) 13N.The product of this reaction, 10-min "N, decays by positron emission, therefore resulting in annihilation radiation. The 0.51 1-MeV gammas are detected by two scintillator detectors, opposed about the sample, with counts registered if both gammas are detected coincidentally. This procedure has also proven successful in a MCS mode in which beam monitor counts are acquired during irradiation followed by the decay of annihilation gammas.20Decay-curve resolution may be required depending on the complexity of the activity observed. In the case of coal analysis, the only spectral interference observed is from decay of 2.5-min 30P,as can be noted on Figure 7 which shows a typical MCS nitrogen activation and decay spectrum. Routine measurements often adopt a 10- to 15-min delay period after end of irradiation to reduce phosphorus activities likely to be present in coal analysis to negligible levels. Other possible interferences are detailed in Table 1.4 Only those due to neutron activation of potassium and the carbon "knock-on" reactions are significant in coal samples. While the extent of these interferences are dependent on sample matrix, as well as composition of its irradiation
Volume 11
369
TABLE 1 Nuclear Data for Pertinent Reactions in Nitrogen Analysis
Element N Potential interferences: P K C Mo F C1 Na
Approximate concentration in bituminous coal 1.5%
50 PPm 0.16% 45% 9 PPm
167 ppm 0.36% 0.07%
Reaction I4N (n,2n) "N
Half-life 10 min
'IP (n,2n) "'P "K (n,2n) "K "c (p,y) "N I'C (p,n) I3N "Mo (n,2n) "Mo IyF (n,2n) IRF ' T I (n,2n) ' T I '3Na (n,2n) "Na
2.5 min 7.7 min
"'i")
lo min 10 15.5 min l I0 min 32 min 2.6 years
Cross-section 14 MeV 19 mb Error possible
I 1 mb 27 mb
0.3% 1.1%"
119 mb 51 mb 3.5 mb 13.8 mb
1.5%"
V e t e r m i n e d experimentally. From James, W . D., et al., J. Radioanal. Chem.. 32, 198, 1976. With permission
container, experimental measurements have determined them to be of the order of a few percent relative for coal samples irradiated and counted in polyethylene vials. While this effect is significant, it can be corrected for. Results for nitrogen measurements in coal by fast neutron activation analysis are consistently biased positive as compared to the ASTM Kjeldahl m e t h ~ dThe . ~ latter is known to be subject to loss of nitrogen, especially when it is present in the matrix in certain forms, including nitro, azo, and azoxy groups. It is likely that the discrepancy is due to these inadequacies of the Kjeldahl method.
V. TRACE ELEMENT ANALYSIS The strength of neutron activation analysis as a characterization tool in coal science is perhaps most closely tied to trace element analysis. The inherent sensitivity of the technique for many elements in a multielement analysis mode allows its use in the evaluation of traces of contaminants which are found in coal, coal-conversion products, and coal-combustion effluents. Table 2 presents consensus values for elemental concentrations in the original NIST standard reference coal and fly ash materials, SRM 1632 and SRM 1633.2' The importance of understanding the occurrence and distribution of these contaminants, as well as their behavior during coal utilization, is derived primarily from the possible harm their presence can cause to man and his environment. Trace elements, in themselves, are curious in that while several are known to have definite detrimental effects on the environment, those same elements and others have been shown to be necessary for optimum growth and development of biological organisms, including man. For that reason, care should, and usually is, exercised by analysts to not vilify these trace components with such sensitive techniques as neutron activation, but to use the techniques to help define their impact on the environment and our ecology.
A. EXPLORATION Neutron activation analysis has proven useful in coal exploration because of its multielement measurement characteristic. Knowledge of concentration levels of several components (or perhaps many) of a given material, gives rise to the possibility of "fingerprinting" the material for comparison with other materials of possible common origin. This "multi-
370
Activation Analysis
TABLE 2
Elemental Concentrations in NIST SRMs 1632 and 1633 (&g unless % indicated) Element
Na Mg (%) A](%)
SRM 1632 Coal
SRM 1633 Fly Ash
414 t 20 0.20 2 0.05 1.85 t 0.13
Si (%) C1
K (%I Ca (%) Sc Ti
v Cr Mn Fe (%) Co
890 0.28 0.43 3.7 1100 36 19.7 43 0.84 5.7
Ni
18
Zn As Se Br Rb Sr
30 6.5 3.4 19.3 21 161
125 0.03 0.05 0.3 100 3 & 0.9 t4 + 0.04 2 0.4 2 4 2 10 & 1.4 2 0.2 t 1.9 t 2 t 16 &
t t t t t
Y Zr Ag In Sb I Cs Ba La
Ce Sm
Eu Tb
Yb Lu Hf Ta
W
Pb Th U
0.06 t 0.03 0.20 -c 0.12 3.9 t 1.3 1.4 352 10.7 19.5 1.7 0.33 0.23 0.7 0.14 0.96 0.24 0.75
2 0.1
+
30
t 1.2 t 1.0 2 0.2
+ 0.04 t 0.05 t 0.1 2 0.01 t 0.05 t 0.04 -c 0.17
3.2 + 0.2 1.41 ? 0.07
variate" or "pattern recognition" analysis has been used heavily in environmental sourcing and archeometry applications. Attempts have been made to use trace element pattern recognition for mapping coal seams. Unfortunately the premise that the trace element pattern should be somewhat constant throughout the seam, has not been borne out. Chyi and coworkersz2have, however, determined that coal seams which have evolved adjacent to certain types of geologic formations might be identified by trace element pattern recognition analysis of the rock layers. Limestone formations, both above and below coal seams have been studied and shown to be sufficiently homogeneous but different from other formations to warrant multivariant analysis of seam overburden to provide mapping information prior to expensive mining operations.
Volume 11
371
B. OCCURRENCE The occurrence of trace elements has been studied in a great multitude of coals and coal ashes. Neutron activation analysis has proven to be a primary technique for many of these studies. While the distribution of the elements is of great concern, the modes of their occurrence within the coal matrix is perhaps more critical for the estimation of the impact of the use of the fuel.23Neutron activation analysis is considered a bulk elemental technique and must be coupled to other chemical or physical separation methods to provide information concerning speciation. Palmer and FilbyZ4recently presented one such compound procedure which is capable of determining trace element association with major, minor, and trace mineral components of the coal. This procedure includes standard techniques which may have been modified for direct interfacing with neutron activation. One such technique is size separation by dispersion of low temperature ash into water. Lithium carbonate was added to ensure complete dispersion of clays rather than the sodium salt which would normally be used to avoid high matrix activity associated with sodium during activation analysis. C. UTILIZATION The fate of trace elements from coal fuels during combustion25and conversion proces~es'~ has been extensively studied. When such a study is to be undertaken, researchers are faced with the task of choosing the analytical techniques to be employed. Because of the large number of elements that are commonly of interest, a variety of methods are normally used. In some cases, difficulty of measurement requires that some particular element be analyzed by a certain technique, very specific to that element. However, the bulk of the data must almost always be generated with a multielement method which economizes time and effort. Neutron activation has, therefore, been heavily used for this purpose. Material balance determinations are often used as checks to verify that elemental input into the combustion process has been adequately tracked into the various effluents of the process. One has only to observe the physical form of effluents to gain an appreciation of the difficulty of sampling of stream material in a quantitative manner. These effluents exist in the form of boiler slags and clinkers, ash or ash slurries as well as fine particulate-bearing exhaust gases. It is advantageous to utilize analytical methods which avoid the difficulties of sample handling, especially variable handling techniques made necessary by the differing effluent matrices involved. Possibility of elemental loss always exists if sample materials are to be dissolved for wet chemical analytical methods. Neutron activation analysis' capability of direct analysis of most sample types with very little preparation is of obvious value. Variations of these tracking studies have been employed to monitor effluents, determine the efficiencies of emission control devices, and to estimate the impact of alternative combustion techniques. D. ENVIRONMENTAL 1. Particulate Emissions
Perhaps the most serious and certainly the most visible source of contamination to the environment from coal combustion is through exhaust stack emissions. Sophisticated scrubbing devices have been designed which are capable of eliminating the direct release of most of the ash which would otherwise make up the bulk of the particulates of the stack gases. However, by their very nature, it is the smallest of the ash particulates which are most likely to avoid collection by these devices. Several investigators have noted a phenomenon in which trace element contents of certain trace elements are concentrated, sometimes greatly, in these smallest fly ash particle^.^'-^^ This trace element depletionkoncentration phenomenon, otherwise described as trace element partitioning, has now been extensively studied
372
Activation Analysis
using activation analysis techniques. The likely explanation for the phenomenon is a volatilization/recondensationmechani~rn.~' The extent of partitioning and, therefore, the hazard associated with fly ash emissions is closely associated with the combustion process itself (temperature, etc.) and the volatility of the elements (in the chemical form in which they exist within the coal matrix). Trace element partitioning has now been studied for many different coal materials and for alternative coal combustion techniques. One such alternative process which has received significant attention over the last ten years or so is magnetohydrodynamic (MHD) combustion of coal. This process enhances electric power production from conventional techniques (steam turbine) with that induced by the movement of ionized gases through high magnetic fields. The temperature at which the process proceeds is significantly higher than that of conventional combustion, resulting in the volatilization of greater numbers of species. Studies employing neutron activation analysis have shown significant alterations of trace element partitioning profiles, with increased concentrating ~ . ~ ' 8 represents evidence effects seen for some elements usually considered r e f r a ~ t o r y . ~Figure of increased element partitioning in MHD combustion. The ordinate axis is the log of the fractionation ratio, which is defined as:
where X, and X,,,, are concentrations of the element of interest in the particular sample and the input coal, respectively; and Ali and Al,,, are concentrations of the matrix element, aluminum, in the same materials. The abscissa axis represents location of sampling of analyzed materials, but can be thought of as decreasing in temperature of deposition. In the MHD process, the slag separates from combustion gases at about 4000°F. One will note that R, ratios for slag from the MHD study are invariably lower than that for the conventional plant25represented by the dotted line in the figure. As we move to downstream sampling locations where effluents were deposited at lower temperatures, elements which had been depleted in high temperature depositions are found to be concentrated. More volatile elements, such as As, Se, and Zn, known to fractionate in conventional combustion of coal, demonstrate increased partitioning. More significantly, partitioning of elements which do not partition in conventional coal burning has been demonstrated. Na, Cs, Rb, Ti, and V, as well as the seed element K, are depleted in the slag but greatly concentrated in the prequench ash and the stack ash.31 Another application for which neutron activation analysis is ideally suited is for the analysis of aerosols. The fine ash particles which are emitted from coal-combustion facilities are of such low mass and wide dispersion, that collection attempts usually result in rather small quantities of sample material. The inherent high sensitivity and freedom from requirement to dilute the sample through dissolution which the method enjoys, has resulted in its extensive use in air quality studies. In addition, multielement capabilities have contributed to researchers' ability to "source", or determine the complex multiple origins of, aerosols, including heavily contaminated urban air. Contributions of trace elements to urban aerosols from coal mining and combustion processes have been evaluated using this technique.32 2. Waste Disposal A consideration of far-reaching environmental consequence is the disposal of wastes generated during coal operations, primarily combustion. Tens of millions of tons of coal ash are generated annually in the U.S. alone. Attempts have been made to develop outlets for coal ash utilization. Roadbed preparation with ash materials and inclusion of ash into concrete as filler material are examples of this approach. However, only a small fraction of the huge tonnages produced are further utilized to date, with significant improvement unlikely
Volume I1
.*
-1.25
-1
0
.so coal
FIGURE 8.
Slag
ash
Stack
Log fractionation ratio vs. sampling location (decreasing deposition temperature)
in the near future. Most ash produced is removed from the combustion site, perhaps after first being ponded for temporary storage, with final disposal through landfill or mine refill. Possibility of leaching of harmful toxic trace elements from disposed coal ash and other effluents by rainwater and natural ground waters, with the result of contamination of this natural resource is a major concern. Activation analysis methods to evaluate the extent of elemental leaching from fly ash have been proposed.33Leaching behavior of various elements, related to the degree of solubility of the compounds in which these elements are bound in fly ash, have been studied using different leaching media, to include acid mine drainage water, mineral acids, and chelating solutions. The technique of laboratory leaching of previously neutron irradiated coal ash, followed by gamma-ray spectrometry of collected leachate fractions has been used.33Possibility of alteration of leaching behavior caused by the irradiation itself was evaluated and found not to be significant for coal ash. It is thought
374
Activation Analysis
that increased likelihood of reaction nuclides being ejected from organic molecular sites during irradiation may result in failure of this technique for evaluating leachability of coals or perhaps less completely combusted effluents.
3. Toxicology The presence of certain of the trace elements at elevated levels is known to contribute to a wide range of toxicological injuries to man and our ecological system. Trace element fallout from coal-combustion stack emissions becomes mixed with soils and can be assimilated in plants. There the elements may be freely exchanged as in the case of selenium, while others may be concentrated in certain plants or plant parts, as is cadmium.34However, documented cases of trace element toxicity in plants associated with coal combustion indicates its occurrence to be infrequent. More frequently noted are symptoms of toxicity in grazing animals after ingestion of contaminated vegetation. Because man regularly consumes a diet made up from some variety of food sources, his susceptibility to toxicological injury from eating plants is considered much less than animals, albeit possibly significant in certain highexposure situations. Perhaps, the most likely route of trace element exposure to man from coal-combustion effluents is via the atmosphere. The elements which are concentrated in the smallest size fractions of the fly ash which escapes collection devices, as well as the elements which remain volatilized until release has occurred, are added to the atmosphere and made available to man's respiratory system. Again, the chemical form in which the contamination occurs is of great importance to the likelihood of occurrence of harmful effects. The effects of respiration of certain elements, particularly those thought to be most harmful and likely to be released in significant quantities have been ~ t u d i e d . Unfortunately, ~~.~~ these studies generally require the researcher to expose the animals to contaminated materials via aerosols containing the element of interest in some chemical form; the form being, perhaps, one thought to be of likely occurrence in the effluent. The complexity of occurrence of most of the trace elements in effluents such as coal ash make this approach somewhat simplistic at best. Recently Ogugbuaja and co-workers3' applied neutron activation analysis techniques to the study of the uptake of trace elements directly from coal fly ash by the injection of the ash material into the lungs or stomachs of laboratory rats. Animals were then sacrificed after varying time periods, major organs were sampled and analyzed, and elemental balances were calculated. It was proposed that this direct exposure constitutes a more valid measurement of elemental uptake because the chemical speciation was not assumed. Results of this study indicated potential uptake by the rat system of As, Fe, Co, Se, Cr, and Zn from both intratracheal and intragastric administration of the ash. Most elements were seen to be primarily reemitted through fecal elimination,with significant retention in the spleen and liver. Arsenic was seen to become elevated in the blood system and reemitted, primarily, by the urinary system, especially for those rats exposed by instillation in the lungs.
VI. SUMMARY Nuclear activation analysis methodology has played an important role in all aspects of the characterization effort in coal science for the last few decades. Analytical technology developed to date has been most successfully employed in the routine procedures of exploration and utilization of coal. Borehole logging and coal quality monitoring by nuclear techniques are now well ingrained in "everyday" operations. Because of their special characteristics previously discussed, few alternative choices of techniques can be found for those in-situ and on-line applications. Instrumental neutron activation analysis has been and continues to be the dominant method for multielement trace characterization of coals and related products. Recent de-
Volume I1
375
velopment of ICPES has resulted in a technique which rivals NAA for sensitivity and multielemental capability, but of course, still requires additional sample handling and dissolution. The more important environmental questions we yet face concerning coal utilization will require methods which provide information concerning elemental speciation as well as bulk content. The prominence of coal-related research utilizing activation techniques in the future likely will depend on practitioners' ability and willingness to integrate activation methodology with other physical, chemical, and even biological techniques into meaningful research programs.
1. Basic Petroleum Data Handbook, Vol. VI, No. 3, American Petroleum Institute, Washington, D.C., 1986. 2. Ehmann, W. D., Koppenaal, D. W., Hamrin, C. E., Jr., Jones, W. C., Prasas, M. N., and Tian, W.-Z., Fuel, 65, 1563, 1986. 3. Hamrin, C. E., Jr., Maa, P. S., Chyi, L. L., and Ehmann, W. D., Fuel, 54, 70, 1974. 4. James, W. D., Ehmann, W. D., Hamrin, C. E., Jr., and Chyi, L. L., J. Radioanal. Chem., 32, 195, 1976. 5. Chyi, L. L., James, W. D., Ehmann, W. D., Sun, C . H., and Hamrin, C. E., Jr., 14 MeV neutron activation analysis of oxygen and nitrogen in coal, in Proc. Con$ Scientzfic and Industrial Applications of Small Accelerators, lnstitute of Electrical and Electronic Engineers, Inc., New York, 1976, 281. 6. Volborth, A., Miller, G. E., Garner, C. K., and Jerabek, P. A., Fuel, 56, 204, 1977. 7. Volborth, A., Miller, G. E., Garner, C. K., and Jerabek, P. A., Fuel, 57, 49, 1978. 8. Khalil, S. R., Koppenaal, D. W., and Ehmann, W. D., J. Radioanal. Chem., 57, 195, 1980. 9. Dybczynski, R., J . Radioanal. Chem., 60, 45, 1980. 10. Gills, T. E., Nuclear methods - an integral part of the NBS certification program, in Proc. Conf. Nucl. Methods Environ. Energy Research, Vogt, J . R . , Ed., Mayaguez, Puerto Rico, 1984, 634. , 1 1 . Parr, R. M., On the role of neutron activation analysis in the certification of a new reference material for trace element studies, mixed human diet, H-9, J. Radioanal, Nucl. Chem., 123, 259, 1988. 12. Wylie, A, W., Nuclear Assaying of Mining Boreholes, Elsevier, Amsterdam, 1984. 13. Lagarias, J. and Siogren, R., Eds., Conf. Proc. Principals and Applications of Continuous Coal Analysis. EPRI Conference Report EPRI-C5-989, Vol. 13, Nashville, TN, 1983. 14. Becker, D. A,, Primary standards in activation analysis, in Proc. Conf. on Modern Trends in Activation Analysis, Copenhagen, Denmark, J . Radioanal, Nucl. Chem., 113, 5, 1987. 15. Nadkarni, R. A. and Morrison, G. H., J . Radioanal. Chem., 43, 347, 1978. 16. Korotev, R. L., J . Radioanal. Nucl. Chem., 110, 159, 1987. 17. Brown, D. R., Bozorgmanesh, H., Gozani, T., and McQuaid, J., On-line nuclear analysis of coal and its uses, in Atomic and Nuclear Methods in Fossil Energy Research, Filby, R. H . , Ed.. Plenum Press, New York, 1982, 155. 18. Ehmann, W. D., Koppenaal, D. W., and Khalil, S. R., Fast neutron activation analysis of fossil fuels and liquification products, in Atomic and Nuclear Methods in Fossil Energy Research, Filby, R. H . , Ed., Plenum Press, New York, 1982, 69. 19. Nargowalla, S. S. and Przybylowicz, E. P., Activation Analysis With Neutron Generators, John Wiley & Sons, New York, 1973, 471. 20. James, W. D. and Akanni, M. S., Application of on-line laboratory computer analysis to fast neutron activation oxygen determinations, in Proc. C'onf. Application of Accelerators in Research and Industry, Duggan, J . R . and Morgan, I. I.., Eds., IEEE Trans. NS, NS-30, 1983, 1610. 21. Ondov, J. M., Zoller, W. H., Olmez, I., Aras, N. K., Gordon, G . E., Rancitelli, L. A., Abel, K. H., Filby, R. H., Shah, K R., and Ragaini, R. C., Anal. Chem., 47, 1102, 1975. 22. Chyi, L. L., Elizalde, L., Smith, G. E., and Ehmann, W. D., Multivariate analysis in characterization of limestone units based on minor- and trace-element contents, in Recent Advances in Geomathematics, An International Symposium, Meman, D. F., Ed., Pergamon Press, Oxford, 1978, 35. 23. Finkelman, R. B., Modes of occurrence of trace elements and minerals in coal, in Atomic and Nuclear Methods in Fossil Energy Research, Filby, R. H . , Ed.. Plenum Press, New York, 1982, 141. 24. Palmer, C. A. and Filby, R. H., Fuel, 63, 318, 1984.
376
Activation Analysis
25. Lyon, W. S., Trace Element Measurements at the Coal-jired Steam Plant, CRC Press, Boca Raton, FL, 1977. 26. Roseberry, L. M. and Dyer, F. F., Instrumental neutron activation analysis in the measurement of trace element distribution at two coal conversion plants, in Proc. Int. Conf. Nucl. Methods Environ. Energy Research, Vogt, J . R., Ed., U.S. Department of Energy, Mayaguez, Puerto Rico, 1984, 481. 27. Natusch, D. F. S., Wallace, J. R., and Evans, C. A., Science, 183, 202, 1974. 28. Davison, R. L., Natusch, D. F. S., Wallace, J. R., and Evans, C. A., Environ. Sci. Technol., 8, 1107, 1974. 29. Block, C. and Dams, R., Environ. Sci. Technol., 10, 1011, 1976. 30. Akanni, M. S., Ogugbuaja, O., and James, W. D., J. Radioanal. Chem., 79, 197, 1983. 31. James, W. D., Ogugbuaja, V. O., Glascock, M. D., and Attig, R. C., Partitioning of trace elements in MHD coal combustion effluents, in Proc. Int. Conf. on Nucl. Methods in Environ. and Energy Research, Vogt, J . R., Ed., U.S. Department of Energy, Mayaguez, Puerto Rico, 1984, 490. 32. Alpert, D. J. and Hopke, R. K., Resolving the sources of airborne particles for the regional air pollution study, in Proc. Int. Conf. on Nucl. Methods in Environ. and Energy Research. Vogt, J . R . , Ed., U.S. Department of Energy, Columbia, MO, 1980, 61. 33. James, W. D., Janghorbani, M., and Baxter, T., Anal. Chem., 49, 1994, 1977. 34. Piperno, E., Trace element emissions: aspects of environmental toxicology, in Trace Elements in Fuel, Babu, S. P., Ed., American Chemical Society, Washington, D.C., 1975, 192. 35. Kollmer, W. E. and Berg, D., J. Radioanal. Chem., 52, 189, 1979. 36. Kollmer, W. E., J. Radioanal. Chem., 57, 535, 1980. 37. Ogugbuaja, V. O., Element Bioaccumulation from Coal Fly Ash, Ph.D. Dissertation, Texas A & M
University, College Station, TX, 1984.
Volume 11
377
Chapter 9
NEUTRON ACTIVATION ANALYSIS OF WATER SAMPLES Yoshiyuki Tanizaki
TABLE OF CONTENTS Introduction .....................................................................
378
Pretreatment of Water Samples ................................................. 378 A. Sample Collection ....................................................... 378 B. Filtration ................................................................ 382 Instrumental Neutron Activation Analysis ....................................... 383 Preconcentration of Trace Elements by Evaporation ............................ 384 Preconcentration of Trace Elements by Chemical Separation ...................386 A. Adsorption .............................................................. 388 B. Coprecipitation .......................................................... 391 C. Ion Exchange ............................................................393 1. Anionic Exchanger ............................................... 394 2. Inorganic Ion Exchanger ......................................... 394 3. Chelating Resin ..................................................394 4. Chemically Modified Exchanger ................................. 395 D. Solvent Extraction ....................................................... 395 1. Extraction with APDC or Na-DDC .............................. 396 2. Extraction with Metal-DDC ......................................398 3. Extraction with Cation Exchanger ............................... 399 Radiochemical Separation ....................................................... 399 References .............................................................................. 400
378
Activation Analysis
I. INTRODUCTION The analysis of trace element concentrations in natural waters is of great importance not only to investigate the geochemical migration of the chemical species on the earth' surface, but to substantiate the environmental pollution in aquatic systems by human activities. The instrumental analytical methods, such as atomic absorption spectrometry, inductively coupled plasma optical emission spectroscopy, X-ray fluorescence spectrometry, anodic stripping voltammetry, and neutron activation analysis (NAA), are universally utilized for the determination of trace element concentrations in natural water samples. Among them, NAA is one of the most preferred methods for this purpose, because it makes possible the simultaneous determination of a great number of trace elements with high sensitivity and accuracy. Even by NAA with its high analytical sensitivity, however, its direct application to water samples is not always effective because of the following reasons. First, some trace elements may be present at very low concentrations in naturally occurring levels. It is difficult to determine these elements directly, because the irradiation of a large volume of water sample is limited in most reactor facilities. Secondly, the high concentrations of Na, C1, and Br, which occur abundantly in natural waters, produce an extremely high background level of radiation after neutron irradiation that totally masks the signals of most other elements. This becomes serious interference in the determination of many trace elements, in particular the elements producing short-lived and medium-lived radioactive nuclides. To solve these problems, the enrichment of trace elements of interest and the removal of major interfering elements are generally employed prior to neutron irradiation. The preconcentration methods, such as evaporation, adsorption, coprecipitation, ion exchange, and solvent extraction, are of particular interest for this purpose. On the other hand, radiochemical separations applied to water samples after neutron irradiation have some faults which are mentioned in a later section. Thus, it can be said that an inherent problem associated with NAA of water samples is finding the most suitable preconcentration method for the determination of trace elements in question, by which the irradiation and gamma-ray measurement become feasible. A great number of studies have been reported on NAA of natural water samples which include river water, lake water, ground water, rainwater, and seawater. Table 1 summarizes the nuclear properties of isotopes utilized for NAA and the elemental concentrations in natural waters reported in the articles.
11. PRETREATMENT OF WATER SAMPLES A. SAMPLE COLLECTION Natural water samples are collected using various kinds of sampling bottles which are made of polyethylene, polypropylene, polythene (high-density polyethylene), PyrexB-glass, or TeflonB. Among them, polythene, Teflon,@ and Pyrex@-glass(preferably siliconized) bottles are usually recommended, because their materials have relatively low concentrations of trace metal contaminants, and adsorption of trace metals on the walls of the bottles may be virtually disregarded within a few days of sample storage periods. To minimize contamination, the bottles used for sampling must be precleaned by soaking in a dilute analytical grade nitric acid (15) for a few days followed by repeated rinsing with bidistilled water, and in the field, with the water to be analyzed. The collection of river water sample is usually carried out in the middle of a river by immersing the bottle by hand to well below the surface. For a definite depth sampling of sea or lake water, a variety of types of water samplers are used. The commercially available water samplers used for trace element analysis were summarized by Batley and Gardner.' Rainwater samples are usually collected through a polyethylene funnel with about I-m diameter which is placed about 1 to 1.5 m above the ground.
TABLE 1 Nuclear Properties of Isotopes Utilized for NAA and Element Concentrations in Natural Waters Measured by NAA Analvtical value ( u d l ) Element
Nuclide
Half-life
tiamma-ray energy (keV)
Sensitivity' (I&
Short-life method Mg A1 C1 Ca Ti
v Mn Cu Br In Sn Te I DY Th
u
Mg-27 A1-28 C1-38 Ca-49 Ti-5 1 V-52 Mn-56 CU-66 Br-80 In- 1 16m Sn-125m Te-131 I- 128 Dy-165 Th-233 U-239
9.46 rnin 2.24 rnin 37.3 min 8.72 min 5.76 rnin 3.75 min 2.58 h 5.10 min 17.4 min 54.1 rnin 9.52 min 25.0 rnin 25.0 min 2.33 h 22.3 rnin 23.5 min
Medium-life method Na K Cu Zn Ga As Br Pd
Na-24 K-42 Cu-64 Zn-69m Ga-72 AS-76 Br-82 Pd- 109
15.0 h 12.4 h 12.7 h 14.0 h 14.1 h 26.3 h 35.3 h 13.5 h
Fresh water range (Average)
Seawater range (Average)
TABLE 1 (Continued) Nuclear Properties of Isotopes Utilized for NAA and Element Concentrations in Natural Waters Measured by NAA Analytical value (pgll) Element La Pr Sm Eu Ho Er W Hg
Nuclide La- 140 Pr-142 Sm-153 Eu- 152m Ho- 166 Er-171 W-187 Hg-197111
Half-life
Gamma-ray energy (keV)
Sensitivity' (I%)
40.3 h 19.1 h 46.7 h 9.3 h 26.8 h 7.5 h 23.9 h 23.8 h
Long-life method Ca Sc Cr Fe Co Ni Zn Se Rb Sr Zr Mo Ag Cd Sb Sb Cs
Ca-47 SC-46 Cr-5 1 Fe-59 Co-60 CO-58 Zn-65 Se-75 Rb-86 Sr-85 Zr-95 Tc-99m Ag- 11Om In-1 15m Sb-122 Sb-124 CS-134
4.54 d 83.8 d 27.7 d 44.6 d 5.27 years 70.8 d 244 d 118 d 18.8 d 64.8 d 64.0 d 2.75 d 252 d 2.23 d 2.68 d 60.2 d 2.06 years
Fresh water range (Average)
Seawater range (Average)
Ba-131 Ce-141 Nd-147 Eu-152 Gd-153 Tb-160 Tm-170 Yb-169 Yb-175 Lu- 177 Hf-181 Ta- 182 Ir- 192 Au-198 Hg-197 Hg-203 Pa-233 Np-329 a
12.0 d 32.5 d 12.0 d 13.0 years 242 d 72.1 d 129 d 30.0 d 4.19 d 6.71 d 42.4 d 115 d 74.2 d 2.70 d 2.67 d 46.8 d 27.0 d 2.35 d
Sensitivity is given in microgram amounts of each element resulting 1000 counts of gamma-peak area under the following conditions. Detector: Ge(HP) semi-conductive detector (ORTEC Model GMX15200) having absolute peak-counting efficiency shown in Figure 2; thermal neutron flux: 1 X 10'' n cm-2. s-I; short-life method: irradiation-time(T,) = 10 min, cooling-time(T,) = 3 min, measuring-time(T,) = 100 s; medium-life method: T, = 1 h, T, = 1 d, T, = 1000 s; longlife method: T, = 1 d, T, = 7 d, T, = 1OOOO s.
.
382
Activation Analysis
-
.e filter 142mm
FIGURE 1 . Vacuum-filtration apparatus made of Pyrexm-glass used for trace element analysis.
It is preferable to freeze the water samples immediately after collection and to keep then in a frozen state until required, in order to prevent any losses and contaminations of trace elements of interest. B. FILTRATION In order to separate the suspended materials from the dissolved species, as a general rule, the water sample is filtered immediately or at least within a day after the collection, through a membrane filter with 0.45 Fm pore size. If the filtration procedure is omitted, the distribution of chemical forms of trace elements tends to change by the contact of the dissolved species with suspended materials for extended periods of time. Furthermore, high bacterial concentrations associated with suspended materials will also lead to depletion of soluble metal species. For trace element analysis of water samples, a polycarbonate membrane with the brand name of NucleoporeB and a cellulose ester membrane with the brand name of SartoriusB or Millipore@are commonly used. In general, the cellulose ester membranes are more efficient to remove suspended materials than the polycarbonate one which tends to clog-up very quickly. While the pore-size discrimination of polycarbonate membrane is more accurate than that of the cellulose ester membranes,* one should choose the membranes according to the types of water samples to be analyzed and to the purpose of one's study. The membrane filter is previously washed by immersing in a dilute analytical-grade nitric acid for a few days followed by passing sufficient volumes of bidistilled water and of water samples to be analyzed through the filter. To avoid the contamination during the filtration, it is advisable that this procedure is carried out under dust-free conditions. Consideration should also be given to the materials of a filtration apparatus. In our laboratory, the vacuum-filtration system made of PyrexB-glass is routinely used (Figure I). The filtrate must be acidified immediately to a pH value of about 1 with spec-pure nitric acid. This acidification step is necessary to inhibit bacterial growth, to avoid the adsorption of trace elements on the wall of the bottle, and to strip any trace elements bonded to colloidal particles. The acidified filtrate is transferred into a precleaned Polythene or polyethylene container and then stored in a refrigerator until the time of analysis.
Volume 11
383
E n e r g y of gamma-ray ( MeV FIGURE 2. Absolute peak-counting efficiency of different volumes of water samples by Ge(HP) detector (Ortec Model GMX-15200 with 15% relative efficiency and 2.0-keV resolution of the 1332-keV %Co line). (From Muto, T., personal communication, 1987. With permission.)
111. INSTRUMENTAL NEUTRON ACTIVATION ANALYSIS One noteworthy advantage of NAA is that no preliminary treatment of samples is required. Instrumental neutron activation analysis (INAA) is simple, rapid, and free from unexpected errors based on contamination and loss. Therefore, INAA, when applied to water samples, seems to be suitable for routine analysis of trace elements in naturally occurring levels or pollution levels. Less attention, however, has been paid to the simultaneous determination of multitrace elements in natural waters by the INAA. Though NAA is well known for its high sensitivity, the concentrations of certain trace elements in natural waters are too low to determine directly. In order to determine these trace elements, a large volume of water sample is compulsory. But, it is discouraged by the increased pressure in an irradiation container, which results from the gas evolution through radiolysis of water during neutron irradiation. It was reported by Kim et al."hat the rate of gas production at a thermal neutron flux of 1013 n cm-' s c ' was observed to be 270 ml h ' per liter distilled water. The rate may increase with salt concentrations in water. The other limitations concerning the use of a large volume of water sample are as follows. 1. There may be substantial variations of neutron flux over large samples during the irradiation. The handling and containment of large samples may cause blank problems. 2. The gamma-ray counting of large samples will necessarily involve an unusual geo3. metrical configuration for which accurate calibration may be difficult. The peak-counting efficiency with Ge(Li) or Ge(HP) semiconductive detector drops 4. with increasing sample volume as illustrated in Figure 2. The irradiation of large samples is limited in most reactor facilities. 5.
-
-
Moreover, INAA of natural water samples is always subject to the interferences mainly caused by high 24Na(half-life = 15 h), 38Cl(half-life = 37 min), and 82Br(half-life = 35 h) activities produced from 23Na, 37C1, and 81Br, respectively. This is why it makes it impossible to determine most other elements whose neutron activation products have either comparable or shorter half-lives. Thus, the elements which can be determined by INAA at
384
Activation Analysis
naturally occurring levels in freshwater may be limited to Na, Al, C1, Ca, Sc, Cr Fe, Co, Zn, Rb, Br, and Cs. For seawater and other high-salinity natural water samples, only Na and C1 can be accurately determined without any preconcentration steps. Regardless of the above limitations, INAA technique has been employed to some types of freshwaters because of its ~implicity.~-'~ The author shows one typical procedure.
Example of Analytical Procedure About 10 ml of water sample is transferred into a clean ampoule (polyethylene for short-, quartz for long-irradiation) and then heat-sealed for neutron irradiations. Following a definite time of irradiation and suitable cooling period, the ampoule is cooled in ice water (for polyethylene ampoule) or liquid nitrogen (for quartz ampoule) and then the tip of the ampoule is cut off. The sample is transferred into a new vial designed for gamma-ray counting. This sample transfer step is necessary to avoid the interferences of 24Naand other radioactivities produced in the irradiated ampoule. In a long-time irradiation of a large volume (>100 ml) of water sample, it is necessary to take into account the liberation of gasses produced through radiolysis of water and the corrections for neutron-flux gradient during the irradiati~n.~.~
IV. PRECONCENTRATION OF TRACE ELEMENTS BY
EVAPORATION Since trace element concentrations in natural waters are usually very low and a longtime irradiation of a large volume of water sample is discouraged in most reactor facilities, preconcentration techniques are needed in order to obtain high sensitivity and precision of the analysis. The simplest way for the preconcentration of trace elements is by evaporation. The advantages of the evaporation method, compared with other preconcentration techniques, are as follows. 1.
2. 3.
Since the method requires no chemical separation techniques, it is free from the inherent errors associated with chemical determination. Therefore, the method is very reproducible for most elements. The method is able to treat a large volume of water sample, accordingly, the high concentration factors of trace elements can be obtained. The method changes 1 1 of fresh water sample to a powder sample of about 10 to 500 mg that can be irradiated in a small container.
In addition, the modem development of a measuring technique for gamma radiation using a Ge(Li) or Ge(HP) semiconductive detector connected to multichannel pulse height analyzer, together with computing technique, makes possible the simultaneous measurement of the activities of a great many gamma emitters. Thus, it can be said that evaporation is one of the most attractive preconcentration methods for simultaneous determination of multitrace elements. Two techniques, heat-evaporation and freeze-drying, are commonly used for this purpose. In general, the heat-evaporation technique is subject to some difficulties, because the technique is carried out at a high temperature in open system. These difficulties include the contamination by fallout particles from laboratory atmosphere, the dissolution of ions from container surface, and the losses of some trace elements by volatilization. These difficulties are largely improved by using the freeze-drying technique. Since the freeze-drying technique is performed at a low temperature and low pressure in an air-tight system, the contaminations of sample and the losses of volatile elements are avoided. The freeze-drying technique, although potentially the most accurate, has several drawbacks.
Volume 11
385
First, since the technique concentrates all components including major cations and anions dissolved in water samples, the problems of matrix interfering of 24Na,' T l , and "Br are still not solved. Therefore, the application of this technique to seawater samples is largely limited. Secondly, a question may be raised regarding ability to transfer dry residue quantitatively from a freeze-drying container to an irradiation container. In addition, the drying procedure is time consuming so that it cannot be carried out in the sampling site. The second question, concerning sample transfer, may be eliminated by designing a freeze-drying container which also will serve as an irradiation container.'",20 Another approach for the quantitative transfer of the samples is the utilization of high-purity materials, such as spec-pure sodium carbonate2' or ultra carboqZ2as "carrier", which are added to water samples before the freeze-drying step. These attempts are effectively utilized to such water samples that the final residues after freeze-drying may be only a few milligrams. Many studies on the multielement determinations in natural water samples have been performed using h e a t - e v a p o r a t i ~ nor ~ ~f-r~e~e ~ e - d r y i n g " ~ ' ~techniques ~ ~ ~ - ~ ~ , prior ~ ~ - ~to~ neutron irradiation. The typical procedures of the evaporation method will be described below.
Example of Analytical Procedure I (Heat Evaporation) A 2-1 water sample is previously concentrated to about 50 ml using a rotary evaporator. The concentrate is dried on a PyrexB-glass dish under infrared lamps until a constant weight is reached. This procedure should be performed in a laminar-flow clean hood to avoid possible contamination by the fallout particles. The evaporated residue on the dish is exactly weighed, and the amount equivalent to about 1 1 of the original water sample is exactly transferred into a bag made of polyethylene with 0.03 mm thickness which is previously acid-washed. This bag is heat-sealed. The bag containing the sample is enclosed within a second bag made of polyethylene with 0.07 mm thickness, then heat-sealed. The second bag is necessary to prevent contamination during the handling and irradiation. The evaporated residue sample is first irradiated for 1 min at a thermal neutron flux of 1.5 x 10¹²n ~ m - s-I. ~ . The second polyethylene bag is removed 1 min after the irradiation, and the irradiated sample is repacked into a new polyethylene bag for the gamma-ray counting. Immediately, the sample is counted for 100 s on a coaxial Ge(HP) detector connected to a 4k-channel pulse-height analyzer to determine Mg (27Mg),A1 (2RA1),Ca (49Ca),and V (52V).The typical gamma-ray spectrum from the preconcentrated river water observed with the Ge(HP) detector is shown in Figure 3. The determination of Na (24Na), K (42K),and Mn (56Mn)are camed out by recounting for 200 s, 2 h after the irradiation in order to raise the sensitivity. The same sample is irradiated once more at the same neutron flux for 5 h. After cooling for 2 weeks, the sample is counted for 30000 s in order to determine Rb (8hRb),Ba (l3IBa), Sb (Iz2Sb),Yb (L75Yb),LU ( 1 7 7 L ~and ) , AU('"~AU). After the subsequent cooling for 50 d, the sample is recounted for 50000 s in order to determine Cr ("Cr), Fe (59Fe), Co (60Co), Ni ( T o ) , Zn (65Zn),Se (75Se),Sr (85Sr),Ag (IlomAg),Sb (lZ4Sb),CS (134C~), Ce (I4'Ce), Eu (Is2Eu), Tb (I60Tlb),Tm (17Tm), Yb (169Yb),Hf (I8'Hf), Ta (lX2Ta),Ir (I9'Ir), and Th (233Pa). The typical gamma-ray spectra from the preconcentrated river water are shown in Figure 4 a to c, which are observed with the Ge(HP) detector after cooling periods of 7, 14, and 50 d, respectively. The intense photopeaks and Compton backgrounds due to 24Naand "Br are found in Figure 4a, so the photopeaks of most other nuclides cannot be detected, except for very weak photopeaks of 47Ca-47Scand Iz2Sb. Figure 4b clearly shows different photopeaks of a great number of nuclides, although the interferences of 82Brand 47Ca-47Scare still observed. It is obvious from Figure 4c that after a cooling period of 50 d, there are no interferences from the 82Brand 47Ca-47S~ nuclides.
-
Activation Analysis
-
1 0
I
I
500 1 0 3
I
15CO
Gamma- Ray
, I 2033 2503 3C03 I
I
I
3503 40:
Energy ( keV )
FIGURE 3. Gamma-ray spectrum of the preconcentrated river water sample (heat-evaporation) observed with Ge(HP) detector after short-irradiation.Original water sample = about 1 1, thermal neutron flux = 1.5 X 10" n . ~ m . s-', - ~ irradiation time = 1 min, cooling time = 2 min, counting time = 100 s, distance from the top of the detector = 2 cm.
Special care should be paid to the determination of the following nuclides. For 65Zn determination, the 1115-keV gamma peak is used after subtracting the contribution of the 1121-keV gamma peak from '%c by referring to the 889-keV gamma peak. In a similar manner, 'Sr is determined using the 5 14-keV gamma peak after subtracting the contribution of the 5 11-keV annihilation peak from 65Znby referring to the 1115-keV gamma-peak.
Example of Analytical Procedure I1 (Freeze-Drying)" A 300-1111 aliquot of sample water is transferred to a 500-1111polyethylene bottle and then frozen at -70°C. The frozen sample is placed in the freeze-drying chamber (LABCONCO, Model FD-12) which is then evacuated; 2 or 3 d under a vacuum of mmHg are needed to dry 300 g of ice to a residue which remains on the bottom of the bottle. The residue is transferred quantitatively to a clean 100 ml-Teflon@beaker with the aid of small amounts of a mixture of ethanol and water (1:2), then dried overnight in an air bath of 120°C under clean conditions. The resulting residue is then transferred to two clean polyethylene irradiation bags, one of which is used for the short irradiation and the other for the long irradiation. The elemental concentrations in the sample are determined in the same way as described above.
V. PRECONCENTRATION OF TRACE ELEMENTS BY CHEMICAL SEPARATION Nonchemical preconcentration techniques like freeze-drying still suffer serious disadvantages as mentioned above, which make it impossible to determine many important trace elements (e.g., Cu, As, Mo, Cd, La, Sm, W, Hg, U, etc.). These disadvantages can be largely overcome by using some simple chemical preconcentration steps. The preconcentrations must be made to remove the interfering elements effectively while still keeping the high recovery of trace elements of interest. It is desirable that the preconcentration of a great number of trace elements is made at the same time by a one-step procedure. However, the procedures for selective concentration of a particular element are often required to make possible the determination of ultra-trace elements without interferences from other trace elements.
Volume I1
Gamma-Ray
6
Energy
( keV )
I
0
I
I
I
250
503
750
Gamma-Ray
I
0
250
I
500
I
Energy ( k e V )
I
750
Gamma -Ray
L
4
1003 1250 1500 1750 20:
I
loo0 1250
L
1500 1750 20
Energy ( keV )
FIGURE 4. Gamma-ray spectra of the preconcentrated river water (heat evaporation) observed with Ge(HP) detector after 5-h irradiation at a thermal neutron ~ . Original water sample = about 1 1: (a) cooling flux of 1.5 x 10¹²n ~ m - s-I. period = 7 d, counting time = 1000 s, distance from the top of the detector = 2 cm; (b) cooling period = 14 d, counting time = 30000 s; (c) cooling period = 50 d, counting time = 50000 s.
387
388
Activation Analysis
The following methods are usually employed for the enrichment of trace elements of interest and for the removal of interfering major elements from natural water samples. 1. 2. 3. 4.
Adsorption of metal chelates onto activated carbon and other solid phases. Coprecipitation or cocrystallization of trace elements with inorganic or organic collector agents. Separation of trace elements using ion exchangers or chelating resins. Solvent extraction of trace elements with complexing agents.
The combined use of the above four types of preconcentration methods and NAA must serve both to lower the determination limits of trace elements in water samples and to improve the accuracy of the determination. Since each of the above methods has its own advantages or disadvantages, the most suitable methods and optimum working conditions must be chosen for the determination of trace elements in question. Much attention should also be paid to the following viewpoints in order to obtain the satisfactory analytical results. First, great care is necessary to avoid any contamination and loss of determinants at all stages of the preconcentration procedures. It is required that the collector agents or the chemicals used during the procedures are of the highest purity available. The purity of these materials will become a limiting factor for the trace element determination. In general, the purification of the materials is not recommended, because it tends to cause unexpected contaminations. Second, it is indispensable to determine the blank-values of the elements of interest, which can be evaluated by running the whole preconcentration procedures with bidistilled water in the place of water samples to be analyzed. These blank-values must be subtracted from all measured values of the water samples. In the same manner, the recovery of trace elements of interest should be previously checked by tracer experiments and all measured values of the samples must be corrected afterwards. Third, special care must be paid to the problem ensuring complete collection of the trace elements. Since natural waters are complex systems, the trace elements may exist in many forms, e.g., simple ions, ion pairs, organic or inorganic complexes, and undissociated compounds. Adjustment of the condition of sample water by some methods, such as acidification, may be necessary to obtain the reliable analytical results. The author mentions each chemical-preconcentration methods.
A. ADSORPTION Adsorption of trace elements on activated carbon which does not induce radioactive nuclides by thermal neutron, is most frequently employed for the preconcentration of trace elements in natural water sample^.^."^-^^ The principal advantages of this method are the simplicity and rapidity, which allow the preconcentration to be performed at the sampling site. Other advantages of the method can be summarized as follows. 1.
2. 3.
The sample becomes more compact, which is of interest for the quantitative transfer of sample into an irradiation container and for the simultaneous irradiation of many samples. The adsorption leads to a good decontamination of Na, C1, and Br. Naturally occumng organic metal complexes can be adsorbed on activated carbon.
The only disadvantage is the problem of the blank-values of activated carbon, which govern the lower limits of determination. Much attention should be paid to keeping the blank-values low by a proper choice and pretreatment of activated carbon. The blank-values of some activated carbon reported by Nagatsuka et a1.53and Lieser et a1.40are given in Table
Volume I1
389
TABLE 2 Concentrations of Trace Elements in Activated Carbon Measured by INAA @gig) A" Ag A1 As Au Br
Ca Cd
Ce C1 Co Cr Cu Dy Eu Fe Hg In Ir K La Mg Mn Mo Na Ni Sb Sc Se Sm U
v
Zn Note
-
120-3100 0.94-7.6 0.0024-0.0079 0.55-2.3 1000-2200 ND
-
120-500 0.71-3.8 4.9-20 30- 130 ND-0.24 ND-0.089 78-6700 1.2-2.1 0.03-0.20 ND-0.013 59-2800 ND- I .0 590- 1400 0.52-99
39-1 100 ND-2900 0.06-1.00 0.02-1.12 -
0.01-0.25 -
12-15 ND- 190 A , Commercially available activated carbon (three brands); B, emission spectroscopic carbon powder; C, Merck-2186; D, Carbopuron-4n (Degussa).
2. The table shows that activated carbon named "emission spectroscopic carbon powder" and "Carbopuron-4n (Degussa)" have higher purity compared with other commercially available activated carbon. Prior to the adsorption step, the metal ions in natural water samples are converted to the organic structures using complexing agents, because in general, organic compounds are more effectively adsorbed on activated carbon than inorganic species. The following complexing agents are commonly utilized for this purpose: 8-hydroxyquinoline (oxine), diphenylthiocarbazone (dithizone), sodium diethyldithiocarbamate (Na-DDC), ammonium pyrrolidinedithiocarbamate (APDC), and L-ascorbicacid. The typical procedures will appear later. The recovery of trace elements by the adsorption on activated carbon are summarized in Table 3. Instead of activated carbon, hydrous iron (111) oxide can be used for the quantitative collections of trace elements, such as As, Cd, Co, Cu, Hg, Mo, Sb, Sn, Te, Ti, U, V, and This method, adsorption colloid flotation, is c&d out in the presence of iron(II1) and APDC at pH 5.8 using surface-active agents, such as sodium dodesylsulfate and sodium W.59960
390
Activation Analysis
TABLE 3
Percent Recovery of Trace Elements by Adsorption on Activated Carbon from Water Samples Chelatine agents
Trace element
Activated carbon only40
Dithizone"
Oxines2
Ag Au Cd Ce Co Cr Cu
85 100 49 87 40 91
85 100 95 82 81 96
DY
100 74 97 8453 100 50 95 77 100 96
30 95 90-100 90-100 80-90 99
Eu Fe Hf Hg In La Lu Mo Mn Ni Re Sc Se Sm Tb
u v W Yb Zn
1w3 95 77 9655 100 100 21 -
100
0-20
-
100 61 100 -
66 18
67 40
Ba Br Ca
-
10-3 2 -
1 -
lo-> -
-
90-100 90-100 >99 56 0 91 89 87" 88 90-100
As Sb
Cs K Li Mg Na
86
90-100 90-100 1OO5' 88
10-4
I 5' -0 <10 -0 -0 -0 variable -0
oleate. Polyurethane foam-loaded complexing agents, such as 1-(2-pyridylazo-2-naphthol) (PAN), diethylammonium diethyldithiocarbamate (DDC) are also employed as preconcentrating matrices for the elements of Au, Hg, In, and Sb.61
Example of Analytical Procedure IS3 A water sample (11) which has been stored at pH 1 after filtration, is transferred to a 2-1 beaker and the pH is adjusted to 6 with ammonia water. An amount of 20 mg APDC and 200 mg activated carbon (emission spectroscopic carbon powder) are added. After 30 min of stimng at 50°C in a water-bath, the carbon is separated by filtration through a prewashed filter paper and then the carbon on the filter paper is washed with bidistilled
391
Volume 11
TABLE 4 Coprecipitants Utilized for Collections of Trace Elements from Natural Water Samples Coprecipitants
WOW, AI(OH), PbS BiS Se PbAPOA Pb-APDC Oxine Oxine-OPPb a-Benzoin oxime P-Naphthoin oxime PANc Thionalide
"
Ref.
Elements of interest
Al, As, Sn, V , W, REEsa Ag, As, Co, Cr, Cu, Sb, Se. Sn, Zn Ag, As, Au, Cd, Cu, Hg, Sb, Sn Pd As, Au, Sb Ag, Cd, Cr, Cu, Mn, Th, U, Zr Co, Cu, Hg Cd Ag, Al, Co, Cu, Mn, Mo, U, V, Zn, Zr Mo, W Mo Ag, Cd, Co, Cr, Cu, Fe, Hf, Hg, In, Mn, Sc, Sn, Th, U, Zn, Zr As, Cu, Sb
La, Ce, Pr, Nd, Sm, Eu, Gd, Tb, Dy, Ho, Er, Tm, Yb, and Lu 0-Phenylphenol. I-(2-Pyridylazo-2-naphthol).
27, 30, 62-64 27, 30 27, 30 65 66
67 68 69 70 71 72 73-75 76
b
water. For the determination of mercury, the carbon is air-dried and then transferred into a precleaned quartz tube for 12-h irradiation. For the determination of copper, on the other hand, the carbon is dried under infrared lamps and then transferred into a polyethylene bag for a 5-min irradiation. Then the samples are irradiated and the mercury and copper contents are determined. The mercury content of "spectroscopic carbon powder" is 47 nglg as shown in Table 2. This content is considerably lower than that listed by heating the carbon powder in a quartz-tube at 950 to l W C under a stream of nitrogen. Example of Analytical Procedure 114' A 1-1 natural water sample is first shaken at pH 5.5 with the suspension of 30 mg activated carbon (Carbopuron4n) and 1 ml of an acetone solution containing 1 mg NaDDC. Then the activated carbon is separated by filtration. The filtrate is re-adjusted to pH 8.5 with ammonia water, and shaken again with the suspension of 30 mg activated carbon and 1 ml of an acetone solution containing 1 mg dithizone. After filtration, both fractions of the activated carbon are combined, dried, and transferred into a quartz ampoule for the irradiation. By this procedure, the following elements are collected with the recovery of 80 to 100%: Ag, Au, Cd, Ce, Co, Cr, Cu, Eu, Fe, Hf, Hg, In, La, Mo, Sc, U, and Zn.
B. COPRECIPITATION Coprecipitation is one of the most convenient preconcentration methods as well as the adsorption on activated carbon, by which it would be expected to facilitate the determination of many trace elements in natural water samples. A wide variety of coprecipitants have been used in conjunction with NAA as listed in Table 4. The colloidal inorganic coprecipitants such as iron(II1) hydroxide and aluminum are commonly utilized as effective collectors for many trace elements. Another method is the coprecipitation of trace elements as the sulfides with suitable carriers, such as lead27.30or This method is effective for the collections of the elements Ag, As, Au, Cd, Cu, Hg, Sb, Sn, and Pd. The organic coprecipitants such as 8-hydroxyquinoline ( o ~ i n e )0-phenylphenol ,~~ (OPP),"' 1-(2-pyridylazo-2-naphthol)(PAN),73-75 etc., are also very often applied for the collection of trace elements. The author shows the typical procedures using Fe(OH), and PAN as the coprecipitants.
392
Activation Analysis
I 0
I
250
I
500
I
750
1030
Gamma - Ray Energy
1250 1500 ( keV )
1
1
1750 2030
FIGURE 5. Gamma-ray spectrum of the preconcentrated river water (coprecipitation with iron [111] hydroxide) observed with Ge(HP) detector. Original water samples = about 1 I, thermal neutron flux = 1.5 X 10¹²n ~ r n - s-I, ~ . irradiation time = 5 h , cooling time = 1 d, counting time = 1000 s.
.
* Example of Analytical Procedure I: Fe(OH), A 1-1water sample, which has been stored in a polyethylene bottle at pH 1 after filtration, is previously concentrated to about 100 rnl using a rotary evaporator. The concentrate is transferred into a precleaned 200-ml beaker, and 0.5 ml of 1% Fe3' solution is added. The Fe3 solution utilized in this step is prepared by dissolving pure iron-rod of 99.999% (JonsonMatthey) with spec-pure nitric acid and hydrochloric acid. The pH is adjusted to 6 with ammonia water while being stirred. The sample solution is gently heated to boil on a hotplate for 30 min to digest the precipitate of Fe(OH),. The precipitate is then collected by filtration through a prewashed filter paper. The precipitate on the filter paper is repeatedly washed with a sufficient volume of hot-bidistilled water containing a trace amount of ammonia, and dried under infrared lamps. The filter paper containing the precipitate is folded and doubly enclosed into the polyethylene bags for the irradiation as mentioned above. Standards containing known amounts of each element and blank are also prepared in the same way as the water sample. The sample is irradiated along with the standard and blank for 5 h in a TRIGA-I1 reactor with a thermal neutron flux of 1.5 x 10¹² n cm-2 s-I. After cooling for 1 d, the outer polyethylene bag is removed and the irradiated sample is repacked into a new polyethylene bag and then counted for 1000 s with a Ge(HP) detector connected to a multichannel pulse-height analyzer. An example of gamma-ray spectrum of the preconcentrated river water sample is shown in Figure 5. The figure shows prominent photopeaks from the nuclides of interest 76As, 1 8 7 w, 239Np,140La, Is3Sm, 152mEu, and '66Ho, although the intense gamma rays from the interfering nuclides, such as 24Na, 82Br, and 59Fe, are still observed. In the analysis of seawater or other high-salinity water samples, it may be required that the coprecipitation procedure is repeated several times to remove the interfering elements satisfactorily. The nuclides, such as 99Mo-99mT~, 140Ba-'40La,are also produced from the fission of 23sU.For seawater samples with high-uranium concentration, therefore, it is necessary either to have previously removed the uranium through an anion exchange step or to correct the contribution of those nuclides from the fission products. +
.
Example of Analytical Procedure 11: PAN75 To 800 ml of seawater sample, 200 mg of hydroxyl ammonium chloride is added and
Volume I1
393
TABLE 5 Various Types of Ion Exchangers Utilized for Preconcentration of Trace Elements from Natural Water Samples Ion Exchanger Anionic exchanger AG-1x8 Rexyn-201 Zeokarb-226 IRA-400 LA- I Reeve Angel SB-2 Inorganic ion exchanger HAP" Chelating resin Chelex- 100 Dowex A-1 Chemically modified exchanger Zincon Diaion S#100 Oxine sulfonic acid Diaion S#100 Bathocuproine + Dowex- 1X4 Trien + DTC-celluloseh ASH' t A1203 PIDd Tosyl-cellulose
+
+
CS, a
+
SB-2
+
Elements of interest
Ref.
Th, U As, Cd, Zn
Cu Ag, Au, Cd, Co, Cu, Hg, Mn, U, Zn
u Hg, U, Zn Ag, Co, Cr, Cu, Fe, La, Lu, Mn, Mo, Sc, Sm, Ti, V, Zn Al, Ba, Ca, Cd, Ce, Co, Cr, Eu, Fe, La, Mg, Mn, Mo, Ni, Sc, Sn, Th, Ti, U, V, Zn Au, Ca, Cd, Co, Cu, Hg, Mn, Zn Cu, Hg, Zn As, Co, Cu, Hg, Mn, Zn Hg Cd, Cu, Hg Hg Al, Ag, Au, Co, Cr, Cu, Eu, Fe, La, Mn, Mo, Sb, Sc, Sm, U, V, W , Zn Cd, Co, Hg
Hydrated antimony pentoxide. Triethylenetetramine + dithiocarbamate cellulose Aniline sulfur resin. Piperazinedithiocahxylate.
the pH is adjusted to 4.0 with concentrated hydrochloric acid. The solution is stirred for 1 h, and after the pH is re-adjusted to 9.0, 3 ml of 1% PAN acetone solution is added slowly. The suspension is heated at 80°C for 1 h, cooled to room temperature, and filtered under suction through a Metricel@filter (pore size 0.45 pm). The wet precipitate is transferred to a small (215 dram) polyethylene irradiation vial and then dried in an oven at 60°C. The sample is irradiated for 10 min in order to determine Cd ("'"Cd), CO (60"C~),CU ( T u ) , Mn (56Mn),and U (23yU),and for 16 h in order to determine Cd ('I5Cd), Cr (Wr), U (23yNp), and Zn (6ymZn).
C. ION EXCHANGE The preconcentration method using ion exchange resins is also frequently employed to remove major elements and the majority of the interfering minor elements from natural water samples. The method, when used in column, is very suitable for the treatment of a large volume of water sample. By this method, the determination limits of trace elements of interest can be substantially lowered. Since the method has high decontamination factors for the major interfering elements, such as Na, C1, and Br, it would be expected to facilitate the analysis of seawater sample which is the most difficult material to determine trace elements. Four types of ion exchange resins, anionic exchanger, inorganic exchanger, chelating resin, and chemically modified exchanger, combined with NAA, are generally used for the determination of trace elements in natural water samples. These exchange resins are summarized in Table 5.
394
Activation Analysis
1. Anionic Exchanger
Anionic exchangers, a wide variety of which are on the market today, are most commonly utilized for the above purpose. For example, uranium can be readily trapped from natural waters as uranyl thiocyanide complex on Dowex AG-1X8.77Thorium, on the contrary, forms no anionic complex in hydrochloric acid media, so that the thorium can be separated not only from major elements but from the majority of interfering minor elements which form anions, by passing through the AG-1x8 column.78Rexyn-201 resin is used for the collections of As, Cd, and Zn, which is accomplished by passing 1 1 of sample solution through the In a similar manner, Zeokarbpolyethylene capsule containing 1 ml of the resin at pH 226,80and Amberlite IRA-4W8' resins are employed for the collections of Cu and of Ag, Au, Co, Cu, Hg , Mn, U, and Zn, respectively. Amberlite LA- 1 (liquid anionic exchange resin)" and Reeve Angel SB-2 (resin-loaded filter paper)83are also utilized to collect some trace elements from natural water samples.
Example of Analytical Procedure: LA-lS2 LA-1 resin (10 ml) (0.05 M kerosene solution) is added to 1 1 of filtered water sample with pH s 2 , and the mixture is shaken vigorously for 2 min, then allowed to stand for about 20 min until the aqueous and organic phases separate each other; 5 ml of the recovered organic phase is transferred into a 2-dram polyethylene vial for the irradiation. The amount of uranium in the organic phase is measured using a delayed-neutron counting facility. 2. Inorganic Ion Exchanger Although hydrated antimony pentoxide (HAP) is an excellent remover of 24Na,97it is not effective to utilize the HAP for the preirradiation removal of sodium, because some antimony is leached from the HAP column during the sodium removal process. The interferences of the gamma rays emitted from the nuclides '22mSb,122Sb,and lZ4Sbwhich are induced from the leached antimony, are so severe that no trace elements may be reliably determined. Nyarku and Chatt solved this problem by utilization of two other inorganic exchangers, acid aluminum oxide (AAO) and tin dioxide (TDO).84Antimony leached from the HAP column is perfectly removed by subsequently passing the sample solution through both exchanger columns.
3. Chelating Resin A chelating resin such as C h e l e ~ - 1 0 0 ~ ~Dowex - ~ ~ 0 r A-1'' is also often used for the preconcentration of trace elements of interest. Chelex-100 which is a strong complexing agent, quantitatively collects a great number of trace elements from natural water samples as listed in Table 6. Example of Analytical Procedure: Chelex-10088 A slurry of 3.3 ml of hydrated Chelex-100 resin (approximately 400 mg dry-weight) in the sodium form is packed into a polypropylene chromatographic column. The resin is washed with 5-ml volumes of 2.5 M nitric acid three times, followed by 5-ml volumes of bidistilled water twice. The seawater sample (100 ml or 200 ml) which has been filtered and preserved with nitric acid, is adjusted to a pH-range of 5.2 to 5.7 with ammonia water, then a few drops of 8 M ammonium acetate are added. The sample solution is passed through the resin, keeping the flow-rate below 0.8 mllmin. After passing the water sample through the resin, the resin is washed with two column volumes of bidistilled water followed by 10ml volumes of 1.0 M ammonium acetate four times to remove the alkali, alkaline-earth, and halogen elements. The resin is then washed with two bed volumes of bidistilled water and allowed to dry in the column under a clean air facility. The air-dried sample is transferred to a polyethylene bag for neutron irradiation. The irradiation is performed at a thermal
Volume 11
395
TABLE 6 Percent Recovery of Trace Elements by Chelex-100 Resin from Seawater
Trace element
Ba Cd Ce
Co Cr Cu Fe
La Mn Mo Ni Sc Sn Th
u v
Zn Note: Values given in pH 8 column are from Reference 85. Values given in the last column are from References 86 and 88.
.
.
neutron flux of 5 x 10¹³ n cm-2 s- ' for 2 min to determine Al, Ti, V, and Mn. The same sample is reirradiated along with standard and blank at the same flux for 2 h to determine Cd, Co, Cr, Cu, Eu, Fe, Mo, Ni, Sc, Sn, Th, U, and Zn.
4. Chemically Modified Exchanger For selective preconcentration of trace elements in natural water samples, chemically modified exchangers have been developed by several workers. For example, Akaiwa et al.8y-y3presented three kinds of chelating agent-loaded resins (CALRs). The CALRs are prepared by the adsorption of chelating agents on anion exchanger resins. Anion exchanger resins, such as Diaion SA#100 and Dowex-1x4 are converted to OH-type with ammonia water, and added to an aqueous solution of excess amounts of chelating agents having a strongly dissociative group (e.g., - SO,H), then stirred for 2 to 3 h. The mixture is then filtered, and washed with bidistilled water. For the preparations of CALRs, the following chelating agents are utilized: O-{2-[a-(2-hydroxy-5-sulfophenylazo)-benzylidene]-hydrazino} benzoic acid (zincon), oxine sulfonic acid (HOx), and 4,7-diphenyl-2,9-dimethyl-l , lOphenanthroline disulfonic acid (bathocuproine). The HOx-resin is suitable for simultaneous group concentration of chalcophile elements (e.g., As, Co, Cu, Hg, Mn, Zn).90-92On the other hand, z i n c ~ n -and ~ ~b. a~t h~ o c u p r ~ i n e -resins ~ , ~ ~ are effectively applied to the selective concentration of copper and mercury.
D. SOLVENT EXTRACTION The solvent extraction using chelating agents is preferred as the method to preconcentrate several ultra-trace elements because of its high selectivity and rapidity. The derivatives of dithiocarbamic acid, ammonium pyrrolidinedithiocarbarnate (APDC) and sodium diethyldithiocarbamate (Na-DDC), are commonly utilized as the chelating agents. It is well known that the metals, such as Ag, As, Au, Cu, Hg, Sb, etc., which form insoluble sulfides, can
396
Activation Analysis
react with the dithiocarbamates to give chelates. The resulting chelates are extractable by a variety of organic solvents. Since the extraction of metals with the dithiocarbamatesdepends on pH during the preconcentration procedure, it is possible to extract selectively a particular element by controlling the pH. Table 7 shows the applications of this method to the preconcentration of several trace elements.
1. Extraction with APDC or Na-DDC The extraction with APDC can be applied to the analysis of valence states of antimony and arsenic in natural waters.99The trivalent species, Sb(II1) and As(III), can be quantitatively extracted with APDC into chloroform over a wide-range of pH 0.6 to about 6. The pentavalent species, Sb(V) and As(V), on the other hand, are quantitatively extracted at pH <1, but not extractable at pH >3.0. Thus, the trivalent species can be separated from the pentavalent species by controlling.the pH of sample solution to a value between 3.5 and 5.5. The typical procedure will be presented later. In order to extract As@) alone from water sample, the pH-value of 1.5 is chosen, because the extraction efficiencies for Fe, Mn, and Zn are very low at pH <2, so that the radioactivities induced from these elements can be inhibited.98The trivalent antimony and arsenic can also be separated from their pentavalent species by extraction into chloroform as the DDC-chelates at pH 2.5 to 4.0."' The use of the mixture of APDC and Na-DDC may provide a better working pH range. For example, gallium is quantitatively extracted in a narrow pH range around 4 to 5 with Na-DDC and around 5 to 6 with APDC. When the mixture of APDC and Na-DDC is used, on the other hand, gallium is quantitativelyextracted from water samples at pH-range between 4 and 6.'02 Although Na-DDC is unstable in strong acid solution, the mixture of APDC and Na-DDC appear to form stable metal complexes. For example, molybdenum is quantitatively extracted into chloroform with the mixture at a wide pH range 0.7 to 4.0.'03 In the extraction of molybdenum from seawater sample, however, the pH-range of 1.3 to 1.5 should be chosen, because uranium can also be extracted at pH >2, which interferes with the determination of molybdenum by the 235U(n,f) 9 9 Mreaction. ~
Example of Analytical Procedure (APDC)99 Ten milliliters of 20% ammonium citrate buffer is added to a 100 ml aliquot of water sample, and the pH of the sample solution is adjusted to a value between 3.5 and 5.5. Four milliliters of 12.5% ethylenediaminetetraacetic acid (EDTA), 10 ml of chloroform, and 2 ml of 5% APDC aqueous solution are successively added to the sample solution, then the mixture is shaken vigorously for 10 min. The EDTA solution is utilized as a masking agent, because the degree of extraction of Sb(II1) and As(II1) with APDC may be significantly reduced due to the competition caused by other metals presented in natural water systems. The organic bond Sb(lI1) and As(II1) in chloroform are then back-extracted into 1.5 ml of 50% nitric acid solution by a shaking for 10 min. Incomplete extraction of As(II1) may result if the acid concentration is less than 30%, although Sb(II1) can be completely extracted into 20% nitric acid solution. After phase separation, 1 ml of the aqueous phase is transferred into a 215 dram polyethylene vial and heat-sealed for neutron irradiation. To determine total antimony and arsenic, 1 ml of 25% sodium thiosulfate solution and 1 ml of 20% potassium iodide solution are added to the second aliquot of the water sample, by which reductions of Sb(V) to Sb(II1) and of As(V) to As(II1) are accomplished. The mixture is extracted with APDC by the same procedures as described above. After 2 to 3 h irradiation and 24-h cooling period, antimony and arsenic are determined as the nuclides lZ2Sb(564 keV) and 76 AS (559 keV). The differences in antimony and arsenic concentrations between the two aliquots represent the amounts of Sb(V) and As(V) in the water sample.
TABLE 7 Preconcentration of Trace Elements by Solvent Extraction from Natural Water Samples Complexing agent APDC APDC Na-DDC APDC + Na-DDC APDC + Na-DDC Pb(DDC), Pb(DDC), Bi(DDC), Bi(DDC), HD (Liquid cation exchanger)
Organic solvent CHCI, CHCI, CHC1, CHCI, CHCI, CC1, CHCI, CHCI, CHCI, n-hexane
pH Condition 3-6 5.5 2.5-4.0 4-5 1.4
2-3
Back extraction 50% HNO,
dilute HNO, Pb(NO,), s o h
-
-
<1
-
3.5 0.018 M HC10,
5 N HNO,
Elements of interest
Ref.
As(III), Sb(II1) Ag, Au, Co, Cu, Fe, Ni, Sb, U, V , Zn As(III), Sb(II1) Ga Mo Hg Au, Cu, Hg Au, Hg Pd Al, Ca, Co, Cr, Cu, Eu, Fe, La, Mg, Mn, Sc, Sm, Zn
98, 99 42, 100 10 1 102 103 104 105, 106 107 108 109
398
Activation Analysis
2. Extraction with Metal-DDC Complexes Selective extraction of some heavy metals into chloroform from natural water samples can be effectively achieved by the use of metal dithiocarbamate complexes. The solvent extraction of metals (Mn+)with diethyldithiocarbamic acid (H-DDC) into organic solvent can be expressed by the following equation:
with the equilibrium constant K (extraction constant)
The extraction constants of metal-DDC complexes have been determined by several worke r ~ , " ~ -and " ~ it is known to decrease in the order Au3+,Pd2+, Hg2+, Ag+, Bi3+, Cu2+, Ni2+, Pb2+, In3+, Sb3+,Cd2+,As3+, Zn2+, Co2+,Fez+, and TI . Either Bi(DDC), or Pb(DDC), complex are generally used to extract several trace metals from water samples prior to neutron irradiation, because both bismuth and lead do not produce radioactive nuclides that would cause interferences in the gamma spectrometry. Metals, such as Au, Pd, Hg, and Ag, whose extraction constants are greater than that of Bi(II1) or Pb(II), can be extracted into chloroform with Bi(DDC), or Pb(DDC), complex. On the other hand, most of the heavy metals that exist in the environment (e.g., Mo, Se, In, Sb, Cd, As, Zn, Co, Fe, Mn, etc.) cannot be extracted with Bi(DDC), or Pb(DDC), complex, because the extraction constants of these metals are much lower than that of Bi(II1) or Pb(I1). In addition, the alkali, alkaline-earth, and halogen elements, which do not form complexes with DDC, are also eliminated. As a result, it becomes possible to preconcentrate selectively the trace metals of Au, Pd, Hg, and Ag from natural water samples. The solvent extraction method by Pb(DDC), is effectively applied to concentrate not only Au, Pd, Hg, and Ag, but Cu, because the extraction constant of Cu(I1) is greater than that of Pb(II).'05 The typical procedure will be described later. Gold and mercury in natural water samples can be selectively extracted by Bi(DDC), at pH range 0.3 to 1.0.'07 Extraction at pH <0.3 is not practical, because the decomposition of metal-DDC complexes is accelerated in such acid solution. At pH >1, on the other hand, the extraction efficiency decreases: at pH 2, only about 50% of the Au and Hg are recovered. Copper can also be partially extracted by Bi(DDC),, because the extraction constant of copper is close to that of bismuth. The presence of the intense 51 1-keV annihilation peak may interfere indirectly with the measurement of I9'Hg (77.6 keV) by producing from TU a high background radiation. To suppress the extraction of copper, the water samples are spiked with bismuth(II1): the extraction of copper can be suppressed to about 7% by adding 100 kg/ml Bi3 to 15 ml water sample. The extraction of palladium by Bi(DDC), depends on the type of acid.lo8The extraction in nitric acid medium is not suitable, probably because of the oxidation of Pd(I1) to Pd(1V) which is not extractable by DDC. Quantitative extraction of palladium is found in hydrochloric acid solution. Although palladium is quantitatively extracted at a wide range of pH, 0.5 to 7, the extraction of gold and mercury depends strongly on pH as mentioned above. The extraction efficiencies for Au and Hg decrease in pH > 1, reach a minimum around pH 3 to 4 (20 to 30%), and then increase again above pH 4.'08 As a consequence, it is obvious that to collect palladium selectively, the extraction should be carried out at pH between 3 and 4. +
+
Example of Analytical Procedure: Pb(DDC),Io5 A 50-ml filtered seawater sample is digested in a Sjostrand-type wet-oxidation reflux apparatus by adding the mixture of concentrated nitric acid and concentrated sulfuric acid.
Volume 11
399
This digestion step is needed in order to avoid colloidal formation of metals and to convert organometallic forms to inorganic ionic forms in the sample solution. After cooling, the solution is shaken with chloroform to remove bromine. The pH value of the aqueous solution is adjusted to 2 to 3 with 6 N sodium hydroxide solution. Hg, Au, and Cu are then extracted into chloroform solution of Pb(DDC),. The organic phase is washed with bidistilled water several times to remove sodium, then transferred into a quartz ampoule. Chloroform in the ampoule is evaporated completely at room temperature before being sealed for neutron irradiation. Hg , Au, and Cu are determined as the nuclides I9'Hg (77.6 keV), Iy8Au (412 keV), and TU (51 1 keV), respectively, following 6-h irradiation at a thermal neutron flux of 2 x 10¹² n cm-' S K I and a 10-h cooling period.
-
-
3. Extraction with Cation Exchanger Another approach to the concentration of trace elements and to the removal of major interfering elements is the use of liquid cation exchanger such as dinonylnaphthalene (abbreviated as HD). The preconcentration is achieved by extracting metal ions with HD in nhexane from natural water samples followed by back-extracting into a minimal volume of acid s o l u t i ~ n .This ' ~ method, however, is somewhat troublesome to use. Since a few percent of sodium are found in the resulting organic phase, it will be necessary to remove the 24Na after the irradiation using hydrated antimony pentoxide (HAP) column. In addition, because of its poor selectivity, practically all of the alkaline-earth elements like Ca and Mg can also be extracted. As a result, the gamma-ray measurement of ultra-trace metals of interest is subject to the interferences by relatively high level activities induced from these elements.
VI. RADIOCHEMICAL SEPARATION One of the major advantages associated with NAA lies in the ability of radiochemical separation after neutron irradiation, by which both the separation of nuclides in question and the removal of interfering nuclides can be achieved without the analytical errors based on reagent blanks and other types of contaminations. Its application to natural water samples, however, has several drawbacks. First, a large concentration factor cannot be obtained, because the volume of sample allowed in each irradiation is limited. Therefore, the combined use of preconcentration techniques (e.g., heat-evaporation, freeze-drying) and radiochemical separation is often required to make possible the determination of many trace elements. Second, to minimize the radiation dose to the analyst, the highly radioactive sample is usually left to decay for several days. As a result, only nuclides with the half-lives considerably longer than that of 24Na(half-life = 15 h) can be utilized for elemental determination. The short-lived nuclides must have decayed before they can be measured. To determine the nuclides with the half-lives comparable to that of 24Naor with the shorter half-lives, the use of a hot-cell is required, by which handling of the sample immediately after the end of irradiation becomes possible. Third, it is necessary to take into account the potential interfering reactions (e.g., 99Mo, I4OLa from 2"U (n,f) y 9 M ~'40Ba-'40La), , which may lead to serious analytical errors. Thus, the application of radiochemical separation to water samples is not so attractive as the application to biological samples or other solid samples. The articles relating to radiochemical separation, which has been applied to irradiated water samples to collect radionuclides of interest and to remove 24Na and other interfering nuclides are summarized in Table 8.
400
Activation Analysis
TABLE 8 Radiochemical Separations Applied to Irradiated Water Samples Method
Nuclides of interest
Ion exchange HAP (Hydrated antimony pentoxide) HMD (Hydrated manganese dioxide) AAO (Acid aluminum oxide) AAO + HAP
113 22 114 115
Reeve Angel SB-2 Dowex-1x8 Bio-Rad AG- 1 x 2 Dowex-2x8 Isotope exchange 12/CCI, Br, Solvent extraction APDCIMIBK" 2-HMBTb/CHC13 Lubricating base oilc Distillation Coprecipitation a-Benzoin oxime Electrolysis Mercury cathode
116 117 118 119
+
" "
Ref.
120 10 121 122 123, 124 71 125
Methylisobuthylketone. 2-Mercaptobenzothiazole. Byproduct of petroleum.
REFERENCES 1. Batley, G. E. and Gardner, D., Sampling and storage of natural waters for trace metal analysis, Water Res., 11, 745, 1977. 2. Laxen, D. P. H. and Chandler, I. M., Comparison of filtration techniques for size distribution in freshwaters, Anal. Chem., 54, 1350, 1982. 3. Kim, J. I., Stark, H., and Fiedler, I., A method of long-time-irradiation of a voluminous liquid sample in a reactor neutron flux for activation analysis of water, Nucl. Instrum. Methods, 177, 557, 1980. 4. Clemente, G. F. and Mastinu, G. G., Instrumental method for the determination of trace elements in water samples by neutron activation analysis, J. Radioanal. Chem., 20, 707, 1974. 5. Benes, P. and Steinnes, E., In situ dialysis for the determination of the state of trace elements in natural waters, Water Res., 8, 947, 1974. 6. Benes, P. and Steinnes, E., Migration forms of trace elements in natural fresh waters and the effect of the water storage, Water Res., 9, 741, 1975. 7. Salhu, B., Steinnes, E., and Pappas, A. C., Multielement neutron activation analysis of fresh water using Ge(Li) gamma spectrometry, Anal. Chem., 47, 1011, 1975. 8. Benes, P., Gjessing, E. T., and Steinnes E., Interactions between humus and trace elements in fresh water, Water Res., 10, 711, 1976. 9. Uken, E. A., Hahn-Weinheimer, P. and Stark, H., Distribution of selected trace elements in samples of sediment, suspension and water taken along the Ism river, Bavaria, J. Radioanal. Chem., 37,741, 1977. 10. Luten, J.B., The determination of some trace elements in rainwater by neutron activation analysis, J. Radioanal. Chem., 37, 897, 1977. I I. Kusaka, Y., Tsuji, H., Fujimoto, Y., Ishida, K., Fukui, Y., Mamuro, T., Matsunami, T., Miohata, A., and Hirai, S., Multielement analysis of groundwater samples by neutron activation with comparison between direct and evaporation methods, J. Radioanal. Chem., 71, 7, 1982.
Volume 11
401
12. Kim, J. I., Lux, D., and Fiedler, I., Multielement trace analysis for inorganic species in large volume water samples by mono-standard neutron-activation analysis. Mikrochim. Acta, 1, 137, 1982. 13. Salbu, B., Bjornstad, H. E., Lindstrom, N. S., Brevik, E. M., Rambaek, J. P., Englund, J. O., Meyer, K. F., Hovind, H., Paus, P. E., Enger, B., and Bjerkelund, E., Particle discrimination effects in the determination of trace metals in natural fresh waters, Anal. Chim. Acta, 167, 161, 1985. 14. Naeem, A., Multielemental determination in water by neutron activation analysis, J . Radioanal. Nucl. Chem., Articles, 100, 269, 1986. 15. Michaelis, W., Multielement analysis of environmental samples by total-reflection X-ray fluorescence spectrometry, neutron activation analysis, and inductively coupled plasma optical emission spectroscopy, Z. Anal. Chem., 324, 662, 1986. 16. Suzuki, S. and Hirai, S., Behavior of trace elements in the Tama river, Nippon Kagaku Kaishi, 1987, 1678. 17. Landsberger, S., Vermette, S. J., and Drake, J, J., Sulfur, halogens, and heavy metals in urban summer rainfall, in ACS Symposium Series No. 349, The Chemistry ofAcid Rain: Sources and Atmospheric Processes, Johnson, R. W. and Gordon, G. E., Eds., American Chemical Society, Washington, D.C., 1987, 213. 18. Naeem, A., Multielement determination in water by instrumental neutron activation analysis, J. Radioanal. Nucl. Chem., Lett., 118, 79, 1987. 19. Harrison, S. H., LaFleur, P.D., and Zoller, W. H., Evaluation of lyophilization for the preconcentration of natural water samples prior to neutron activation analysis, Anal. Chem., 47, 1685, 1975. 20. Hamilton, E. P. and Chatt, A., Determination of trace elements in atmospheric wet precipitation by instrumental neutron activation analysis, J. Radioanal. Chem., 71, 29, 1982. 21. Kharkar, D. P., Turekian, K. K., and Bertine, K. K., Stream supply of dissolved Ag, Mo, Sb, Se, Cr, Co, Rb, and Cs to the oceans, Geochim. Cosmochim. Acta, 32, 285, 1968. 22. Habib, S. and Minski, M. J., Neutron activation techniques for the analysis of the soluble and particulate fractions of river water, J . Radioanal. Chem., 63, 379, 1981. 23. Mamuro, T., Matsuda, Y., Mizohata, A., Takeuchi, T., and Fujita, A., Activation analysis of polluted river water, Radioisotopes, 20, 111, 1971. 24. Draskovic, R., Radosavljevic, R., Tasovac, T. and Zaric, M., Neutron activation analysis of the aquatic environment in the Sava river, in Neutron Activation Techniques in the Life Sciences, IAEA-SM-157156, International Atomic Energy Agency, Vienna, 1972, 287. 25. Bogen, J., Trace elements in precipitation and cloud water in the area of Heidelberg measured by instrumental neutron activation analysis, Atmos. Environ., 8, 835, 1974. 26. Tanizaki, Y. and Nagatsuka, S., The distribution of several trace elements and their chemical behavior in the head-water area of the Tama river, Nippon Kagaku Kaishi, 1974, 2094. 27. Nagatsuka, S., Tanizaki, Y., and Okano, Y., Neutron activation analysis of trace elements in water sample, Radioisotopes. 23, 693, 1974. 28. Merritt, W. F., Variation in trace element concentrations along the length of Ottawa river, Can. J. Earth Sci., 12, 850, 1975. 29. Bunus, F., Dumitrescu, P., and Bulaceanu, R., Analytical determination of microelements in well waters, J . Radioanal. Chem., 27, 77, 1975. 30. Nagatsuka, S. and Tanizaki, Y., Determination of trace elements in Tonegawa river water by neutron activation analysis, Radioisotopes, 25, 375, 1976. 31. Tanizaki, Y. and Nagatsuka, S., The distribution of trace elements in the Ogasawara Islands, Nippon Kagaku Kaishi, 1977, 667. 32. Sherief, M. K., Awadallah, R. M., and Grass, F., Trace elements in water samples from lake Nasserlake Nubia, J. Radioanal. Chem., 60, 267, 1980. 33. Tanizaki, Y. and Nagatsuka, S., The distribution and the origin of trace elements in fresh waters in the Mikurajima Island, Radioisotopes, 30, 486, 1981. 34. Tanizaki, Y., Yamazaki, M., and Nagatsuka, S., The distribution of trace elements in the ground water in the Musashino area, Nippon Kagaku Kaishi, 1982, 768, 35. Tanizaki, Y. and Nagatsuka, S., Distribution and chemical behavior of 21 elements in river water in the Yakushima Island, Bull. Chem. Soc. Jpn., 56, 619, 1983. 36. Tanizaki, Y., Yamazaki, M., and Nagatsuka, S., Physicochemical speciation of trace elements in river water by size fractionation, Bull. Chem. Soc. Jpn., 57, 1545, 1984. 37. Tanizaki, Y., Yamazaki, M., and Nagatsuka, S., Physicochemical speciation of trace elements in river water by means of ultrafiltration, Bull. Chem. Soc. Jpn., 58, 2995, 1985. 38. Piper, D. Z. and Goles, G. G., Determination of trace elements in seawater by neutron activation analysis, Anal. Chim. Acta, 47, 560, 1969. 39. Lieser, K. H. and Neitzert, V., The determination of trace elements in water by non-destructive neutron activation, J. Radioanal. Chem., 31, 397, 1976. 40. Lieser, K. H., Calmano, W., Hews, E., and Neitzert, V..; Neutron activation as a routine method for the determination of trace elements in water, J . Radioanal. Chem., 37, 717, 1977.
402
,
Activation Analysis
41. Schutyser, P., Maenhaut, W., and Dams, R., Instrumental neutron activation analysis of dry atmospheric fall-out and rain water, Anal. Chim. Acta, 100, 75, 1978. 42. Kusaka, Y., Tsuji, H., Imai, S., and Omori, S., Neutron activation analysis of trace elements in seawater, Radioisotopes. 28, 139, 1979. 43. Kusaka, Y., Tsuji, H., Fujimoto, Y., Ishida, K., Mamuro, T., Matsunami, T., Miohata, A., and Hirai, S., Multielement neutron activation analysis of underground water samples, Bull. Inst. Chem. Res., Kyoto Univ., 58, 171, 1980. 44. Ndiokwere, C. L., Determination of trace elements in rain water by neutron activation analysis, Radioisotopes, 31, 583, 1982. 45. Jubeli, Y. M. and Parry, S. J., A new application of neutron activation analysis with "9U to determine uranium in groundwaters, J. Radioanal. Nucl. Chem., Articles, 102, 337, 1986. 46. Van Der Sloot, H. A. and Das, H. A., The determination of mercury in water samples from the environment by neutron activation analysis, Anal. Chim. Acta, 73, 235, 1974. 47. Van Der Sloot, H. A., Massee, R., and Das, H. A., Determination of uranium in sea and surface waters by neutron activation analysis after adsorption on charcoal, J. Radioanal. Chem., 25, 99, 1975. 48. Van Der Sloot, H. A. and Das, H. A., The determination of vanadium in sea and surface waters, J. Radioanal. Chem., 35, 139, 1977. 49. Massee, R., Van Der Sloot, H. A., and Das, H. A., The determination of selenium in water samples from the environment, J. Radioanal. Chem., 35, 157, 1977. 50. Van Der Sloot, H. A., The determination of chromium in water samples by neutron activation analysis after preconcentration on activated carbon, J . Radioanal. Chem., 37, 727, 1977. 51. Van Der Sloot, H. A., Wals, G. D., and Das, H. A., The determination of molybdenum and tungsten in sea and surface water, Anal. Chim. Acta, 90, 193, 1977. 52. Vanderborght, B. M. and Van Grieken, R. E., Enrichment of trace metals in water by adsorption on activated carbon, Anal. Chem., 49, 31 1, 1977. 53. Nagatsuka, S. and Tanizaki, Y., Determination of mercury and copper in water samples by activation analysis using preconcentration on emission spectroscopic carbon powder, Radioisotopes, 27, 379, 1978. 54. Holzbecher, J. and Ryan, D. E., Determination of uranium by thermal and epithermal neutron activation in natural waters and in human urine, Anal. Chim. Acta, 119, 405, 1980. 55. Akaiwa, H., Kawamoto, H., and Ogura, K., Preconcentration of copper (11) and mercury (11) using dithizone and carbon powder followed by neutron activation analysis, Radioisotopes, 30, 535, 1981. 56. Orvini, E. and Gallorini, M., Speciation problems solved with NAA: some actual cases for Hg, V , Cr, As, and Se, J. Radioanal. Chem., 71, 75, 1982. 57. Orvini, E., Gallorini, M., and Speziali, M., Neutron activation analysis applied to speciate trace elements in freshwater, in Trace Element Speciation in Surface Waters and Its Ecological Implications, Leppard, G . G . , Eds., Plenum Press, New York, 1983, 231. 58. Hamilton, T. W., Ellis, J., and Florence, T. M., Determination of gold in natural waters by neutron activation gamma-spectrometry after preconcentration on activated charcoal, Anal. Chim. Acta, 148, 225, 1983. 59. Murthy, R. S. S. and Ryan, D. E., Determination of arsenic, molybdenum, uranium, and vanadium in seawater by neutron activation analysis after preconcentration by colloid flotation, Anal. Chem., 55, 682, 1983. 60. Feng, XI and Ryan, D. E., Ccmbination collectors in adsorption colloid flotation for multielement determination in waters by neutron activation, Anal. Chim. Acta, 162, 47, 1984. 61. Braun, T., Abbas, M. N., Flek, A., and Bakos, L., Reagent-loaded and unloaded polyurethane foam as preconcentration matrix in neutron activation analysis, J. Radioanal. Chem., 67, 359, 1981. 62. Goldberg, E. D., Koide, M., Schmitt, R. A., and Smith, R. H., Rareearth distributions in the marine environment, J. Geophys. Res.. 68, 4209, 1963. 63. Nagatsuka, S., Suzuki, H., and Nakajima, K., Activation analysis of lanthanide elements in natural water, Radioisotopes, 20, 305, 1971. 64. Wals, G. D., Das, H. A., and Van Der Sloot, H. A., The determination of inorganic arsenic in water by thermal neutron activation analysis, J. Radioanal. Chem., 57, 215, 1980. 65. Weiss, H. V. and Fresco, J., Platinum group elements in seawater. I. Palladium, Can. J . Chem., 61, 734, 1983. 66. Elson, C. M., Milley, J., and Chatt, A., Determination of arsenic and antimony in geological materials and natural waters by coprecipitation with selenium and neutron activation-gamma-spectrometry, Anal. Chim. Acta, 142, 269, 1982. 67. Holzbecher, J. and Ryan, D. E., Determination of trace metals by neutron activation after coprecipitation with lead phosphate, J . Radioanal. Chem., 74, 25, 1982. 68. Stiller, M., Mantel, M., and Rapaport, M. S., The determination of trace elements (Co, Cu, and Hg) in the Dead-Sea by neutron activation followed by X-ray spectrometry and magnetic deflection of beta-ray interference, J. Radioanal. Nucl. Chem., Articles, 83, 345, 1984.
Volume 11
403
69. Weiss, H. V., Chew, K., Guttman, M., and Host, A., The determination of cadmium in sea-water by radioactivation, Anal. Chim. Acm, 73, 173, 1974. 70. Fujinaga, T., Kusaka, Y., Koyama, M., Tsuji, H., Mitsuji, T., Imai, S., Okuda, J., Takamatsu, T., and Ozaki, T., Radioactivation analysis of aluminum, vanadium, copper, molybdenum, zinc, and uranium in natural water samples using organic coprecipitants, J. Radioanal. Chem., 13, 301, 1973. 71. Korob, R. O., Cohen, I. M., and Agatiello, 0. E., Tungsten and molybdenum co-precipitation by abenzoinoxime for activation analysis of tungsten. Use of molybdenum as tracer, J. Radioanal. Chem., 34, 329, 1976. 72. Kulathilake, A. I. and Chatt, A., Determination of molybdenum in sea and estuarine water with Pnaphthoin oxime and neutron activation, Anal. Chem., 52, 828, 1980. 73. Blommaert, W., Vandelannoote, R., Van't Dack, L., Gijbels, R., and Van Grieken, R., Relative evaluation of neutron activation, X-ray fluorescence and spark source mass spectrometry for multielement analysis of geothermal waters, J. Radioanal. Chem., 57, 383, 1980. 74. Bern, H. and Ryan, D. E., Determination of uranium in sea water and biological materials by neutron activation after selective preconcentration with 1-(2-pyridy1azo)-2-naphthol, Anal. Chim. Acra, 158, 119, 1984. analysis after preconcentration with 1-(2-pyridy1azo)-2-naphthol,Anal. Chim. Acta, 166, 189, 1984. 76. Gohda, S., Activation analysis of arsenic, copper, and antimony in sea water, Bull. Chem. Soc. Jpn., 45, 1704, 1972. 77. Brits, R. J. N. and Smit, M. C. B., Determination of uranium in natural water by preconcentration on anion-exchange resin and delayed-neutron counting, Anal. Chem.. 49, 67, 1977. 78. Huh, C. A. and Bacon, M. P., Determination of thorium concentration in seawater by neutron activation analysis, Anal. Chem., 57, 2138, 1985. 79. Sava, S., Zikovsky, L., and Boisvert, J., Determination of arsenic, cadmium, and zinc in river water by neutron activation analysis, J. Radioanal. Chem., 57, 23, 1980. 80. Desai, H. H., Padmanabhan, P. K.. and Venkateswarlu, Ch., Use of a carboxylate exchanger in the determination of copper in distilled water by neutron activation analysis, J. Radioanul. Chem.. 31, 525, 1976. 81. Bergerioux, C., Blanc, J. P., and Haerdi, W., Preconcentration of environmental trace elements on organic support for neutron activation and high resolution photon spectrometry, J. Radioanal. Chem., 37, 823, 1977. 82. Zieliski, R. A. and McKown, D. M., Determination of uranium concentration in water by liquid anion exchange-delayed neutron analysis, J . Radioanal. Nucl. Chem., Articles, 84, 207, 1984. 83. Becknell, D. E., Marsh, R. H., and Allie, W., Jr., Use of anion exchange resin-loaded paper in the determination of trace mercury in water by neutron activation analysis, Anal. Chem., 43, 1230, 1971. 84. Nyarku, S. K. and Chatt, A., Removal of sodium and chlorine from seawater prior to neutron activation analysis for trace elements, J. Radioanal. Chem., 71, 129, 1982. 85. Lee, C., Kim, N. B., Lee,I. C., and Cbung, K. S., The use of achelating resin column forpreconcentration of trace elements from sea-water in their determination by neutron-activation analysis, Talanta, 24, 241, 1977. 86. Greenberg, R. R. and Kingston, H. M., Simultaneous determination of twelve trace elements in estuarine and sea water using pre-irradiation chromatography, J . Radioanal. Chem., 71, 147, 1982. 87. Gladney, E. S., Peters, R. J., and Perrin, D. R., Determination of uranium-235luranium-238 ratio in natural waters by chelex-100 ion exchange and neutron activation analysis, Anal. Chem., 55, 976, 1983. 88. Greenberg, R. R. and Kingston, H. M., Trace element analysis of natural water samples by neutron activation analysis with chelating resin, Anal. Chem., 55, 1160, 1983. 89. Akaiwa, H., Kawamoto, H., Ogura, K., and Tanaka, K., Preconcentration of trace chalcophile elements by a zincon-loaded resin and its application to neutron activation analysis, Radioisotopes, 28, 291, 1979. 90. Akaiwa, H., Ion exchange based on complexation using a chelating agent-loaded resin and its application to preconcentration and radioactivation analysis of trace chalcophile elements, J. Radioanal. Nucl. Chem., Articles, 84, 165, 1984. 91. Akaiwa, H., Kawamoto, H., and Nakata, N., Neutron activation analysis of chalcophile elements using a chelating-agent loaded resin as a group separator, J. Radioanal. Chem., 36, 59, 1977. 92. Akaiwa, H., Kawamoto, H., Ogura, K., and Kogure, S., 8-Quinolinol-5-sulfonic acid-loaded resin as a preconcentrating agent in the neutron activation analysis of the chalcophile elements, Radioisotopes, 28, 681, 1979. 93. Akaiwa, H., Kawamoto, H., and Ogura, K., Bathocuproine disulfonic acid-loaded resin as a preconcentrating agent of trace mercury, Radioisotopes. 29, 521, 1980. 94. Murthy, R. S. S. and Ryan, D. E., Preconcentration of copper, cadmium, mercury, and lead from sea and tap water samples on a dithiocarbamatecellulose derivative, Anal. Chim. Acta, 140, 163, 1982.
404
Activation Analysis
95. Kramer, H. J. and Neidhart, B., Determination of trace amounts of dissolved mercury compounds by instrumental neutron activation analysis following a selective preconcentration, J. Radioanal. Chem., 37, 835, 1977. 96. Imai, S., Muroi, M., Hamaguchi, H., and Koyama, M., Preconcentration of trace elements in natural water with cellulose piperazinedithiocarboxylate and determination by neutron activation analysis, Anal. Chem., 55, 1215, 1983. 97. Girardi, F. and Sabbioni, E., Selective removal of radio-sodium from neutron-activated materials by retention on hydrated antimony pentoxide, 3. Radioanal. Chem., 1, 169, 1968. 98. Mok,W. M., Shah, N. K., and Wai, C. M., Extraction of arsenic (111) and arsenic (V) from natural waters for neutron activation analysis, Anal. Chem., 58, 110, 1986. 99. Mok, W. M. and Wai, C. M., Simultaneous extraction of trivalent and pentavalent antimony and arsenic species in natural waters for neutron activation analysis, Anal. Chem., 59, 233, 1987. 100. Kusaka, Y., Tsuji, H., Tamari, Y., Sagawa, T., Ohmori, S., Imai, S., Ozaki, T., Neutron activation analysis of biologically essential trace elements in environmental specimens using pyrrolidinedithiocarbamate extraction, 3. Radioanal. Chem., 37, 917, 1977. 101. Gohda, S., Valence states of arsenic and antimony in sea water, Bull. Chem. Soc. Jpn., 48, 1213, 1975. 102. Yu, J. C. and Wai, C. M., Dithiocarbamate extraction of gallium from natural waters and from biological samples for neutron activation analysis, Anal. Chem., 56, 1689, 1984. 103. Mok, W. M. and Wai, C. M., Preconcentration with dithiocarbamate extraction for determination of molybdenum in seawater by neutron activation analysis, Anal. Chem.. 56, 27, 1984. 104. Lo, J. G. and Yang, J. Y., Preconcentration of inorganic mercury and organic mercury with solvent extraction for neutron activation analysis, J. Radioanal. Nucl. Chem. Lett., 94, 311, 1985. 105. Lo, J. M., Wei, J. C., and Yeh, S. J., Preconcentration of mercury, gold, and copper in seawater with lead diethyldithiocarbamate for neutron activation analysis, Anal. Chem., 49, 1146, 1977. 106. Lo, J. M., Wei, J. C., Yang, M. H., and Yeh, S. J., Preconcentration of mercury with lead diethyldithiocarbamate for neutron activation analysis of biological and environmental samples, 3. Radioanal. Chem., 72, 571, 1982. 107. Yu, J. C., Lo, J. M., and Wai, C. M., Extraction of gold and mercury from sea water with bismuth diethyldithiocarbamate prior to neutron activation-gamma-spectrometry, Anal. Chim. Acta, 154, 307, 1983. 108. Shah, N. K. and Wai, C. M., Extraction of palladium from natural samples with bismuth diethyldithiocarbamate for neutron activation analysis, J. Radioanal. Nucl. Chem. Lett., 94, 129, 1985. 109. Yang, M. H., Chen, P. Y., Tseng, C. L., Yeh, S. J., and Weng, P. S., Determination of trace elements by neutron activation analysis using dinonylnaphthalene sulfonic acid as a preconcentrating agent, 3 . Radioanal. Chem., 37, 801, 1977. 110. Stary, J. and Kratzer, K., Determination of extraction constants of metal diethyldithiocarbamates, Anal. Chim. Acta. 40, 93, 1968. 111. Wytlenhach, A. and Bajo, S., Extractions with metal-dithiocarbamates as reagents, Anal. Chem., 47, 1813, 1975. 112. Shen, L. H., Yeh, S. J., and Lo, J. M., Determination of extraction constants for lead (11). Zinc (11), Thallium (I), and manganese (11) dithiocarbamates by a two-step extraction method, Anal. Chem., 52, 1882, 1980. 113. Ndiokwere, C. L. and Guinn, V. P., Determination of some toxic trace metals in Nigerian river and harbor water samples by neutron activation analysis, J. Radioanal. Chem., 79, 147, 1983. 114. Gladney, E. S. and Owens, J. W., Determination of arsenic, tungsten, and antimony in natural waters by neutron activation and inorganic ion exchange, Anal. Chem., 48, 2220, 1976. 115. Grancini, G., Stievano, M. B., Girardi, F., Guzzi, G., and Pietra, R., The capability of neutron activation for trace element analysis in sea water and sediment samples of the Northern Adriatic Sea, J. Radioanal. Chem., 34, 65, 1976. 116. Kolaczkowski, A. and Jester, W. A., Activation analysis of heavy metals in surface waters using ion exchange filter papers and cyanide complexing, 3 . Radioanal. Chem., 16, 21, 1973. 117. Lenvik, K., Steinnes, E., and Pappas, A. C., The simultaneous determination of As, Cd, Co, Hg, Mo, and Zn in fresh water by neutron activation analysis, Anal. Chim. Acta, 97, 295, 1978. 118. Gladney, E. S., Owens, J. W., and Starrier, J. W., Determination of uranium in natural waters by neutron activation analysis, Anal. Chem., 48, 973, 1976. 119. Luten, J. B., Woittiez, J. R. W., Das, H. A., and De Ligny, C. L., Determination of iodate in rainwater, J. Radioanal. Chem., 43, 175, 1978. 120. Luten, J. B., Das, H. A., and De Ligny, C. L., The determination of bromine and iodine in environmental water samples by thermal neutron activation and isotope exchange, J. Rudimnal. Chem., 35, 147, 1977. 121. Subramanian, S. and Turel, 2. R., Substoichiometric determination of Hg by radiochemical neutron activation analysis, J. Radiounal. Nucl. Chem. Lett., 105, 3 17, 1986. 122. Tseng, C. L., Determination of trace amounts of mercury in water by neutron activation analysis with lubricating base oil as extractant, Radioisotopes, 25, 523, 1976.
Volume 11
405
123. Kosta, L., Ravnik, V., Byrne, A. R., Stirn, J., Dermelj, M., and Stegnar, P., Some trace elements in the waters, marine organisms, and sediments of the Adriatic by neutron activation analysis, J . Radioanal. Chrm., 44, 317, 1978. 124. Jensen, K. 0. and Carlsen, V.. Low level mercury analysis by neutron activation analysis, J . Radioanal. Chem., 47, 121, 1978. 125. Jorstad, K, and Salbu, B., Determination of trace elements in seawater by neutron activation analysis and electrochemical separation, Anal. Chem., 52, 672, 1980
Volume 11
407
Chapter 10
IN VZVO NEUTRON ACTIVATION ANALYSIS
.
Kenneth J Ellis
TABLE OF CONTENTS I.
Introduction ..................................................................... 408
I1.
408 In Vivo Neutron Activation Analysis ............................................ A. Basic Principle ..........................................................408
B.
C.
Neutron Sources ......................................................... 410 Uniformity of Thermal Neutron Flux ............................410 1. 2. Exposure Geometry ..............................................412 3. Radiation Dose .................................................. 412 Detector Systems ........................................................412 Whole-Body Counters ........................................... 412 1. Partial-Body Counters ............................................ 413 2.
111.
Prompt-Gamma Neutron Activation Analysis ................................... 415 A. Basic Equation ..........................................................415 B. Total-Body Nitrogen .................................................... 415 C. Cadmium in Kidney and Liver ..........................................416
IV .
Inelastic Neutron Activation Technique ......................................... 417
v.
Other In Vivo Neutron Activation Techniques ..................................419
VI .
Body Composition Studies and Clinical Applications ...........................419 A. Calcium ................................................................. 419 B. Nitrogen ................................................................. 421 C. Sodium and Chlorine .................................................... 421 D. Carbon .................................................................. 422 E. Cadmium ................................................................ 422 F. Other Elements .......................................................... 422
VII .
Conclusions and Summary ...................................................... 423
Acknowledgments ......................................................................423 References .............................................................................. 424
408
Activation Analysis
I. INTRODUCTION The biological and clinical research applications of neutron activation analysis have generated a renewed interest in the study of the elemental composition of tissue. In particular, the recent development of in vivo neutron activation techniques has resulted in a new era of research investigations focused on the basic clinical uses of these methods. The first controlled experiments in which neutron activation was used for the study of body composition in humans were reported in the mid-1960s by medical physicists.' The apparatus consisted of a whole-body counter which measured the gamma rays emitted from the body after irradiation using a cyclotron-produced neutron beam. These scientists demonstrated that the measurement of the delayed gamma spectra after neutron activation analysis (IVNAA) could be used to determine in vivo the major body elements. The radiation exposures required for the initial IVNAA procedures were already comparable with those associated with many routine diagnostic radiographic techniques. During the next two decades, various centers designed and built IVNAA facilities specifically for use in biomedical and clinical research. Each of these basic designs was usually focused on the measurement of body calcium, an element that enables a direct measure of bone mass because 99% of body calcium normally is located in the skeleton. Scientific workshops specific to the technical aspects of in vivo neutron activation analysis were sponsored in 1972 and 1981 by the International Atomic Energy A g e n ~ y .More ~ . ~ recently an international conference was convened at Brookhaven National Laboratory (U.S.A.) to present "state-of-the-art" neutron activation systems, their clinical applications, and techniques still in the development phase.4 The IVNAA technique provides the investigator with the only direct in vivo method for the multielemental analysis of the living human body. Various other radiation-based techniques (radiography, isotopic imaging, absorptiometry, radiotracer dilution) have been devised for body composition studies, but at best reflect relative changes in tissue density or volume. Isotope dilution techniques have been especially important, but provide information only for the exchangeable fluid compartments of the body. Only IVNAA can provide data on the total body content of the following elements: calcium, sodium, chlorine, phosphorus, nitrogen, hydrogen, and carbon. In addition, partial-body in vivo activation techniques have been developed for specific elements and organs, i.e., the measurement of cadmium in the kidney and liver, mercury in the brain, iron in the liver, iodine in the thyroid, and aluminum in bone. The body elements measured in humans by IVNAA at Brookhaven National Laboratory, as given in Table 1 , are typical of measurements made at most research centers. Although other reactions also can occur in the living body after neutron exposure, the accuracy of such measurements restricts any useful biological or clinical applications at the present time. The IVNAA technique provides an elemental profile of body composition that is independent of the molecular or chemical structure of the tissue. The remaining sections of this chapter provide the basic concepts of in vivo neutron activation and identify the various areas of clinical or biomedical application.
11. IN VZVO NEUTRON ACTIVATION ANALYSIS (IVNAA) A. BASIC PRINCIPLE The following equation relates the delayed component of the induced activity in the body to the physical and experimental parameters that describe the neutron activation procedure: Counts
=
constant x M x e l x e2 x flux
X
exp
X
delay x counting
(1)
Volume 11
409
TABLE 1 Typical Body Elements Measured by In Vivo Nuclear Techniques
Body element
Standard (g)'
Man
(%Ib
Total body Oxygen Hydrogen Nitrogen . Calcium Phosphorus Potassium Sodium Chlorine Partial body Cadmiumc.' Mercury' Silicong Leadh Lithiumf Aluminumh
"
Measurement technique used at Brookhaven
HTO Dilution (p counting) Prompt y (2.2 MeV) Prompt y (10.8 MeV) Delayed y (3.10 MeV) Delayed y (1.78 MeV) Natural (I .46 MeV) Delayed y (2.75 MeV) Delayed y (2.2 MeV) 4.2 Trace Trace Trace Trace Trace Trace
0.006 Trace Trace Trace Trace Trace Trace
NRS n,y ",y n,nfy XRF
Prompt y (0.846 MeV) Prompt y (0.559 MeV) Prompt y (0.368 MeV) Prompt y (1.78 MeV) Prompt X-rays Delayed (T counting) Delayed y (1.78 MeV)
Amounts used for ICRP 23 p ~ b l i c a t i o n . ~ ~ Proportion of total weight for 70-kg man. Liver. Heart. Kidney. Brain. Lung. Bone.
The constant term is defined as Contant
=
[S x N x f l x f2]/(A x k l )
where the following physical parameters are used: S = reaction cross-section, N = Avogadro's number, A = atomic number, f l = isotopic abundance, f2 = gamma decay ratio, k l = ln(2)/t,,,, t,,, = half-life. Two of the experimental parameters that are determined by the design of the counting and activation facilities are e l = energy efficiency (detector volume), e2 = geometry efficiency (number of detectors), flux = neutron flux intensity (n/cm2-s). The total time of activation (Ta), delay time between the end of activation and the start of counting (Td), and the total counting time (Tc) are contained in the remaining terms of Equation I: exp = (1 - exp{kl x Td}); delay = (l/(exp{kl x Td}); counting = (1 exp{ - k l x Tc}) . The values for the cross-section, atomic number, half-life, isotopic abundance, gamma decay ratio, and Avogadro's number are inherent constants of nature. The mass of the target element is denoted by M in Equation 1. For each facility, the sensitivity and accuracy of the IVNAA procedure is strongly influenced by the exposure time which is governed by dose and the counting time. The major contributing factors to each of the parameters is the detection efficiency of the counter system and the source of neutrons. The geometry of the counter (number and position of the detectors) determines the absolute counting efficiency. The most sensitive whole body
410
Activation Analysis
counter has an absolute efficiency of 1 to 2%. The intensity and uniformity of the neutron flux is highly dependent on the method of production and contributes to the reproducibility of the measurement and defines the optimum activation times to be used. The design of IVNAA systems is usually influenced by the available source of neutrons and the gamma counting system. Thus, it has been necessary for each laboratory to establish independent calibration factors (CF). Separate calibrations usually are obtained experimentally for each element by performing the IVNAA procedure first using human-shaped phantoms with known amounts of the various elements in the phantom. These calibration factors are obtained from the basic activation equation given in Equation 1 in which the mass (M), the exposure time (Ta), delay time (Td), and the counting time (Tc) are fixed values. If the net counts in the photopeak generated by these conditions is C, then Equation 1 can be rewritten to give a calibration factor for each element:
where each of the terms in Equation 1 that contains the physical constants, the values for the counter geometry and efficiency, and the exposure, delay, and counting terms are combined in Equation 2 in the value of K. If the phantom used for calibration is an appropriate model of the subjects to be measured, one can obtain an accurate or "absolute" calibration. Once the calibration factors have been established for each element, the counts in the subject can be compared with the data for the phantom and the mass of the element in the subject obtained as follows:
Although this calibration procedure is common for IVNAA, each laboratory must obtain its own set of calibration factors, because they are a direct result of the design of the activation and counting systems. Whenever possible, a direct cross-calibration between the phantom and human cadaver measurements is re~ommended.~
B. NEUTRON SOURCES The selection of a neutron source for use in IVNAA is based, in part, on the elements to be measured, the required degree of uniformity of activation, the acceptable level of accuracy, and the allowable radiation dose. The types of neutron sources used for IVNAA have included accelerators, reactors, spontaneous fission sources, and radioactive sources. The basic characteristics of these sources are given in Table 2. Although the use of the (n,y) thermal neutron reaction has been predominant in IVNAA, higher energy neutrons are needed to penetrate to the deeper tissues in the body. The (n,2n) and ( n , ~ fast ) neutron reactions also have been used, but to a lesser extent, because the "portable" radioactive and fission sources do not have a sufficient intensity above 6 MeV. For the measurement of most elements, therefore, the investigator must weigh the advantages of a higher thermal flux density per unit dose, obtained with the radioactive sources, against their decreased thermal flux uniformity in the body and the loss of the fast neutron reactions.
1. Uniformity of Thermal Neutron Flux When the body is irradiated from one direction, the neutron flux density is not uniform with depth. The lack of uniformity is a major concern for activation procedures in which an "absolute" calibration is needed. The early investigations of Smith and Boot6 showed that a single exposure from one side of the body, independent of the neutron energy, could not produce a uniform thermal neutron flux throughout the body. Improved uniformity, however, was achieved by using a bilateral irradiation of the body combined with surrounding
TABLE 2 Characteristics of Five Types of Neutron Sources Used for In Vivo Neutron Activation Analysis of Man ='Cf
Characteristics Energy (MeV) Activity (Bq) Neutron output (ns-I) Source to skin distance (cm) Incident neutron flux density in body (neutrons/crn2 s) Irradiation time (min) Applications
Advantages
Disadvantges
Up to 10 Mean 3.9-4.6 3.7 X 10"-2.6 2.0 x lo7-1.1 2-50
X 10" x 109
2-30 Hand, torso, whole body Ca, Na, CI, P(D) Liver, kidney Cd(P) Total, partial body N(P) Reliable, constant output, long half-life, portable Continuously active, regulatory difficulties in transport may be encountered
Neutron generator
Up to 6 Mean 2.1 2.5-14 1.9 x 10l2-7.4 x 10l2 2.2 x loY-1.8 x 10" Up to 3 X 10" 6-60
10-30 Hand, forearm, spine Ca(D) Liver, kidney Cd(P) Total and partial N, Ca(p) Reliable, constant output, portable, very small source 2.6-years half-life continuously active
Cyclotron Up to 8-12 Mean 2.5-7.6 X
1010-1012
0.33-3 Total and partial body Ca, Na, CI, P(D) Some partial body (P)
Beam on only when required; good energy for thick sections More maintenance required than for radionuclide sources Cost of replacement tubes adds to expense
High output, may provide variable energy
From Cohn, S. H. and Parr, R. M., Eds., Clin. Phys. Physiol. Meas., 6, 1985, 275. With permission.
Thermal to 15 Mean 1.7
1.4
0.17-5 Mostly total body N, Ca, Na, C1, P(D)
Note: (D), delayed gamma reactions; (P), prompt gamma reactions.
Reactor
High cost, not justified for IVNAA alone Less reliable than radionuclide sources Need to monitor fluence rate
Partial body Ca, I (D)
May have high y-ray background. Energy may be too low for whole body IVNAA; major installation costs not justified for IVNAA alone
412
Activation Analysis
the subject with a few cm of polyethylene to serve as a partial moderator of the neutrons. Cohn et al.' reported their theoretical considerations in the selection of neutron sources for total body neutron activation analysis; their findings favored Pu,Be sources as the best choice. More recently, Morgan et a1.8 re-evaluated different neutron sources on the basis of sensitivity per unit dose and concluded that 252Cfprovided an advantage for IVNAA in normal-sized subjects.
2. Exposure Geometry The initial facilities developed for IVNAA were located in laboratories involved primarily in basic physics research.' The first neutron beams were cyclotron-produced with outputs Other laboratories of approximately loL2n/s and peak neutron energies of 3.5 and 8 soon developed IVNAA systems that used 14-MeV neutrons from D,T neutron generators.'' The first IVNAA facility designed exclusively for human clinical applications was built at Brookhaven National Laboratory in the early 1970s and uses 700 curies of activity consisting of 14 238Pu,Beneutron ~ o u r c e s . ' ~In . ' ~each of these facilities, the subject is exposed initially to a fast neutron beam with source-to-skin distances (SSD) that range from 0.7 to 3.7 m. The incident neutron flux density at the surface of the body varied from 1 x lo3 to 5 x lo5 n/cm2-s. The premoderator thickness varied from 0 to 4 cm. A bilateral irradiation was used to improve the thermal flux density in the body. When possible, the exposure procedure uses a simultaneous bilateral irradiation of the subject resting in a supine position. The exposure geometry used at Brookhaven for total body neutron activation is shown in Figure 1. The subject is placed within a polyethylene premoderator while two arrays of seven sources each are mechanically positioned above and below the subject's midline for a 5min exposure. l3.I4
3. Radiation Dose The absorbed dose to the subject usually has been measured using tissue-equivalent ionization chambers. The dose is often less than, or comparable to, many routine diagnostic radiographic procedures. The range of exposures for existing facilities depend, in part, on the elements being analyzed, the precision required, and the detection sensitivity of the counting system. The absorbed dose is dominated by the neutron exposure, but also includes a small gamma contribution (
Volume 11
413
FIGURE 1. A schematic of the Brookhaven neutron irradiator designed exclusively for IVNAA. Fourteen 50-Ci 23Tu,Be sources are mechanically positioned above and below the subject who is surrounded with a 2-cm polyethylene premoderator. ''
If the counting system is designed to scan the body, the speed of the scan must be variable and synchronized to the half-life of the element being measured. Therefore, the speed must be reduced during the scan to correct for the decay of the signal and achieve a uniform sampling of each portion of the body. For the short-lived elements, such as calcium and phosphorus, the body scan must be adjusted at an exponential rate to compensate for the reduced signal late in the scan.I5 It is important to note that the scanning speed used for calcium would be different from that used for phosphorus. Thus, the system may not be optimized for all elements. A comparison of the induced IVNAA gamma spectra for the Brookhaven whole-body counter after activation using the D,T neutron generator and the 700-Ci PuBe activation facilities is shown in Figure 3. The "nitrogen" and "phosphorus" peaks are reduced significantly for the lower energy source. A fourfold improvement in the spectra data was achieved for the same dose when the newer whole-body counter (thirty two 10 cm X 10 cm x 46 cm NaI(T1) detectors) was placed in operation in 1987.16
2. Partial-Body Counters IVNAA techniques based on partial-body measurements usually have focused on specific anatomical regions of the body. The in vivo measurement of iodine in the thyroid, for example, was one of the first applications of partial-body IVNAA.17 Such measurements also have been applied to calcium, phosphorus, and sodium in specific regions (hand, spine) of the body. '8.'9.20 Ellis and Kelleher combined partial-body and total-body IVNAA tech-
414
Activation Analysis
1 1
2 3 4 5 6 7 8 9 1011 1 2 1 3 1 4 1 5 1 6 ROWS OF DETECTORS
FIGURE 2. A schematic showing the design of the Brookhaven adult wholebody counter (upper figure) and a top view showing how the thirty-two 10 cm x 10 cm x 46 cm NaI(T1) detectors cover the area of the body.16
niques to measure skeletal al~rninum.~' To date, McNeill and c o - ~ o r k e r have s ~ ~ developed the most advanced partial-body activation facility for the specific measurement of truncal or torso calcium. Their approach represents a unique compromise between the activation of the total skeleton and the partial-body measurements of the appendicular skeleton. Although a number of partial-body activation facilities have been established, the achievement of an acceptable absolute calibration, which is independent of the subject's size, is a formidable task. Comparison of the results obtained by partial-body activation between individuals of different sizes can lead to misinterpretation of the findings if size variations are not considered. The partial-body techniques may be best suited for longitudinal studies in the same individuals where marked differences in body shape would be less likely to occur.
Volume I1
.51 MeV) 3 8 I~ (1.64 M ~ V )
k
-
(2.16 MeV)
A
415
14 MeV NEUTRONS Pu, Be NEUTRONS ( - 5
24~a (2.76 MeV) 49c,
2 1 1 ' 1 1 2' lb~ ; " d d l l d " Q d " ' i ~ " ' d d l l d d l ' ~ ~ ~ " l l ~ ~ ' l ~ ~ o CHANNELS ( 3 3 keV/CHANNEL)
FIGURE 3 . Comparison of two IVNAA whole body counter spectra following neutron activation using a 2'HpU,Besource (5 MeV) and a D,T generator (14 MeV).14
111. PROMPT-GAMMA NEUTRON ACTIVATION ANALYSIS A. BASIC EQUATION When a nucleus captures a neutron, it is transformed into an excited state. This nucleus promptly returns to its lowest nuclear state either by the emission of nucleons or gamma rays. Although radiative capture can occur at all neutron energies, the probability increases at lower energies. The major difference between the IVNAA techniques described above (based on the delayed component of the induced activity) and those of prompt-gamma neutron activation analysis (PGNAA) is that the induced gamma signal in the latter procedure must be measured simultaneously with the neutron exposure. The equation that describes the PGNAA technique is less complex than that required for the delayed gamma spectra. The time-dependent terms in Equation 1 are eliminated and the total counts are directly proportional to the activation time (Ta) and flux. The basic equation that describes the PGNAA technique is as follows: Counts
=
{[S x N x f l x f2 x e l x e2]/A} x M x flux x Ta
(4)
where the physical constants are the same as those defined in Equation 1. For a given mass (M), the induced gamma signal is directly proportional to the intensity of the neutron flux and the total exposure time. The first demonstration of the PGNAA technique for in vivo application was in the mid1960s by Rundo and Bunce who reported on the measurement of body hydrogen.23 The medical physics group at the University of Birmingham extended this work and reported the feasibility of using a pulsed cyclotron beam for the in vivo measurement of nitrogen.24 Other centers soon followed, reporting on the use of radioactive sources for these measurements. 25-28
B. TOTAL-BODY NITROGEN The feasibility of measuring total-body nitrogen was first demonstrated using the cyclotron-produced fast-neutron reaction, 14N(n,2n) 3N.The general usefulness of this approach
416
Activation Analysis
for the measurement of body nitrogen was limited, however, by two significant factors. First, the nitrogen cross-section for the (n,2n) reaction has a high energy threshold, thus a neutron generator or particle beam accelerator is needed. Second, the induced product, I3N, is a positron emitter which gives only the characteristic 51 1-keV annihilation photons, not a unique signal for nitrogen. In addition, a fast-neutron reaction on body oxygen also produces 13N.This interference is highly variable and its contribution to the nitrogen peak may be as high as 17%. Even when these difficulties are considered, there remains the nonuniformity of the fast neutron fluence in the body. Each of these restrictions has been investigated extensively by the group at the University of Leeds in their continued efforts to use the (n,2n) reaction for measurements of body nitrogen.29 The PGNAA technique, however, offers an immediate solution to several of the difficulties associated with the (n,2n) reaction. The requirement of a high energy neutron source is surmounted and at the same time a gamma-ray signal is produced that is uniquely identified with nitrogen. Although the thermal neutron cross-section for radiative capture on nitrogen is small (80 mb), it is countered by the large mass of nitrogen in the body (approximately ) approximately 15% of the I5N de2.5% of body weight). In the reaction I4N ( n , ~ 15N, excitations occur through a direct transition from the highest excited level of 15N to its ground state. This process produces the immediate emission of a 10.83-MeV gamma ray. Gamma-ray energies above 4 MeV are not present routinely in the background and no other element normally in the body produces a gamma above 9 MeV. Thus, the prompt gamma spectra above 9 MeV can be identified uniquely with body nitrogen. One major difficulty with the PGNAA technique, however, is the "pileup" or interference signal generated in the detectors when multiple pulses arrive within the time resolution of the electronics. The major cause of the pileup events is the interaction of neutrons within the large volume of the NaI crystals and to the high intensity of the external gamma signal generated in the shielding materials. Vartsky originally attempted to overcome these problems by proposing a "fractional charge collection" configuration for the electronic^.^^ This approach has now been abandoned and replaced with standard electronic components designed for high count rates. Vartsky's investigations resulted in a more important improvement in the technique. They provided a solution to the more difficult problem of nonuniformity of the thermal neutron flux in the body. He proposed that the hydrogen signal at 2.2 MeV in the prompt spectra be used as an "internal normali~ation".~~ This approach is based on the assumption that hydrogen distribution per unit volume in the body is uniform and, thus, the prompt gamma signal can provide a measure of the thermal flux distribution in the body. The determination of body nitrogen then is based on the ratio of the nitrogen to hydrogen counts observed in the subject as compared with counts from a phantom with known amounts of nitrogen and hydrogen. The basic technique is illustrated in Figure 4. A collimated beam of fast neutrons penetrates the body and produces thermal neutrons that interact with the nitrogen and hydrogen. Two NaI detectors are positioned either at the side of the body (90" geometry) or above the body on the side opposite the neutron source (180" geometry). The PGNAA technique has gained wide acceptance for the measurement of body nitrogen and clinical facilities have been developed in a number of medical center^.^^-^^ The accuracy and precision for the measurement of body nitrogen have ranged from 3 to 6% using scanning times of 15 to 30 min at total body doses below 0.5 mSv (50 mrem). C. CADMIUM IN KIDNEY AND LIVER The measurement of cadmium represents the first in vivo application of neutron activation analysis to the study of a toxic metal. Although only trace amounts of cadmium are normally present in the body, its in vivo detection is due, in part, to the large radiative neutron-capture
Volume 11
417
Na I ( T I ) DETECTORS
FIGURE 4. A schematic of the Brookhaven prompt-gamma activation facility designed for in vivo nitrogen measurements. The lower figure shows the relative position of the two NaI(T1) detectors above the scanning bed and just out of the collimated neutron beam.25
cross-section of '13Cd, one of the stable isotopes of cadmium. Although a cascade of gamma rays are emitted by cadmium after neutron capture, the 559-keV gamma is best suited for this application. High resolution Ge detectors are needed to isolate this gamma ray energy from other peaks in the same region. A cross-sectional view of a typical in vivo measurement facility using two Ge detectors and a collimated 252Cfsource is shown in Figure 5. This system was developed at Brookhaven specifically for the measurement of cadmium in the left kidney and liver.31The detection system consisted of two 24% efficient Ge(Li) detectors (2.2-keV energy resolution), and a 100-kg 252Cfsource housed in a polyethylene shield. The source is approximately 50 cm below the subject; an iron collimator in the shield provides a circular beam area of 700 cmZ at the level of the bed. The cadmium detection limits (2 SD of the background) are 2.2 mg for the kidney and 1.5 ppm for the liver for a skin dose of 150 mrem (1.5 mSv) delivered in 1500 s. Similar systems have been developed in Wales, the U.K., and A ~ s t r a l i a . ~ ' - ~ ~
IV. INELASTIC NEUTRON ACTIVATION TECHNIQUE Several centers have investigated inelastic neutron interactions that occur when the body is irradiated with fast neutron^.^^.^^ The major interaction of interest for in vivo applications has been that from body carbon. The reaction 14C (n,nly) 14C produces a prompt 4.4-MeV gamma signal that can be detected external to the body. Because this reaction has a neutron energy threshold near 4.8 MeV, it cannot be initiated readily using isotopic neutron sources.
418
Activation Analysis
-
lOcm
POLYETHYLENE (Pb,B Doped)
Ge( Li
DETECTORS
252cf SOURCE
FIGURE 5 . Partial body prompt-gamma facility designed for the in vivo measurement of cadmium in the liver and kidney. A 100-kg * T f source is housed inside the biological shield (certified shipping container) and two HpGe detectors are located at 90" to the beam. An iron insert above the source provides collimation at the level of the bed. Additional polyethylene, lead, and lithium shielding reduces the background count rate in the detectors."
These facilities, therefore, have used 14-MeV neutrons produced by D,T neutron generators operating in a pulsed mode. The geometry of activation and detection is similar to that used for the prompt-gamma neutron activation measurements of body nitrogen as described in Section 111. In the basic design of the facility used at Brookhaven, the shielded neutron generator is positioned approximately 50 cm beneath the bed, which is scanned across the collimated opening. The shielding and collimator materials for the D,T generator must be constructed of low-carbon iron to minimize the background signal from carbon that would be detected if normal neutron shielding materials, such as polyethylene, were used. The bed is scanned at the same speed as that used for the PGNAA measurement of body nitrogen. For this application, the NaI(T1) detectors are positioned at the side of the bed at 90" to the neutron beam. The neutron generator operates in a pulsed mode at 10 kHz with a fixed 15-ps pulse width. The generator is operated at a flux intensity of approximately lo3 neutrons per pulse. The pulsing circuit of the neutron generator also provides an external trigger pulse used to gate the detectors which are on only during the neutron burst. This 15-ps time period is used for the measurement of body carbon. A second gate is delayed until 30 to 50 ps after the neutron pulse
Volume 11
419
to detect prompt-gamma events that occur during thermalization of the fast neutron beam in the body. The neutron dose for the measurement of carbon has been estimated at less than 0.16 mSv (16 ~nrem).~'
V. OTHER IN VZVO NEUTRON ACTIVATION TECHNIQUES The activation techniques described in the previous sections have been developed for use in clinical research studies and for the investigation of basic human physiology. Each of these systems has been used to detect the gamma signals emitted external to the body. Alternate techniques have been investigated, however, that exploit other induced activity which results from the activation procedure. Two of these techniques are based on the detection of radioactive gases in the breath of the irradiated subject. The first, the reaction 40Ca(n,a) "Ar has been investigated for the measurement of total body calcium in ~ i v o . ~ ' In this procedure, the exhaled breath of a subject must be collected for several hours after exposure and then processed to isolate the argon gas. The small amount of gas is counted for several days using small volume, low-background proportional detectors. The physics of the technique are well understood and offer the advantage of a much smaller neutron dose than that of other techniques used to measure calcium. However, there remain unresolved difficulties related to the kinetics of the induced 37Ar,a noble gas, that need further investigation before this technique can be considered for clinical a p p l i ~ a t i o n . ~ ~ The second application based on the collection of exhaled breath after neutron imadiation has focused on the in vivo measurement of brain lithium (Li).3" This technique evolved because of clinical interest and need to monitor patients placed on Li therapy. The various components of the gas collection and separation technique are illustrated in Figure 6. Tritium (T) is produced when neutrons are captured by 6Li nuclei present in the tissues being irradiated. A small fraction (10%) of the induced T combines with hydrogen to form HT gas which is present in the subject's exhaled breath. The breath must be collected, the HT fraction separated, and the T counted using low-background proportional counters. The accuracy of this technique for the in vivo measurement of brain Li levels has been demonstrated in different animal models.40No studies in humans, however, have been performed.
VI. BODY COMPOSITION STUDIES AND CLINICAL
APPLICATIONS The clinical usefulness of the in vivo neutron activation techniques are best demonstrated by the studies that involve the measurements of body calcium, nitrogen, and cadmium. The calcium data have proven valuable in the study of various metabolic disorders, in the diagnosis of the patient's condition, in monitoring changes that may occur during treatment, and in the identification of individuals at increased risk of bone fractures. Quantification of the metabolic changes in body protein (nitrogen) that occur in the treatment of obesity, anorexia, cancer, and renal failure has been clearly demonstrated. The in vivo monitoring of cadmium in industrial workers has helped establish acceptable inhalation exposure standards.
A. CALCIUM The initial application that has most influenced the development of IVNAA is the measurement of body calcium in patients with various metabolic diseases. Because the calcium in the body normally is located in the skeleton (99% of total body calcium) a measure of this element clearly would provide a direct examination of the total skeletal mass. Baseline data on calcium for normal subjects without disease also would be reauired to o h t a & , a j ~ , meaningful interpretation of the changes observed in the patients ad'% have an interindi"3 vidual comparison of different sizes and ages.41It was possible to *sin baseline data for
.
TO Hg DlFF
PUMF
DRY ICE-ALCOHOL DRYER
Mg(C104); DRYER
I SODA LIME
&FROM
AIR TANK
FIGURE 6. A schematic of the gas collection and separation system used for breath hydrogen analysis. The exhaled air is collected during neutron irradiation and for up to 20 min after exposure. The air is first dried, then hydrogen gas is converted to water on the Pd sponge, and stored at the dry ice/alcohol trap. After gas collection is complete, this trap is warmed to release the tritiated water which is converted back to gas by the V heater. Only hydrogen gas passes the Pd thimble where it is compressed using the toepler pump and transferred to the proportional counter for counting of tritium.40
Volume 11
421
the general population because of the sensitivity of the in vivo measurement technique (error < -t 1 to 2%) and low radiation dose required for TBNAA. These data were examined relative to the parameters of body size, age, sex, and race to establish "normal" values. The data obtained by TBNAA are now recognized as the "gold standard" for the measurement of total skeletal mass.42 Clinical research studies have investigated a number of metabolic disorders in which there is a primary or secondary alteration of mineral metabolism: osteoporosis (postmenopausal, osteogenesis imperfects, drug-induced, aging), osteomalacia (vitamin D deficiency, anticonvulsant drugs, rickets), renal osteodystrophy, Paget disease, Cushing syndrome, acromegaly, thyroid and parathyroid disorders, myotonic dystrophy, thalassemia, and alcoholic cirrhosis. The more recent applications have been discussed by Cohn, and by Chettle and Fremlin .43+'
B. NITROGEN The in vivo measurement of body nitrogen provides a direct determination of body protein which is the essential component of the body's lean tissue mass. As was the case for the calcium measurements, a baseline reference value for the expected size of this component is essential for any useful clinical investigations. When the measured value is compared with the expected or predicted "normal" value, it is then possible to establish the degree of wasting in the individual patient.45 The relationship of body nitrogen to various indirect estimates of the lean body mass is now being investigated. There have been acceptable correlations for the normal population, although the standard errors of the prediction equations have been too large for the indirect techniques to be used as accurate indices of the lean tissue mass for the individual. The standard error of the estimate becomes even larger when data for patient populations are examined, which suggests that the indirect measurement techniques are influenced by more than changes in the mass of the lean tissues. Further investigation is needed to interpret more fully the data obtained by the indirect methods. Because changes in protein mass can reflect changes in nutritional status, it is not surprising that most of the clinical studies involving nitrogen measurements have involved patients with progressive diseases that may alter the lean tissue mass. Clinical studies that have included the body nitrogen measurement as part of the research protocol have involved the following types of patients: postoperative surgery, protein malnutrition, cancer, renal failure, cardiovascular disease, total parenteral nutrition, and obesity. The dose associated with the nitrogen measurement is sufficiently low (less than many diagnostic radiographic procedures) that it has been used in clinical studies involving children.46
C. SODIUM AND CHLORINE To date, the in vivo measurements of sodium and chlorine have not been applied to the same extent as those of body nitrogen and calcium. The sodium and chlorine values are obtained routinely as part of the analysis of the gamma spectra for the measurement of body calcium. These data are usually of only secondary interest in the clinical protocol where the major focus is on calcium. The direct in vivo measurements of body sodium and chlorine, however, can be used to obtain accurate estimates of the intra- and extracellular compartments of body water.47 These data provide an electrolyte profile of the fluid compartments of the body when combined with the measurement of 40K obtained by whole body counting. The total-body neutron activation technique (TBNAA) can replace the more traditional radiotracer dilution techniques for the measurement of body water distribution^.^^ Future applications of TBNAA are expected to include studies that will exploit the available sodium and chlorine data.
422
Activation Analysis
D. CARBON The inelastic neutron scattering technique for the measurement of body carbon has been developed only recently and further investigations are needed to evaluate its full potential for use in body composition studies. Prospectively, however, the technique is attractive. When body carbon measurements are combined with those of body nitrogen, the result should be an accurate index of the fat and lean tissue compartments of the body.36 Body oxygen also generates a gamma ray that can be detected external to the body at the same time the carbon measurement is performed. This information may prove useful for monitoring total body water. Thus in a single measurement, it may be possible to determine body levels of oxygen (water), hydrogen (water, fat), nitrogen (protein), and carbon (fat). Studies currently in progress will examine the relationship between changes in total body carbon and energy expenditure. Longitudinal measurements of body carbon may provide a direct technique for monitoring total energy expenditure in the i n d i ~ i d u a l . ~ ~
E. CADMIUM The major application of the in vivo measurement of cadmium in humans has been to establish dose response relationships in industrial worker~.~O.~l The kidney is known to concentrate cadmium and has been identified as the initial 'target' organ for toxicologic studies. If the renal cortex concentration of cadmium exceeds a 'critical' limit, the kidney is assumed to be permanently damaged. The in vivo measurement of kidney cadmium in humans, therefore, offers the only direct method (except for hdney biopsy) to monitor exposed individuals before the critical limit is reached. Estimates of the critical concentration of cadmium in the kidney, the biological halflife of cadmium in the kidney and in the liver, rates of transfer between the liver and the kidney, inhalation exposure estimates, and relationships to other indirect biological monitoring methods (blood, urine, and hair) have been examined.52The in vivo technique also has been used to examine the kidney burden in smokers and nonsmokers in the general p ~ p u l a t i o n The . ~ ~ sensitive in vivo systems offer the opportunity to screen subjects in the general population whose environmental exposures may be suspected excessive, i.e., those who live near a former chemical waste dump site, artists who use metal-based pigments, or those who accidentally inhale and ingest toxic substances. The association between kidney cadmium burdens and various diseases related to kidney function also have been investigated. Several studies of hypertensive patients have shown kidney cadmium levels which are not elevated significantly above those observed for the general population. In another study involving nondialysed patients in renal failure, cadmium was examined as a co-factor in the cause of the renal disease. Although the patients had elevated liver cadmium values when compared with a control group, there was no correlation with the stage or onset of the disease. F. OTHER ELEMENTS Several other elements have been measured in vivo, but immediate applications have not been found as seen for the above elements. For example, copper and iron have been measured in vivo using neutron activation techniques, but only in patients with excessive overloads of these elements. These techniques are unlikely to be used for the examination of other types of patients because of the poor sensitivity for these metals and the much higher doses required (usually above 10 mSv). Alternate nuclear-based techniques appear more applicable for these elemenk3 One exception, however, is the measurement of body aluminum levels, as has been reported in patients with renal f a i l ~ r e . ~ In' the most recent study, a group of asymptomatic patients was examined by IVNAA to obtain an estimate of their bone aluminum burden. Each patient was classified solely on the basis of the aluminum/calciumratio value obtained
Volume 11
423
by the IVNAA technique. All the patients were classified correctly (diagnosis of aluminuminduced bone disease) by the IVNAA method when compared with the currently accepted clinical method (examination of blood aluminum at 24 h after i.v. administration of desfemoxamine). In addition, a good correlation was obtained between the in vivo aluminum/calcium ratio value obtained for the patients and the results of bone biopsies. This study indicates that during the course of their clinical management, renal patients can be evaluated routinely for their bone aluminum status. In addition, if aggressive chelation therapy is indicated for some patients to reduce the body burden of aluminum, the effectiveness of this treatment can be monitored on an individual basis using the in vivo measurement technique.
VII. CONCLUSIONS AND SUMMARY A variety of nuclear-based techniques make possible the study of human body composition in vivo. The use of IVNAA, however, provides added information about the chemical composition of the tissues. The IVNAA techniques have been used in both clinical research studies and in diagnostic applications. The measurements of total skeletal mass (calcium), body protein (nitrogen), and organ burden of cadmium are used most widely at present. Although initially developed at nuclear research laboratories, primarily as analytical tools, the methodologies have been advanced to a stage where facilities have been designed and built exclusively for clinical application. The measurement of body nitrogen by the prompt-gamma neutron activation technique is the only direct method by which to determine body protein mass. The radiation dose delivered to the subject is low compared with many common radiologic examinations and diagnostic tests. The radiation risks associated with this procedure have been judged to be sufficiently low to allow application in clinical studies of children. When the facilities for body carbon measurements are developed further, a single measurement is anticipated to determine directly the fat, water, and protein compartments of the body. Such measurements should find increasing applications in both the evaluation of nutritional status of the individual, and in the monitoring of patients receiving modified dietary intake. The use of transportable facilities to examine the liver and kidney cadmium burden in industrial workers has provided unique information on the body's response to this toxic metal. Routine monitoring of these populations at a 3- to 5-year interval has been proposed as a method to identify workers before the critical kidney burden level is exceeded. In England, for example, a national program has been organized to monitor workers in industries that use cadmium. This program now includes the in vivo measurement of all workers in the country. This chapter has presented a description of the various facilities developed specifically for IVNAA and reference to their clinical and toxicological applications. IVNAA will continue to provide unique data for use in clinical diagnosis, for the study of normal physiologic aging processes, and for the evaluation of the efficacy of therapeutic regimens. Monitoring of the patient's progress in the hospital or on an out-patient basis can be performed routinely with minimum discomfort and risk for the patient. Continued expansion of these techniques appears likely and routine use in specific settings is anticipated. In particular, large medical centers are expected to establish facilities that will serve as regional resources.
ACKNOWLEDGMENTS This work is a publication of the USDAIARS Children's Nutrition Research Center, Department of Pediatrics, Baylor College of Medicine and Texas Children's Hospital, Houston, TX. This project has been funded in part with federal funds from the U.S. Department
424
Activation Analysis
of Agriculture, Agricultural Research Service under Cooperative Agreement number 587MNI-6-100. The contents of this publication do not necessarily reflect the views or policies of the U.S. Department of Agriculture, nor does mention of trade names, commercial products, or organizations imply endorsement by the U.S . Government. The author thanks E. R. Klein and the editorial staff.
REFERENCES 1. Anderson, J., Osborn, S. B., Newton, D., Rundo, J., Salmon, L., and Smith, J. W., Neutron activation analysis in man in vivo. A new technique in medical investigation, Lancet, ii, 1202, 1964. 2. Parr, R. M., Ed., In vivo neutron activation analysis Proc. Panel 1972, Vienna, 1973. 3. Cohn, S. H. and Parr, R. M., Eds., Nuclear-based techniques for the in vivo study of human body composition, Clin. Phys. Physiol. Meas.. 6, 275, 1985. 4. Ellis, K. J., Yasumura, S., and Morgan, W. D., Eds., In Vivo Body Composition Studies, Institute of Physical Sciences in Medicine, London, 1987. 5. Knight, G. S., Beddoe, A. H., Streat, S. J., and Hill, G . L., Body composition of two human cadavers by neutron activation analysis and chemical analysis, Am J . Physiol., 250, E179, 1986. 6. Smith, J. W. and Boot, S. J., The variation of neutron dose with depth in a tissue-equivalent phantom, Phys. Med. Biol., 7 , 45, 1962. 7. Cohn, S. H., Fairchild, R. G., and Shukla, K. K., Theoretical consideration in the selection of neutron sources for total body neutron activation analysis, Phys. Med. Biol., 18, 648, 1973. 8. Morgan, W. D., Vartsky, D., EUi, K. J., and Cohn, S. H., A comparison of 252-Cf and 238-Pu,Be neutron sources for partial body in vivo activation analysis, Phys. Med. Biol., 26, 413, 1981. 9. Chamberlain, M. J., F r e d i , J. H., Holloway, I., and Peters, D. K., Use of cyclotron for whole body neutron activation analysis: theoretical and practical considerations, Int. J. Appl. Radiat. Isot., 21, 725, 1970. 10. Nelp, W. B., Palmer, H. E., Murano, R., Pailthorp, K., Gemas, M. H., Rich, C., Williams, J., Rudd, T. G., and Denny, J. D., Measurements of total body calcium (bone mass) in vivo with the use of total body neutron activation analysis. J . Lab. Clin. Med., 76, 151, 1970. 11. Spinks, T. J., Bewley, D. K., Ranicar, A. S. D., and Joplin, G. F., Measurement of total body calcium in bone disease. J . Radioanal. Chem., 37, 345, 1977. 12. Boddy, K., Holloway, I., and Elliott, A., A simple facility for total body in vivo activation analysis, Int. J. Radiat. Isot., 24, 428, 1973. 13. Cohn, S. H., Shukla, K. K., Dombrowski, C. S., and Fairchild, R. G., Design and calibration of a "broad-beam" 238-Pu,Be neutron source for total-body neutron activation analysis, J. Nucl. Med., 13, 487, 1972. 14. Cohn, S. H. and Dombrowski, C. S., Measurement of total-body calcium, sodium, chlorine, nitrogen and phosphorus in man by in vivo neutron activation analysis, I . Nucl. Med., 12, 499, 1971. 15. Palmer, H. E., Nelp, W. B., Murano, R., and Rich, C., The feasibility of in vivo neutron activation analysis of total body calcium and other elements of body composition, Phys. Med. Biol.. 13, 269, 1968. 16. Ellis, K. J., unpublished data, 1987. 17. Boddy, K., Harden, R. M. G., and Alexander, W. D., In vivo measurement of intrathyroidal iodine concentration in man by activation analysis, J . Clin. Endocrinol. Metab., 28, 294, 1968. 18. Catto, G. R. D., McIntosh, J. A. R., and MacLeod, M., Partial body neutron activation analysis in vivo. Phys. Med. Biol., 18, 508, 1973. 19. Spinks, T. J., Bewley, D. K., Jopli, G. F., and Raincar, A. S. O., Neutron activation of metabolic activity of sodium in the human hand, J . Nucl. Med., 17, 724, 1976. 20. Boddy, K. and Glaros, D., The measurement of phosphorus in human bone using radioactive sources a technique for partiat body in vivo activation analysis, Int. J . Appl. Rad. Isot., 24, 179, 1973. 21. Ellis, K. J. and Kelleher, S. P., In vivo bone aluminium measurements in patients with renal disease, in In Vivo Body Composition Studies, Ellis, K . J., Yasumura, S., and Morgan, W. D., Eds., The Institute of Physical Sciences in Medicine, London, 1987, 464. 22. McNeill, K. G., Thomas, B. J., Sturtridge, W. C., and Harrison, J. E., In vivo neutron activation analysis for calcium in man, J . Nucl. Med., 14, 502, 1973. 23. Rundo, J. and Bunce, L. J., Estimation of total hydrogen content of the human body, Nature, 210, 1023, 1065.
Volume 11
425
24. Biggin, H. C., Chen, C. S., Ettinger, K. V., Fremlin, J. H., Morgan, W. D., Nowotny, R., and Chamberlain, M. J., Determination of nitrogen in living patients, Nature, 236, 187, 1972. 25. Vartsky, D., Ellis, K. J., and Cohn, S. H., In vivo measurement of body nitrogen by analysis of prompt gamma from neutron capture, J. Nucl. Med., 20, 1158, 1979. 26. Mernagh, J. R., Harrison, J. E., and McNeill, K. G., In vivo determination of nitrogen using Pu-Be sources, Phys. Med. Biol., 5, 831, 1977. 27. Ryde, S. J. S., Morgan, W. D., Evans, C. J., Dutton, J., Sivyer, A., McNeil, E., and Sandhu, S., A new multi-element analysis system using Cf-252: calibration and performance, in In Vivo Body Composition Studies, Ellis, K . J . , Yasumura, S . , and Morgan, W. D., Eds., The Institute of Physical Sciences in Medicine, London, 1987, 287. 28. Beddoe, A. H., Streat, S. J., and Hill, G. L., Evaluation of an in vivo prompt gamma neutron activation facility for body composition studies in critically ill intensive care patients: results on 41 normals, Metabolism, 33, 270, 1984. 29. Oxby, C. B., Appleby, D. B., Brooks, K., Burkinshaw, L., Krupowicz, D. W., McCarthy, I. D., Oldroyd, B., Ellis, R. E., Collins, J. B., and Hill, G. L., A technique for measuring total body nitrogen in clinical investigations using the 14-N(n,2n)13-N reaction, Int. J. Appl. Radiat. Isot., 29, 205, 1978. 30. Vartsky, D., Absolute Measurement of Whole Body Nitrogen by In Vivo Neutron Activation Analysis, Ph. D. thesis, University of Birmingham, England, 1976. 31. Ellis, K. J., Vartsky, D., and Cohn, S. H., A mobile prompt gamma neutron activation facility, in Nuclear Activation Techniques in the Life Sciences, International Atomic Energy Agency Press, Vienna, 1978, 733. 32. Cummins, P. E., Dutton, J., Evans, C. J., Morgan, W. D., and Sivyer, A., A sensitive 252-Cf neutron activation analysis instrument for in vivo measurement of organ cadmium, J. Radioanal. Chem., 71, 561, 1981. 33. McLellan, J. S., Thomas, B. J., Fremlin, J. H., and Harvey, T. C., Cadmium - its in vivo detection in man, Phys. Med. Biol., 20, 88, 1975. 34. Krauel, J. B., Speed, M. A., Thomas, B. W., Baddeley, H., and Thomas, B. J., The in vivo measurement of organ tissue levels of cadmium, Int. J . Appl. Radiat. Isot., 31, 101, 1980. 35. Kyere, K., Oldroyd, B., Oxby, C. B., Burkinshaw, L., Ellis, R. E., and Hill, G. L., The feasibility of measuring total body carbon by counting neutron inelastic scatter gamma rays, Phys. Med. Biol., 27, 805, 1982. 36. Kehayias, J. J., Ellis, K. J., Cohn, S. H., Yasumura, S., and Weinlein, J. H., Use of a pulsed neutron generator for in vivo measurement of body carbon, in In Vivo Body Composition Studies, Ellis, K . J . , Yasumura, S., Morgan, W. D., Eds., The Institute of Physical Sciences, London, 1987, 427. 37. Leach, M. O., BeM, C. M. J., Thomas, B. J., Debek, J. T., James, H. M., Chettle, D. R., and Fremlin, J. H., In vivo measurement of calcium by the 37-Ar method: a study of the effect of recirculating breath collection systems on the exhalation rate, Phys. Med. Biol., 23, 282, 1978. 38. Bigler, R. E., Total body calcium by the 37-Ar method: current feasibility status, Appl. Radiol., 7, 149, 1978. 39. Vartsky, D., LoMoRte, A., ENS, K. J., Yastunura, S., and Cohn, S. H., A proposed method for in vivo determination of lithium in human brain, Phys. Med. Biol., 11, 1225, 1985. 40. Glaros, D., LoMonte, A., E l i , K. J., Yasumura, S., Stoenner, R. W., and C o b , S. H., In vivo determination of lithium in the body: a neutron activation analysis technique, Med. Phys., 13, 45, 1986. 41. Cohn, S. H., Shukla, K. K., and Ellis, K. J., A multivariate predictor of total body calcium, Inr. J. Nucl. Med. Biol., 1, 131, 1974. 42. Kimmel, P. L., Radiologic methods to evaluate bone mineral content [Position paper by American College of Physicians], Ann. Intern Med., 100, 908, 1984. 43. Cohn, S. H., In vivo neutron activation analysis: state of the art and future prospects, Med. Phys., 8, 145, 1981. 44. Chettle, D. R. and Fremlin, J. H., Techniques for in vivo neutron activation analysis, Phys. Med. Biol., 29, 1011, 1984. 45. Ellis, K. J., Y a s u a m , S., Vartsky, D., Vaswani, A. N., and Cehe, S. H., Total body nitrogen in health and disease: effect of age, weight, height, and sex, J. Lab. Clin. Med., 99, 9 17, 1982. 46. Archibald, E. H., Pencharz, P. B., Bell, L. E., Stpllmgs, V. A., and H a d s e n , J. E., Long-term body composition changes with the protein sparing modified fast, in In Vivo Body Composition Studies, Ellis, K . I., Yasumura, A., and Morgan, W. D., Eds., The Institute of Physical Sciences in Medicine, London, 1987, 39. 47. Yasumura, S., Brennan, B. L., Letteri, J. M., Zanzi, I., Ellis, K. J., Roginsky, M. S., and Cohn, S. H., Body electrolyte composition in normal subjects and hypertensive patients on therapy, Miner. Electrol. Metab.. 2 , 94, 1979. 48. Yasumura, S., C o b , S. H., and Ellis, K. J., Measurement of extracellular space by total body neutron activation, Am J. Physiol., 244, R36, 1983.
426
Activation Analysis
49. Burkinshaw, L., Models of the distribution of protein in the human body, in In Vivo Body Composition Studies, Ellis, K . J . , Yasumura, S., and Morgan, W. D., Eds., the Institute of Physical Sciences in Medicine, London, 1987, 15. 50. Ellis, K. J., Yuen, K., Yasumura, S., and Cohn, S. H., Dose-response analysis of cadmium in man: body burden vs kidney dysfunction, Environ. Res., 33, 216, 1984. 51. Ellis, K. J., Estimates of increased risk of cadmium-induced renal dysfunction, in Proc. Int. Conf. Heavy Metals in the Environment, Lekkas, T . D., Ed., CEP Consultants, Edinburgh, 1985, 558. 52. Scott, M. C. and Chettle, D. R., In vivo elemental analysis in occupational medicine, Scand. J. Work Environ. Health, 12, 81, 1986. 53. Ellis, K. J., Vartsky, D., Zanzi, I., Cohn, S. H., and Yasumura, S., Cadmium: in vivo measurement in smokers and nonsmokers, Science, 205, 323, 1979. 54. Snyder, W. S., Ed., Report of the task group on reference man (ICRP Report 23). Pergamon Press, New York, 1984, 327.
Volume I1
427
Chapter 11
ACTIVATION ANALYSIS IN ARCHAEOLOGY
.
.
I Kuleff and R Djingova
TABLE OF CONTENTS I.
Introduction ..................................................................... 428
I1 .
Activation Analysis of Clay and Pottery ........................................429 A. Analysis ................................................................. 430 B. Standards ................................................................ 439 C. Application .............................................................. 441
I11.
Activation Analysis of Glass ....................................................445 A. Analysis ................................................................. 445 B. Application .............................................................. 449
IV .
Activation Analysis of Natural Glass ...........................................452 A. Analysis ................................................................. 453 B. Application .............................................................. 457
v.
Activation Analysis of Rocks ................................................... 458 A. Marble. Limestone ...................................................... 458 B. Steatite .................................................................. 461 C. Flint ..................................................................... 462 D. Other Materials .......................................................... 463 Activation Analysis of Bones ................................................... 463
VI . VII .
467 Activation Analysis of Ancient Metals .......................................... A. Copper and Copper Alloys ..............................................472 B. Silver and Lead .........................................................473 C. Gold ..................................................................... 476 D. Iron ...................................................................... 476
VIII
Conclusion ...................................................................... 477
References ..............................................................................477
428
Activation Analysis
I. INTRODUCTION In the last 25 years, a new scientific field with the precise name archaeometry appeared on the border between history and archaeology and physics, chemistry, and mathematics. Archaeometry actually covers the application of modem physical, ~hemical'.~ and mathemati~al~.~ methods in the investigation of archaeological materials with the aim to solve historical and archaeological problems. The scientists working in this field "try" to define objective criteria which combined with the "stylistic sense" of the experts to help in the study of archaeological findings and objects of art. The scheme in Figure 1 is an attempt to represent the variety of archaeometric investigations, and to give an idea about most of the methods used in an archaeometric study. Obviously the place of activation analysis is among the methods giving information first of all about the chemical composition of the findings but it may be used for age determination too (K-Ar method, e.g., Reference 5; chemical dating of bone, e.g., References 1 and 2). The chemical composition of an archaeological finding (pottery, glass, metal, etc.) usually reflects the geochemical features of the raw materials it was made of (clay, sand, plant ash, or natural soda, ores, etc.). Thus it is possible to detect the source of raw materials or to find relationship between investigated samples leading in most cases to revealing the origin of the finding. There are several more reasons why chemical analysis of archaeological materials is undertaken. One of the most important is that chemical composition helps the understanding of ancient technology. Another motive is that chemical analysis gives valuable information needed for conservation and restoration of the finding. These are actually the main reasons that make chemical composition one of the objective criteria widely used in archaeometry nowadays. Practically all analytical techniques are used for analysis of archaeological materials. The applicability of an analytical method in archaeometry however is determined by several criteria: 1.
2.
3.
4.
The method should ensure the reliable determination of 10 to 20, even 30 elements and thus multielement methods are preferable. The method should possess high sensitivity, since most of the interesting elements are present at micro- and trace levels and the quantity of the sample is limited. In most cases, information for macroelements is desirable, so a definitive advantage of the method will be if it allows the simultaneous determination of macro- and trace elements. The method should guarantee high precision and accuracy. In an archaeometric study, necessity for comparison of analytical data obtained by different persons (in different time, using different methods) may arise. It will be successful only in cases of highly accurate work. In the case of provenance, study to reveal differences in the chemical composition of samples made in near-by producing centers will be possible only if the method possesses high precision. The method should not be labor-consuming, since the solution of an archaeological problem usually demands analysis of a large number of samples. An advantage will be the possibility for automation of the analysis.
In view of the above requirements, it is not at all amazing why the nuclear methods for analysis and mainly instrumental neutron activation analysis (INAA) are among the most widely used methods in archaeometric studies. The aim of the present chapter is to make a critical review of different activation methods - neutron activation analysis (NAA), photoactivation analysis (GAA), activation analysis with charged particles, described in the literature, and used in archaeometric investigations of pottery, glass, metals, and alloys, natural materials (obsidian, marble, flint, etc.). Thus
Volume 11
429
FIGURE 1. Archaeometry - classification and relations between separate scientific fields.
the present status of activation analysis methodology will be outlined and we hope that in this way further research in this field will be stimulated and scientists who have not yet used their knowledge and ability in archaeometry will be encouraged to look for new analytical solutions of archaeological problems.
11. ACTIVATION ANALYSIS OF CLAY AND POTTERY The weathering of magmatic and methamorphic rocks leads to the formation of clay which is raw material for the production of pottery. Clays consist of highly dispersive alumosilicates usually with indefinite composition. Besides macrocomponents - A1,0,, H,O, and SiO, - a lot of impurities like Ca, Fe, K, Na, Mg, and Ti oxides are present in clays as well as many organic substances their quantity varying within large intervals. The same is valid for the numerous minerals building clays. In spite of this variety it is possible on the basis of chemical and mineralogical studies to differenciate reliably clays from different beds (see e.g., References 4, 6, 7). Usually to produce pottery, only water is added to clay and after molding several drying procedures are applied. At temperatures between 370 to 470 K the hygroscopically bound water and at 570 to 670 K the chemically bound water is removed and the clay minerals disintegrate. At temperatures above 970 K, the clay components fuse and the ceramic material is ready. Sometimes addition of temper is practiced. This easy technology is used since ancient times and permits the production of materials (pottery, porcelain) very resistant to environmental factors. This quite easily explains the fact that pottery is among the most common archaeological findings. Its investigation reveals the artistic flair and the way of life of the population. It leads to conclusion about trade connections between different cultures and people. Bearing in mind that clay sources usually have been in close proximity to the place of production, it is quite clear that the comparison of the chemical composition of ceramic findings will most probably permit discovery of the clay bed used as raw material source. Of course in many cases it is not necessary to detect the clay source, but it is enough to give a probability for grouping of the samples on the basis of their chemical composition.
430
Activation Analysis
It seems that the above considerations explain well why provenance study of pottery is one of the most popular archaeometric investigations. A. ANALYSIS First emission spectroscopy has been the method used in provenance studies, but today the most popular methods in this research are NAA and X-ray fluorescence (XRF). Atomic absorption analysis (AAS) finds certain application as ~ e l l . ~ - It ' Omay be expected that soon the number of papers, using inductively coupled plasma atomic emission spectroscopy (ICPAES) in provenance study will grow. The necessity to dissolve the samples, however, is one of the main reasons which make at present ICP-AES and AAS noncompetitive with NAA in the localization of pottery. A summary of the papers on activation analysis of pottery, published in the last 10 years is presented in Table 1. The basic nuclear method used by scientists in this field is NAA, which easily can be explained with the fact that it permits the determination of up to 35 elements in the ceramic sample. To the authors' knowledge there is only one e x ~ e p t i o n , ~ ~ utilization of GAA in provenance study of pottery. An advantage of GAA is that it permits the determination of such elements as C, N, 0 , F, Mg, Nb, Pb, etc. which either cannot be determined by INAA or their determination is not very sensitive. A serious handicap, however, for the use of GAA is its considerably lower sensitivity. Due to the low intensity of the bremsstrahlung, the radioactivity induced in the sample is rather low and demands long measuring times. This affects the productivity of the analysis. These and some other reasons make GAA noncompetitive with INAA in provenance study of pottery. With the exception of several methodological papers24.30.33.35 which study the possibilities for the determination of 1 to 3 elements, the schemes proposed for INAA of pottery permit the determination of 7 to 35 elements in 1 sample. In the NAA schemes presented in Table 1, the samples are usually irradiated OnCe,13,16,18,21,22,24-28,30-35,37-40.42-45,47 tW011,12,15.17.23,29,41,48 or three times14.19.36.46 in nuclear
reactor followed by 1 to 6 gamma measurements. Mostly the irradiation is performed with pile neutrons. Only in rare cases4' and for the determination of Al, Mg, and Si, activation ~ . ~ ~ 3 ~ ~ with epithermal neutron^^^.^^.^^ or with well-thermalized neutron f l ~ ~is ~performed. The use of epithermal neutrons permits also the reliable determination of U as ~ e 1 1 . ~ ~ , ~ ~ , ~ ~ Independently of the analytical approach in about 60% of the papers in Table 1, the content of Ba, Ce, Cr, Cs, Eu, Fe, Hf, La, Na, Rb, Ta, Th, and Yb is determined. These are elements for the determination of which INAA does not meet serious problems. Attention should be paid only to the determination of Ce because the only gamma line (145.5 keV) of 141Ce is interfered by 142.5-keV gamma line of 59 Fe. So correction for the influence should be introduced. The possible interference of 147Nd(319.4 keV), Ig2Ta(321.2 keV - pile-up of 100.1 keV plus 221.1 keV), and of iron (54Fe/n,a P C r ) on the determination of 51Cr(320.1 keV) may be neglected in the case of pottery. (Perlman6' estimates this influence to be 0.9, 0.6, and 0.2%, respectively). There is not a definite agreement between scientists on which gamma line of lg2Tashould be used in the analysis of pottery. This may be either the 1221.3-keV or 67.1-keV gamma lines. The low energetic line ensures 2 to 3 times higher sensitivity, but it implies working in the low energetic region (strong influence of high energetic gamma rays!). On the basis of our experience, we recommend the use of 67.1-keV gamma line. Among the most determined elements (Table 1) are K, Lu, Mn, Sc, Sm, As, Ca, Sb, and U as well. The instrumental neutron activation determination of some of these elements, however, has problems which we will discuss here. The severest problem arises when the determination of Ca is done by 47Caor 4 7 S ~ , generated by the reaction
TABLE 1 Activation Analysis of Pottery No.
Author(s)
1. Perlman & Asaro (1969)" INAA (27) sample (100 mg)
Irradiation
t,
N, (1.7 x 10'') 6 min
N, (2
X
10")
8h
2. Sayre et al. (1971)12 INAA (9) sample (20-40 mg)
N, (4.4 x loL2)10 s N, (1 X 10") 24 h
3. Delcroix & Philippot (1973)13 INAA (30) sample (? mg)
N, (1 x 10¹²) 33 min
Bauterla et al. (1973)14 N, (4 x lo9) INAA (22) N, (1 X lo1') sample (50-300 mg) N, (5 x 10")
3 min 6 min 10 h
5. Abascal et a1 (1974)15 N, (1 x 10¹⁴) INAA (17) N, (5 x loi4) sample (40 mg)
3 rnin
4.
6. Abascal et al. (1976)16 N, (4 INAA (18) sample (50- 100 mg) 7. Bieber et a1.(1976)I7 INAA (17) sample (40 mg)
X
10")
k
t~
Determined elements
2 min
900 s
Ba,Eu,Mn,Na.Sr
8d
3000 s
As,Br,Ca,La,Lu,Sb,Sm,Ti,U,Yb
Standard Perlman & Asaro special prepared standard pottery
10800 s Ba,Ce,Co,Cr,Cs,Eu,Fe,Hf,Ni,Rb,Sb, Sc,Ta,Th,Yb,Zn ? Mn USGS-AGV? La,Sc I ,BCR-1,G? Ce,Cr,Eu,Th 2,GSP-1,DTC? Co ,Fe I ,PCC-1 ? As, Au,Ba,Br,Ca,Ce,Co,Cr,Cs,Cu,Eu,Fe, Monostandard ? Gd,Hf,lr,K,La,Lu,Na,Nd,Rb,Sb,Ta,Tb, method ? Th,U,W,Yb,Zr ? ? ? ? ?
3.5 h
200 s 4000 s 4000s
16 h
?
3 min
?
N, (5 x loL4) 3.5 h
4000 s
N, (1 x 10'~) 30 s
200 s
Al,Mn,Na,V Ca,Eu,K,Mn,Na,Sm
Object Pottery from Peru and Upper Egypt
Mayan fine orange pot'ery Standard reference medieval potteryCRAM France
Samian ware ?
Ba,Ce,Co,Cr,Cs,Fe,La,Lu,Rb,Sc, Sm,Ta,Th,U Mn K,La,Na
USGS:AGV1,BCR-1,DTSBa,Ce,Co,Cr,Cs,Eu,Fe,Hf,Lu,Rb,Sc, 1,GSP-1,GTa,Th 1,FCC-1 Ba,Ce,Co,Cr,Cs,Eu,Fe,Hf,Rb,Sb,Sc,Ta, USGS:AGVTb,Th 1,BCR-1,DTSK,La,Mn,Na 1 ,GSP-l,G1,PcC-1 Ba,Ce,Co,Cr,Cs,Eu,Fe,Hf,Lu,Rb,Sc,USGS:AGV-I Ta,Th BCR-1,DTSMn 1,GSP-1,G1, K C - 1
Ceramic from Teotihuacan (Mexico)
Ceramic figurines from Tlatilco (Mexico) Pottery from eastem Mediterranean
TABLE 1 (Continued) Activation Analysis of Pottery No.
Author@)
Irradiation
t,
Determined elements
tc
8. Birgul et a1 (1976)18 INAA (14) sample (100 mg)
N, (?)
24 h
7d 21 d
9. Hancock (l976)I9 INAA (35) sample (200 mg)
N, (I x 10")
1 min
21 min
10") 6 min 16 h
16 h 5-6 d 12 d
N, (2.5
X
10. Segebade and Lutz G(E <30 MeV) (1976)20 GAA (17) sample (?) 11. Aspinall (1977)21 N,(2 x 10¹²) 1NAA (15) sample (100 mg) 12. Hansen et al. (1978)22 Nr(4.5 x 10") INAA (13) sample (150 mg) 13. Attas (1980)23 Nr(6.6 X 10l2) 1NAA (22) N,(4.5 x 10¹²) sample (100 mg) 14. Ferreira-Marques and N,(1.3 x 10¹³) Schubiger (1980)" INAA (19) sample (150-250 mg) 15. Grimanis et al (1980)25 Nr(2.2 x 10") INAA (19) sample (60 mg) 16. Schwabe (1980)26 N,(3 x 10") INAA (21) sample (?)
2h
30 m
24 h
2d 21 d
3h
15s 2h 3 min 3h
45 min
25 h
6d 21 d 7d 30 d 90 d
Object
P&A standard pot- Turkish and Canatery dian clays; ancient and medieval pottery from Turkey Pure metals & salts P&A pottery standard, NBS:SRM1633a
Pure salts
La,Na,Sm
Terra-Sigillata
P&A standard pot- Pottery from various English medieval industries Danish reference Floor-tiles from clay Danish churches
tery Ce,Co,Cr,Cs,Eu,Fe,Hf,Rb,Sc,Ta,Tb,Th
7d 30 d 3h 5d 21 d 20 h 7-11
Standard
P&A standard pot- Greek pottery from terY Lerna (Early Bronze Age) SRM-CRAM ? (France)
d
La,Lu,Na,Sm,Yb
USGS:GSP-1 P&A Greek ceramic vases "Tapsos Th,Zn class" Ba,Ca,Ce,Co,Cr,Cs,Eu,Fe,K,Hf,La,Lu, USGS:G-2 AGV- 1 Pottery from Peru Na,Rb,Sb,Sc,Ta,Tb,Th,U,Yh and Berlin
Ce,Co,Cr,Eu,Fe,Hf,Rb,Sb,Sc,Ta,Tb, standard pottery
17. Hancock (1982)28 N,,(2.5 x 10¹²)5 min INAA (1) sample (200-300 mg) 18. Kaplan et al. (1982)29 Nr(2 X lOI4) 1 min INAA (15) ~ ~ ( 2 x. 61014) 7 h sample (40 mg) 19. Mello et al (1982)% INAA (14) sample (300 mg)
N,(1 x loL2)
20. Cesana et al. (1983)47 INAA (7) sample (200-500 mg) 21. Fillieres et al. (1983)32 INAA (22) sample (50- 100 mg) 22. Pike and Fulford (1983)" INAA (11) sample (20-30 mg) 23. Slusallek et al. (1983)" INAA (8) sample (100-200 mg) 24. Cesana and Terani (1984)35 INAA (2) sample (500 mg) 25. Hancock INAA (33) sample (200-300 mg)
N,(2.5 x 10¹⁰) 2 min
30 h
17-20
min 300 s
Pottery from various places Pottery from Tell el Yahudiyeh
?
? ?
K,Mn,Na Ba,Ce,Co,Cr,Cs,Eu,Fe,Hf
7d 21 d
? ?
Ce,Co,Cr,Eu,Fe,Hf,Sb,Sc,Th
USGS:AGV-1; BCR-1; DTS-1; GSP-1; G-1; PCC1 USGS:BCR-1 GSN (France)
Al,Ca,Mg,Ti,V Mn ,Na
?
?
15 min ?
N,(?)
SiO,
1 min 7h
?
30-36
h6 d
10-12
Ba,Ca,La,Lu,Yb
Ba,Ca,Ce,Co,Cr,Cs,Eu,Fe,Hf, K,La,(Lu),Mn,Na,Rb,(Sb),Sc,(Sm),Ta, ?
d
Pottery from Athenian Agora
Th,Yb,(Zn) N,(1
X
10")
As,Ce,Co,Cr,Fe,La,Lu,Sc,Sm,Th,YbP&A standard pot- Carthage blackterY
N,(3 x IOl3)
25 h
N,(1.3 x 10¹²) 1 min
7 min
N,(1 x 10") 3 min N , ( l x 1012) 6 m i n N,(2.5 x 10") 16 h
?
Al,Ba,Ca,Cl,Dy,M,Mg,Mn,Ti,Sr,U,VPure metals and
12h 7-14
Eu,Ga,K,Na
N,(6 x loL2)
24 h
4d 17 d
glazed pottery
USGS:G-2 AGV-1 Pottery from Greek GSP- I islands
7d
salts
As,Br,Ce,Co,Cr,Cs,Fe,Hf,La,Lu.
d
Ni,Rb,Sb,Sc,Sm,Ta,Th,Yb 26. Hughes and Vince (1984)37 INAA (22) sample (30-80 mg) 27. Yellin (1984))' INAA (15) sample (100 mg)
SRM-CRAM (France) Roman amphorae from N.E. Italy Phoenician pottery
3000 s 6000s
As,K,La,Lu,Na,Sb,Sm,U,Yb BMRL-standard Ba,Ce,Co,Cr,Cs,Eu,Fe,Hf,Rb,Sc,Ta,pottery
NBS-SRM-1632 NBS-SRM-1633, P&A standard pottery Spanish medieval potter3'
3 F
2
2
Tb,Th ~ ~ ( 1 ~ 1 0 3' h~ )
9d
1200 s
P&A standard pottery
P W
W
TABLE 1 (Continued) Activation Analysis of Pottery No.
Author@)
Irradiation
k
t,
28. Hancock (1985)39 INAA (2) sample (?) 29. Hou (1985)40 Nr(1.3 X 10") 15 h INAA (20) sample (100 mg) 30. Penev et al. (1985)41 N+(5 X 10IZ) 2 min N,(5 X lox3) 30 s INAA (3) sample (50- 150 mg) 31. Perlman (1985)42 INAA (11) sample (20-30 mg)
t~
Determined elements Ca,Ti
5d 15 d 30 d 1-10 1-10
? ? ? min 300 s min 300 s
Standard
Object
Pure salts
Various SRM's
?
Chinese porcelain
Pure salts
Various SRMs, Bulgarian medieval pottery Na,Ca,K,La,Sb,(Au,As,Br,Cu,Ga,W)P&A standard pot- Bichrome ware (coaxial) terY f m Cyprus and Ba,Ce,Cr,Fe,Hf,La,Lu,Mo,Nd,Sm,Ta, Palestina Tb,Th,U,(planar)
Ba,Ca,Ce,Cr,Eu,Fe,Hf,Nd,Ta,Tb,Th, Ti,Yb(planar) 32. Hancock (1986)43 N,(1 X 10") INAA (11) sample ( 2 0 0 - 4 mg) 33. Hopke et al. (1986)+' Nr(2 x lor3) INAA (26) sample (100 mg)
30-60
30 min 8h
s 16-20
rnin 300 s
Al,Ba,Ca,CI,Dy,Mg,Mn,Na,Ti,U,V ?
Egyptian ceramics
Ancient Turkish pottery
1 4h 24 h 7-14d
900 s 3600 s 3600s
Ba,Dy,In,Mn,Sr As,Ga,K,La,Na
7d 15 d
500 s 500 s
As,Au,Ba,Br,K,La,Lu,Mo,Na,Sb,Sm,NBS-SRM 1632A Pottery from Cy-
?
Ce,Co,Cr,Cs,Eu,Fe,Hf,Ni,Rb,Sb,Ta,Tb, Th,Sc,Yb,Zn
34. King et al (1986)" INAA (29) sample (500 mg)
Nr(7 x l0l2)
35. Kuleffetal.(1986)* INAA (32) sample (100 mg)
N+(5 x 10¹²) 2min
1h
u,w,Yb
Ba,Ce,Co,Cr,Cs,Eu,Fe,Hf,Nd,Ni,Sc, Sr,
N,(5
X
1012)
30 s
N,(1
X
10IZ)
12 h
1-10min 40min 1-10 min 2-3 h 5-6 d 30 d
300s 500 s 300 s 500s 2000 s 2000 s
Se,Ta,Th Al,Mg,Si (Sm),U Al,Mg,Si,Ti,V Dy,(K),Mn,(Na)
IAEA-SRM Soil9; SL- 1
As,Au,Ba,Br,K,La,Lu,Na,Sh,Sm,(U),Yb (Ba),Ce,Co,Cr,Cs,Eu,Fe,Hf ,Nd,Rb,(Sh), Sc,Ta,Tb,(Yb)
prus USGS:W- 1; BCR-1 Bulgarian medieval sgraffito ceramic
36. Wolff et al. (1986)47 INAA (15) sample (200 mg)
N,,(4 x 10")
37. Yeh & Harbottle (1986)48 INAA (21) sample (50- 150 mg)
N,(1 x lo1')
3h
1 min
N,(2.6 x lOI4) 6 h
24 h 7d
1500 s 7200 s
As,Co,Cs,Eu,Fe,Ga,K,La Na,Rb,Sc,Srn,Ta,Th,U
2h
?
K,Mn,Na
14 d
?
?
USGS:AGV-1; BCR-1; GSP-1 B~,c~,co,c~,cs,Eu,F~,H~,L~,Lu,R~,s~, DTC-1; G-2; PCCSc,Sm,Ta,Tb,Th,Yb,Zn 1
Classical and Hellenistic pottery from Mediterranean P&A standard pottery
Nore: N, = reactor neutrons, N, = thermal neutrons, N,, = epithermal neutrons, t, = irradiation time, t, = cooling time, t, = measuring time, INAA(**) = number of determined elements, sample(**) = quantity of the sample used for analysis, P&A standard pottery = Standard pottery of Perlman and Asaro, BMRL standard pottery = Standard pottery of British Museum Research Laboratory and (?) = no information is available.
436
Activation Analysis
The 1298.8-keV gamma line of 47Cais interfered mainly by the 1292-keV gamma line of 59Feas well as by the highly energetic 24Naand I4OLa.The alternative use of 4 7 Srevresents ~ the major analytical problem since both 46Ca (Reaction 1) and 47Ti (Reaction 2) generate 47sc:
and depending on the neutron flux used for the irradiation, the relative production of 4 7 S ~ from Ti and Ca may vary drastically. In a detailed study, H a n ~ o c kproved ~ ~ that neither Ca nor Ti may be determined in clay and pottery using 4 7 S ~SO . the only way for correct determination of both elements is to use the short-lived isotopes 49Caand 51Ti. In the determination of As, the interference of 82Br(554.3 keV) and of Iz2Sb(564.1 keV) on the 559.1-keV gamma peak of 76Asshould be taken into account. The same refers to 564.1-keV gamma line of Iz2Sb,influenced by 76Asand 134Cs(563.2 keV). The use of Iz4Sb(1691.0 keV) leads to 2 to 3 times decrease in sensitivity, which in most cases hinders the determination of Sb in pottery. In a limited number of papers (20 to 40% of the schemes in Table I), the determination of Al, Br, Dy, Mg, Nd, Ni, Sr, Tb, Ti, and Zn is proposed. The problems in the determination of A1 and Mg arise from the interfering nuclear reactions:
Two possible approaches exist: either to irradiate the samples with a well-thermalized neutron f l ~ ~ or ~ to~ evaluate , ~ ~the, contribution ~ ~ , ~ of ~(n,p) and (n,alpha) reactions after repeated irradiation with energetically different The 1014.5-keV gamma line should be used for the determination of Mg because its most intensive 843.8-keV gamma line is seriously interfered by 56Mn(846.6 keV). The irradiation with neutrons with different energies (pile, epithermal) besides solution of the question with the determination of A1 and Mg provides a possibility for determination of Si28,4L,46 and leads to more reliable determination of U.49350 Another "problematic element" in this group is Tb. Its 86.8-keV gamma line is severely interfered by 86.6-keV peak of 233Pa.Yellin38calculated the contribution of 233Pato be about 70% from the total peak. Thus a correction for this interference should be introduced. Another possibility is to use one of the other gamma lines of '% presented in Table 2. Neither of the ten most intensive gamma lines, however, is interference free. It seems that the 1178.1being, however, very low. That is keV peak is the least disturbed, its gamma yield (I,-) why most of the authors prefer the 879.3-keV gamma line. In this case, a correction for the interference of 4 6 S(889.3 ~ keV) should be introduced. The determination of Zn in geological materials is hardly possible by INAA due to the strong influence of 4 6 S(1120.5 ~ keV) and Is2Eu (1112.1 keV) on the 1115.5-keV peak of 65Zn.A possible solution may be found by: Gamma-spectrometry of the sample after 8 to 10 months cooling time1' ( 4 6 Shaving ~ much shorter half-life than 65Zn) Introduction of correction for the influence of *SC and 152Eu
Volume 11
437
TABLE 2 Some Gamma Lines of ' T b and Interfering Isotopes Gamma lines of V b (keV) E,,,,
hama
Photons , , , , & Is .- l
Note: Irradiation conditions, N,
Gamma lines (keV) E (1-3
Interfering radionuclide
=
1
X
.
1013 ~ r n - s-l; ~ ,t
=
Photons mg-I s-'
-
24 h; t = 30 d
In a limited number of papers (10 to 20% of the papers in Table I), the determination of Au, C1, Cu, Ga, W, Zr is proposed and very rarely (below 10%) the determination of Gd, In, Ir, Mo, Se, and Tm is discussed. In our opinion, this "attitude" of the scientists is determined most of all by the low content of these elements in pottery combined with the insufficient sensitivity of INAA achieved in their determination. Perhaps only in the case of Au are there other reasons. One of them is the inhomogeneous distribution of Au in pottery. In our experience, we have met values between 0.006 and 110 ppm. This makes the choice of a suitable standard rather difficult. That is why we consider that Au does not provide very useful information in provenance studies. Against the background of this discussion and the variety in the approaches in Table 1, it is rather difficult to give preference to one or another scheme of analysis. Having in mind that the basic idea of the analysis is provenance study so the principles of taxonomy should be con~idered.~' Two of them postulate that the more the number of determined elements, the more reliable is the localization of the investigated findings. Thus priority should be given to those of the schemes in Table 1 which permit the determination of the largest 46 But the price of the analysis should be taken into considnumber of elements."~'3~1y~36~41 eration, too, since to reach a solution of an archaeological problem, a lot of samples should be analyzed. Bearing in mind the above considerations, we propose an "ideal" scheme for INAA of pottery which quite easily permits the reliable determination of 30 to 34 elements. It is presented in Table 3. The short irradiation with thermal neutrons solves the problem with Mg and A1 and besides permits the determination of Ca, Ti, V, Dy, Mn, K, and Na. After at least 24-h cooling, the samples are irradiated with pile neutrons for a longer period for the determination of middle- and long-lived radionuclides. After 4- to 6-d and 4weeks cooling, the gamma spectra of the irradiated samples are measured. The best from the standpoint of the present state of measuring devices is to measure twice after each cooling period - with planar and with coaxial detector. (Such an approach has been used already by Perlman.42) The higher energy resolution of the planar detector decreases the interferences in the region below 400 keV.54,200 Thus in the first measurement (after 4- to 6-d cooling time), the planar detector ensures better determination of U, Sm, and in the second measurement (4-weeks cooling time) - of Ce, Cr, Nd, Ta, Tb, and Th. All other elements (Table 3) having analytical gamma lines above 400 KeV are determined after measurement with a coaxial detector. It m ~ s be t immediately mentioned that the coaxial
438
Activation Analysis
TABLE 3 Scheme for INAA of Pottery
I. Irradiation Well-thermalized neutron flux; tB = 1-5 1. t, = 5-15
Element
Radionuclide
Half-life
min
min Analytical gamma-lie (kev)
2. t, = 40-120
min
11. Irradiation Reactor neutron flux (n X 10"); tB = 10-20
AS-76 Au-198 Ba-131 Br-82 K-42 La-140 Lu- 177 Na-24 Sb-122 Sm-153 Np-239 Yb-175
Ce-141 Co-60 Cr-5 1 CS-134 Eu-152 Fe-59 Hf-181 Nd-147 (20-58 Rb-86 Sb- 124 SC-46 Ta- 182 Tb-160 Pa-233 Zn-65
Interference
h
Volume 11
439
detector permits the determination of all elements, but the simultaneous use of a planar detector increases the reliability of the analysis of some elements.
B. STANDARDS Although NAA may be used as an absolute method still today, it is considered better and more reliable to apply it as a relative one, so a standard is necessary. Thus besides the choice of radionuclides and analytical gamma lines, the quality of the standard is very important for the accuracy of the analysis. Table 1 demonstrates the large variety in the standards used for analysis of pottery. They may be classified in several groups: The Perlman & Asaro standard pottery Geological reference materials of the U .S. Geological Survey (USGS): AGV- 1, BCR1, G-2, GSP-1, DTC-1, PCC-1 Other standard reference materials: GS-N, IAEA-Soil-5, IAEA-SL-1 Primary standards, prepared after dissolution of pure metals or oxides Secondary "home-made" standards: Ohio Red Clay, British Museum Standard Pottery, Danish Red Clay, etc. Monostandard Method The existing situation makes the choice of a universal standard to be used by all archaeometrists rather difficult. One of the reasons is that Perlman & Asaro standard and some of the USGS SRMs are out of stock. Another very important reason is that it is practically impossible for all investigators to use one and the same standard. So the variety in the standards used in the analysis of clay and pottery will further increase. The necessity to discuss the problem of standards does not arise from inadequacy of the standards themselves leading to problems in the neutron activation determination, but from the fact that to derive useful information in provenance study nowadays, one often must compare new results with previous ones or results between laboratories. In these comparisons, scientists usually have problems due to discrepancies in the analysis. As a result, useful information is lost or analyses have to be repeated. The natural way to overcome these difficulties is to increase the accuracy of the analysis ~ ~our .~~ opinion, however, until this to better than 2 to 3%, as discussed by H a r b ~ t t l e . In natural aspiration of all analysts is fulfilled, an enormous amount of analytical data will be produced and a lot of useful information will be lost. It seems that at present, the best approach is to calibrate the results against one well-known and available reference material. It will be important to publish together with the results from the analysis of pottery, the results from the analysis of this reference material, obtained by the same method. This will enable the comparison between laboratories, everyone deriving a "correlation coefficient" against the other values. Until recently, the Perlman & Asaro standard" was used for this purpose and the accuracy of most of the existing methods was checked against it (see Table 1). Perhaps now, until a "standard of the standards" is proposed, the home-made Brookhaven Ohio Red Clay which is calibrated both against Perlman & Asaro standard pottery and USGS standard rocks may be used as international reference material. It has already been analyzed by several archaeometric groups (Brookhaven, Smithsonian Institution, GANOS, and the authors' laboratory in Sofia) and the results are presented in Table 4. The review of the results in Table 4 proves a good coincidence especially having in mind that the laboratories have used different standards. What is much more important is that on the basis of these results, each one of the participants may calculate his own correlation coefficient permitting the comparison of the results with the other three. (Such an approach has been already used in the investigation of obsidian.59)
440
Activation Analysis
TABLE 4 Results from NAA of Ohio Red Clay Obtained by Four Laboratories Concentration h x Element
Harbottleg (Brookhaven)
Blackmanm (Smithsonian Institution)
dd Our results (Sofia)
A1 % As Au Ba Ca % Ce Co Cr
Cs Cu
DY Eu Fe % Ga Hf Ir
K% La Lu Mg % Mn Mo Na % Nd Rb Sb Sc Si %
Sm Ta Tb Ti %
Th
u v W Yb
Zn Note: In parentheses = standard deviation.
The data in Table 4 permit a general conclusion about the precision of INAA of pottery. For most of the elements, it is below 10% which generally may be considered satisfactory. In separate cases, some of the laboratories have difficulties in the determination of certain elements (Lu, RSD = 25% in GANOS; Ta, RSD = 14% in Brookhaven; Ba, RSD = 15% in Sofia) which in our opinion is due to the standards used for the analysis. All four laboratories have precision problems with the determination of Au and Sb which probably arise from the quality of the material itself. In an archaeometric study, however, whether the precision is good depends on the problem to be solved (see Harbottle4"'). Thus the investigations of medieval ceramics in the authors' laboratory have proved that in most cases the precision of the analytical methoP
Volume 11
3
B 3
I
D A
B
A
B
E AA A
A A A A A A A AA A AAA AA AA AAA AAAAA AA AAA AAAAAAAAAAA AAAA
A AAA
1
- 4,O
-3,O
FIGURE 2.
-2,o
441
-1,o
1
3,o
Canonical variable plot from the discriminant analysis with all determined elements
FIGURE 3. Canonical variable plot from the discriminant analysis of the same objects as in Figure 2 without Au,Ba,Br,Nd,U.
is absolutely satisfactory. In the course of the investigations, however, a necessity arose to discriminate the production of two medieval pottery workshops, one of them situated in the old Bulgarian capital Tirnovo and the other in Varna (Black Sea coast) about 250 km from each other. The discriminant analysis using all 32 determined elements did not lead to reliable differentiation (Figure 2). The overlapping of the groups could easily be explained with the origin of the clays in this region which may have similar chemical composition. That is why to increase the reliability of the discrimination in the discriminant analysis, only elements were used if the precision in the determination of was better than 7%. Thus Au, Ba, Br, Nd, and U, having precision about or worse than lo%, were excluded from the mathematical interpretation. The resulting hystogram is presented in Figure 3. The two archaeologically significant groups are already well defined. The probability for the formation of the two clusters amounts to 100 and 98%, respectively. We use this example as one more illustration of the fact that the requirements towards the precision in a provenance study are determined by the problem itself. The data in Table 4 suggest some more considerations about INAA of pottery. The comparison of results between laboratories may be possible not only when the accuracy is high (or after calibration to a reference material) but also when there is coincidence in the determined elements. When different methods for analysis are used, this is rather difficult, but in the case of one method, scientists should equalize the determined elements. This must not be accepted as a proposal to stop looking for ways to enlarge the number of determined elements. The idea is along the other investigations, always to determine a "standard" list of about 20 elements, the determination of which does not meet serious problems, as the discussion in this chapter proved. C. APPLICATION Pottery findings coming from practically all geographical regions of the world and dated from neolith till present times have been studied in archaeometric investigations by NAA. So we tried to group as far as possible the papers on the basis of chronologo-geographical features. One of the interesting questions for the investigators of Egyptian culture is the technology of pottery production. All along the Nile there are a b t of clay beds suitable for pottery production. Although it should be possible to discriminate ceramic findings on the basis of
442
Activation Analysis
their chemical composition thanks to the different geochemical conditions of formation of the clay beds, there are a lot of chemically identical vessels along the river. Simultaneously chemically different pottery exists in one and the same place. To solve these questions NAA has been used as a basic method.'1~27~29~43~62-74~169~172~178~182 A lot of pottery from different historical periods as well as supposed clay sources for its production have been analyzed.27.43.63.64,68-72 Summarizing the results from the investigation, it may be stated that there are several groups of ceramic products depending on the clay source: Nile aluvial clays, mixture of aluvial and pleistocene clays, other local sources, and Nile aluvial clays with addition of CaCO, or CaS04.43,70,71 The latter possibility demonstrates that clay from one bed may be used for the production of at least two chemical types of pottery. The use of NAA enabled the revealing of this technology of perhaps unintentional addition of temper which initiated phase transition during the clay burning process and thus improved the quality of pottery. Meanwhile, it is very interesting that the vessels made of Nile aluvial clays have identical chemical composition along the whole river and this identity covers a long period of time (about 5000 years) as This result about the stability of the clay chemical composition is not new. It should be accepted as a confirmation of the result obtained from the investigation of modem clays and ceramic findings from the halcolith to the period of Islamization in Mesop~tamia.'~ Similar observations are reported about clays in C y p r ~ s , ~for ' the Palestine region,69for clays from Motia and S i ~ i l y , and ~ ' for Lakonian pottery ( G r e e ~ e as ) ~well ~ as for Mexican clays. 15.16 These observations have been made for regions with different geology although situated at similar latitudes and having dry and hot climate. The results may serve as evidence that, on the basis of the chemical composition of pottery findings established today, one can discover the clay source used for their production. It is desirable that similar observations are made for more humid regions with colder climate. One step in this respect is the result of the authors about pottery from the old Bulgarian capital Timovo. The analyzed findings archaeologically dated from the 13th to 18th centurieP have extremely similar chemical composition and cluster analysis grouped them together. If we return to Egyptian history again, we can mention the problem about Tell el Yahudiyeh ware, being the subject of investigation in many papers, among which there are several utilizing NAA.29,64,65 Attention is paid to these investigations because the comparison between the results from cluster analysis of typological and geographic data on the one hand and the analytical data about ware from Egypt, Levant, and Cyprus on the other is methodologically very interesting. The good correlation between the two classifications permits the authorsz9to postulate the existence of two types of Tell el Yahudiyeh ware - Egyptian and Levantine. Still more interesting are the conclusions about the mode of life in Egypt during the Middle Bronze Ages (1750 to 1550 B.C.) reached by Kaplan et aLZ9on the basis of their analytical results. Thus the usefulness of interdisciplinary investigations in the study of ancient cultures is demonstrated. Closely connected to the investigations of ceramic findings from Egypt are the archaeometric studies of pottery from the Near East (today's Israel, Lebanon, Syria, and Jordan), Mesopotamia (Iran, Iraq, East Turkey), and Cyprus. So naturally we like to mention the works on localization of pottery and clay beds from Levant and Palest i n e , z , 4 2 , 6 4 , 6 5 . 6 9 . 7 2 , 7 3 , 7 5 , 7 7 - 8 0 . ~ 4 ~ - 2 4M esopotamia,18,39.44,66.69,74475.81-88 as well as CypruS.17.32,42,45,65,69,73,89
Besides the geographic region, common between these investigations is that the reliable localization of the investigated findings leads to establishment of the connections between Cyprus and Levant, Palestine and Egypt ,29,w.65Cyprus and Egypt. These studies lead to the conclusion that the potters' wheel has been used considerably earlier in Cyprus, than was accepted by archaeologists.42~80 Closely connected to Egyptian history is the Berkeley project for the discovery of
443
Volume 11
Was~ukani,~',"the flourishing capital of the Kingdom Mitani. Clay tablets - letters of the king of Mitani to the Pharaoh -were excavated in Egypt. Asaro and c o - w ~ r k e r s ~assumed l.~~ that the "clay" letters were produced from the clay bed near Wassukani. They analyzed samples from six clay tablets and compared the results to data from the analysis of clay beds from the supposed regions in Syria and M e s o p ~ t a m i a . ~ ~ . ~ ~ Analogous project is in progress in Brookhaven for the discovery of an old port of Ala~ia.~~ We mention these investigations since they demonstrate the unique possibility that the results from the chemical analysis to be used for prospection studies (see Figure 1). Unexpectedly the results of Hallet et a1.62about medieval pottery from Yemen proved to be related to the investigation of ancient Egypt. In the course of the study, the authod2 surprisingly established similarity in the chemical composition of Yemen pottery and Egyptian aluvial pottery. Geochemically this similarity cannot be explained in any way. The determination of additional 24 elements and the use of factor analysis permitted the final discrimination of the two types of p0tte1-y.~~ This case is a demonstration of the mistake one can make in an archaeometric study when the problem is solved only by simple comparison of an unsufficient number of elements without using cluster or factor analysis. Besides pottery from C y p r ~ s ~ ~ . ~ ~ . subject ~ ~ . to ~ ~NAA . ~ archaeometric ~ , ~ ~ , ~ ~ , ~ ~ , ~ ~ ~ , studies are a lot of ceramic findings from the other isles of the Aegean Sea.17,23,25.32,34.47.69,76,89.91-99.344 These are findings from Crete,17,32,69,89.91RhodoS 34-89 L e s b o ~ ,T ' ~h~a ~~ ~o s , ~D~e, l' ~ s , Aegina,17.32.89 '~~ C o r f ~ etc. , ~ ~as well as findings from Delphy,25,89Athens, and many continental Greece: M y ~ e n a e , ' ~Lerna,23.95.97.98 ,~~.~~ other places. The aims of the investigations are different but the common idea is the identification of the clay source used in the production of a certain type of pottery or the establishment of trade routes of ceramic vessels. The interest towards pottery from the Aegean region from the 3rd millenium B .C. sprang from the role which this epoch has played in the development of human civilization. The establishment, comprehension, and explanation of the chronology and connections between the cultures, developed in Crete, the Cyclades, and continental Greece are closely connected with the investigation of pottery from this regi01-1.~" In a series of papers, Attas et a1.23,95-95nve~tigated a lot of pottery findings excavated in Peloponnesus and dated to the Early Bronze Age and gave information about the place of production of certain types of ceramics as well as about their distribution in central Greece. Simultaneously the investigations demonstrate the difficulties that arise when different elements are determined in the separate series of ~ a m p l e s . ~ ~ , ~ ~ The investigation^^^.^^ of the Greek archaeometric group at Athens contribute to the elucidation of the problem about the place of production of the so-called Tapsos pottery.25 They tried to reveal the trade between the Cyclades isles, Devos and Paros, the most northern Greek island Thasos, and continental Greece by investigating Melos ceramics from the 7th century B.C.93 In relation to the same problem is the work of Slusallek et a1.34 studying amphorae from Rhodos and other Greek islands, and of Ariel et investigating findings from Phoenicien. The results reported in Reference 47 are very interesting. Subject to investigation are pottery findings from the Athenean Agora, Carthage, Sicily, and South Italy, while the Athenean origin of a group of black-glazed pottery is proved. The same result is confirmed after analysis of ceramic shards from Carthage.Ioo So passing from the Aegean region to Carthage and the Roman Empire, it should be mentioned that ceramic findings from Carthage are investigated in References 31, 101 to 103, too. Besides imported Greek ceramics, high quality local production has been established.47.100.102 Extremely unexpected is the result of the study of Wolf and Harbottle."' They prove that the investigated amphorae from Carthage were produced in Marseilles which 9
17,32347
444
Activation Analysis
has been outside the trade routes of Carthage. This study is a wonderful demonstration of the usefulness of a "data bank" when a new archaeometric problem is being solved. South Galia, however, was the main corn supplier of the Roman Empire and the amphorae were used for transportation of the corn. The confirmation of this hypothesis is the aim of the investigations of many French scientists, mainly from the Orsay archaeometric group.6'~'04-109 Other papers are also devoted to the investigation of Galian p ~ t t e r y . ~ ~ J ~ ' - l ~ ~ A clay source used for the production of pottery from Roman times was established near Cologne. 115~116 Of special archaeometric interest is the problem of chemical stability of ceramics during their stay in the g r o ~ n d . l ' ~The - ' ~ ~results from the laboratory experiment of Segebade and Lutz1I7indicate that after 5.5 years treating of Roman pottery, it lost about 33% Mn, 20.5% ~ - ' ~ ~that an archaeometric Rb, 64% Cs, etc. This study, as well as other r e s ~ l t s , l ~proves investigation of pottery demands first macroscopic investigation of the findings to evaluate the condition of the shards and in this way ensures a reasonable evaluation of the analytical data. Results from analysis of Roman pottery from Italy30~113~122~'24 and CyrenaicalZ3are reported too. A natural successor of the Roman Empire is the Byzantine Empire where the traditions of pottery production developed still further. At present, independent of the great interest of archaeologists and historians, the archaeometric investigations of Byzantine pottery are limited and only the authors of this chapter have used NAA in such The sgraffito ceramics we investigated were popular in the whole Byzantine Empire and neighboring countries (Bulgaria, Russia) in the period of the 1lth to 18th centuries. Especially interesting are these sgraffito vessels, decorated with m o n ~ g r a m s , ~whose ~ ~ J meaning ~~ is not yet clear. As a result of our i n v e s t i g a t i ~ nthe , ~ local ~ ~ ~ Bulgarian ~~~ origin of some vessels with monograms has been established. This result contradicts the accepted view for the pure Byzantine origin of monogram ceramics. Enlarging the geography of the investigations we hope to reveal the meaning of the monograms. Many papers deal with the study of medieval pottery by NAA.22,37.129J30-133 The aim of these investigations is the localization of ceramic shards from Denmark,22.129England,21.~31-133 and We would like to mention the study of Spanish pottery, (8th to 3rd century B.C.), reported in Reference 134 because of the good combination between petrological and NAA37,130,'31 data which decisively improves the possibility for solution of the problem. After Spain, it is quite natural to cross the ocean and to mention the problems of the New World, solved by analysis of pottery. Although many investigations of Egyptian and Greek pottery have been done with the active participation of the leading archaeometric groups in Brookhaven, Berkeley, and Toronto, they also paid attention to pottery from the American continent. The major part of these studies are done by NAA.'5J6J35-140 They are as well as to revealing devoted to the study of Mayan pottery and its origin,'5.16~136.'41~142 the technology of production of Indian pottery from the Mississippi ~ a 1 l e y .Pottery l~ from Peru, Mexico, '35 the Dominican Republic,135 and the U.S .A. 137 has been also investigated. Investigation of New World pottery has been done by European scientists, too.Z6.'43J44 Peruvian pottery has been studied by using a successful combination of NAA and Mossbauer spectroscopy. In this way, useful information is obtained not only for the provenance study but about the burning conditions of clay. To finish with the geography of the NAA investigations of pottery, the works of Boule and Peisach should be m e n t i ~ n e d . ' ~They ~ - ' ~ tried ~ to elucidate the movement of the earliest population of South-West Africa by analysis of pottery. Methodologically interesting is the good combination of INAA and PIXE.'45 At the end, the work on the investigation of Indian pottery,'48 C h i n e ~ e , ~ ~ , ' ~ ~ and J a p a n e ~ e ' ~pottery ~ . ' ~ ~ and porcelain should be mentioned.
Volume 11
445
We hope that this review demonstrates the fact that reliable neutron activation determination of the chemical composition and the following localization of the findings and their clay sources leads to important historical conclusions about commercial contacts between regions and cultures as well as the evaluation of the technological level of production achieved by ancient social structures.
111. ACTIVATION ANALYSIS OF GLASS The raw materials for production of glass are sand (SiO,) and natural soda or plant ash, depending on the region. Usually the limestone and clay impurities in sand are sources of CaO(Mg0) and A120,.153-'55 The addition of small quantities of COO, CuO, Cr,O,, MnO,, Fe,O,, NiO, etc. to the melt colors the glass in different shades, while the addition of SnO, or Sb,O, leads to the production of opaque glass. Thus the production of high-quality glass materials demanded such skill and knowledge that even nowadays we cannot decide whether ancient craftsmen produced commercial goods or created works of art. The idea to study the chemical composition of glass findings appeared a couple of centuries ago with M. Klaproth's work, and ever since analyses are made mainly to reveal ancient technology of glass p r o d u c t i ~ n . ' ~Another ~ . ~ ~ ~aim , ~ ~of~ the investigations is to determine the type of raw materials used for the production and on this basis to localize the findings and reach conclusions about commercial contacts between different cultures and settlements or about the level of glass production. To answer the technological question, one should determine the macrocomponents in glass: SO,, Na,O (K,O), CaO (PbO, MgO, A1,0,). Additionally, to reveal the coloring technology, the content of COO, Cr203,FeO, Fe,03, MnO,, NiO, CuO, Sb,O,, etc. should be determined. This presents special requirements towards the analytical method which should permit the determination of Si, Na, K, Ca, Pb, Mg, Al, Ti, Sb, Co, Cu in a large concentration interval - from several percent to tenths or hundredth of a percent and below. A. ANALYSIS Evaluating the possibilities of activation analysis and having in mind this list of elements, it is evident that the problematic element is Pb. Successfully it may be determined only by PAAlS7or by GAA.I5' The problems in the determination of Al, Si and Mg have already been discussed (see Section 11), and the same approaches are to be used here as in the case of ceramic^.^^^^"."^ This demands, however, the analysis to be performed at the reactor site since the half-lives of the radionuclides of A1 and Mg, as well as of Ca, Cu, and Ti are below 10 min and that of Mn is 2.5 h. That is why the elements determined via radionuclides with half-lives longer than 10 h (Co, Cr, Fe, K, Na, Sb, etc.) are among the more often determined by activation analysis (see Table 5). Thus in our opinion, the following considerations explain why activation methods are not as widely used in the analysis of glass, aiming technological studies:
1. 2.
3.
Problems in the determination of basic components as Al, Mg, and Si, which are already overcome thanks to computerization of the data evaluation. Problems in the gamma-spectrometry of the irradiated samples due to their high Na content (see e.g., Reference 51). It is enough to mention that the normal Na content of soda-lime glasses is about 10 to 18%, but it may reach 21 to 22%.'53.'56In our opinion, this actually is the main problem in the NAA of glass. Another problem arises from the variable composition of glass, which introduces uncertainty in the analysis. The scheme of analysis which works perfectly well in the case of one type of glass, turns out to be not very adequate for other types and colors of glass, because of addition of different components. Thus in most of the blue glasses,
TABLE 5 Activation Analysis of Glass No.
Author@)
1. Gills et al. (1970)l" RNAA (6) sample (300-800 mg) 2. Coleman and Goode (1973)16' RNAA (26) sample (100 mg) INAA (3) sample (100 mg) 3. Kim and Born (1973)16' INAA (12) sample (50-200 mg) 4. Olin and Sayer (1974)169 INAA (15) sample (40-50 mg)
5. McGinley and Schweikert (1976)15' PAA (27) sample (?) 6. Nauer et al. (1976)'" INAA (16) sample (15 mg)
Irradiation N,(1.2
X
1013)
tc
t, 1-2
Determined elements
Standard
-
min
Object Modem glasses
?
1h N,(2 x 10¹²)
48 h
-
5d
9
NX5 x 1012)
1 min
~ ~ ( 1 x. 91 0 9
1h
~ ~ ( 1 x. 51014)
20s
2 min 10 min 60 min 7d
16h
4h 24 h 14d
~ ~ ( 2 x. 8loL4)
7h
14 d
P(E, 20 MeV) 0.5 mA 1-2 mA
15min 30min 1-2 h
lh 12h 2-3 d
N,(5 x 10")
24 h
28 d
A1 Mn Na Au,Co,Cr,Cs ,Eu,Hf, Sb, Sc,Ta,Tb, Th.Yb
Modem window glasses from England and Wales
Monostandard method (Ag)
USGS:AGV-I; French medieval BCR-1; G-2; GSP- glasses 1; DTS-1; K C -1
Ancient and medieval glasses from Ausma
7.
Kobayashi and Kudo (1977)''' RNAA (3) sample (250 mg) 8. Pemicka and Nauer (1979)'72 INAA (15) sample (50 mg) 9. Kanda et al. (1980)'73 GAA (12) sample (300 mg) 10. Sanderson and Hunter (198 INAA (13) sample (20- 150 mg) 11. Frana & Mastalka (1984)175 INAA (32) sample (10-20 mg) 12. Kuleff et al. (1984)'63 INAA (33) sample (40-80
N,(5-8
x 10'))
5-20
-
?
Cu,In,Ni
Pure salts
USGS:AGV-1 G-2
Glassmaking materials: Si02,CaC0,, MgO; NBS-SRM617 SRM-Standard glas I der D G G
Pure S O , , CaO, Na,O, pure metals NBS-SRM-613 and salts Pottery standard UB NPS-1
N,(3 x lo'?)
3 min 20 h
7-13 min 900 s 2-3d 1800s 7 d 1800-7200 20 d 1800-7200
25 s 90 rnin 5d 20 d 10 d 30 d
mg)
13. Penev et al. (1985)41 INAA (3) sample (100 mg)
min
N,,(5 x 10¹²) N,(5 x 10¹²)
2 rnin 30 s
270 s 300 s 2000 s 2000 s 2000 s 5000 s
Glasses from England and Sweden (1st millenium A.D.)
Al,Ca,Cl,Dy,Mg,Ti,V
As,Ba,Ce,Co,Cr,Cu,Eu,Fe,Hf, Pure salts s K,La,Lu,Na,Ni,Sb,Sc,Sm,Sr, s Ta,Tb,Th,U,Yb 1AEA:SL-I and Soil-5 plus pure salts
Pure salts
Note: RNAA = neutron activation analysis after radiochemical isolation of determined radionuclides. For other abbreviations see Table 1.
Celtic and Roman glasses
NBS-SRM-612 NBS-SRM-614 Ancient and medieval and modem glasses
NBS-SRM-612 Bulgarian medieval glasses
448
Activation Analysis the content of Co is very high (1 to 2% COO).'^^,'^^ Some purple glasses contain up to 2.5% Mn0.'55,159Many opaque glasses are produced after addition of up to 3% Sb205.154J55 All these elements activate very well in a nuclear reactor and having good gamma yields of highly energetic gamma quants change the "normal" spectrum drastically.
In spite of all these problems, NAA of glass is possible. It is extremely useful in provenance studies since in such investigations the microchemical composition of glass findings is very important. Thus one of the first applications of nuclear methods in archaeology was the work of Sayre'"' where NAA was successfully used in the investigation of Egyptian glass. Still the above problems have been perhaps the motive for some of the scientists to look for solutions by using radiochemical isolation of the e l e m e n t ~ . ' ~ ~ , ' The " ~ J ~removal ' of 24Na by absorption on HAP,'66 extraction scheme for group ~eparation,'"~ and substoichiometric NAA17' are discussed. Methods for PAA'57 and GAA173are proposed and even some quite exotic solutions like muonic activation a n a l y ~ i s ' ~ are '~'~ used. ~ The high Na content and resulting high radioactivity of the irradiated sample are the reasons for the longer cooling times usually recommended before the first gamma measurement (7 to 14 d). This, however, hinders the correct determination of potassium. Interfering radioactivity in the determination of long-lived radionuclides is generated by Co and Sb while in the case of short-lived radionuclides, by Mn. One possibility to reduce the high radioactivity interfering the determination of As, Br, Sm, Sr, Tb, Th, and U is to irradiate the samples with epithermal neutrons.lS3 Although the determination of As has already been discussed in the case of pottery (see Section 11), it must be mentioned here again. In some glasses with high Sb content, the instrumental determination of As is even impossible. The content of Sb in some glasses is so high (2 to 3% Sb203)'78that '24Sb(1364.2 keV) may even interfere with the correct determination of 24Na(1368.5 keV) especially after longer cooling periods (10 to 14 d). In such cases, it is better to use the escape peak of 24Naat 1732.1 keV. In this way, the methodological problems in the INAA of glass are exhausted. Of course other questions remain concerning most of all the improvement of accuracy and precision of the analysis. The review of the activation methods for analysis of glass (Table 5) indicates that Ce, Co, Cr, Cs, Eu, Fe, Hf, Sc, and Yb are among the most determined elements. Following them are Au, Ba, Cu, K, La, Lu, Mg, Mn, Sm, Ta, Tb, Th, as well as Al, As, Ca, C1, Na, Sr, and Ti. Only rarely the determination of Ag, Br, U, and V is mentioned. Multielement NAA permits the determination of macrocomponents (Al, Ca, Si, K, Mg, Na), of most of the impurities (Cl, Co, Cr, Cu, Fe, Mn, Sb, Ti), and many rare and rare earth elements (Ag, As, Au, Br, Cs, Hf, Rb, Sc, Ta, Th, U, V, etc.). This possibility offered by NAA actually permits the reliable localization of glass findings especially in combination with the methods of cluster and discriminant analysis (e.g., Reference 162). Keeping in mind the above discussion, we give as an example one scheme for INAA of glass (Figure 4) which has been successfully used in the analysis of colorless, green, and blue medieval glasses (Sb and Co content was less than 0.3 and 0.15%, re~pectively)."~ The scheme allows the determination of about 34 elements which include all basic macrocomponents with the exception of Si. (The determination of Si is also possible41 but with an error about lo%, which may be decisive in technological studies.) The experimental detection limit and precision are presented in Table 6, calculated from the analysis of SRMs. The necessity of twice measuring the radioactivity at the reactor site may be considered as an inconvenience of the scheme which may hinder its use by some laboratories. An alternative is the combination between INAA and XRF, which is perhaps the best from the
Volume 11
-
t,=l-l0min
SAMPLE I . Irradiation STANDARD Nepi/t I
AI,Mg
-0u
t c = LOrn~n
I
11. Irradiation
I
,a
449
t c = I-l0min @ Al.Ca,Cl.Cu,Mg,Ti ,V 7
La,Lu,Na,Sb,Sm,Yb
III.Irradiation Nr /tg=6n tcz30d
FIGURE 4. Scheme of INAA of glass: t, neutrons, and N,, = epithermal neutrons.
=
@ Ce.Co,Cr,Cs.Eu.~e~ Hf. Nd,Rb.Sc.Ta .Tb,Th
irradiation time, t,
=
cooling time, N,
=
pile
standpoint of the present status of analytical methods. One must have in mind, however, that XRF provides information for the element concentration of the surface layer.170.184 Nevertheless, this approach permits additionally the determination of elements like P, Pb, Zn which cannot be determined by INAA in glass. A very good example of combination between INAA and XRF is the work of Frana and Mastalkalbl as well as of Sanderson and Hunter. '74 Another possibility is the combination of INAA and GAA. GAA permits the determination of Al, As, Ca, Ce, Cr, Fe, Mg, Mn, Na, Nb, Ni, Sr, Ti, Y, Zn,lg5which eliminates the necessity for working at the reactor site, increases the number of determined elements, and improves the reliable determination of others. Usually primary standards have been used in the analysis of glass, all of them prepared by pipetting aliquots of standard solutions onto SiO,, CaCO,, or Na,CO,. A lot of SRMs have been directly used in the analysis -USGS standard rocks. 169~172Additionally combined standards have been utilized - SRMs with addition of certain elements to match the composition of glass (e.g., IAEA-Soil-5 with addition of Ag, Au, C1, Br, Sb, Ti, Na).lX3 Usually the accuracy of the methods is checked by analysis of the glass SRMs of NBS (SRM-610, 612 to 615, 617),41.157.L68,171J73,183 Standard Glass I of the German Glass So~ i e t y , Pilxington's '~~ synthetic medieval glass standard,174etc. B. APPLICATION Amazingly, the number of papers describing the application of INAA in the archaeometric studies of glass is rather limited. Perhaps the problems discussed already direct the attention of many scientists towards using other methods, but in this way, valuable information about some important trace elements is lost. That is why we will discuss in more detail several papers using INAA of glass for solution of archaeological problems. Olin and S a ~ r einvestigated '~~ a very interesting problem connected with medieval stained glasses in cathedrals. There is a possibility that in the Middle Ages, the original panels were removed and reconstructed with other glass whose provenance must be established. Examples of such reconstructions have been analyzed by Olin and Sayre.'* These are 52 specimens from a royal castle in Rouen (France), 10 samples from grisaille panel in the Princeton Museum, and a set of 32 random fragments. The concentration of 15 elements has been
450
Activation Analysis
TABLE 6 Detection Limit and Precision in INAA of Colorless Green and Blue Glasses, Determined Experimentally Element
Radionuclide
Gamma l i e (keV)
Al As Au Ba Br Ca Ce C1 Co Cr Cs Cu DY
A1-28 AS-76 Au-198 Ba-131 Br-82 Ca-49 Ce-141 C1-38 Co-60 Cr-51 CS-134 CU-66 Dy-165 Eu-152 Fe-59 Hf-181 K-42 La- 140 Lu-177 Mg-27 Mn-56 Na-24 Nd- 147 Rb-86 Sb-122 SC-46 Sm-153 Ta-181 Pa-233 Ti-51 U-239 V-52 Yb-175
1778.9 559.3 41 1.8 496.3 776.5 3084.4 145.4 1642.5 1332.5 320.1 795.8 1039.0 361.5 1408.1 1291.5 482.2 1524.7 1596.2 208.3 1014.5 846.7 1368.5 91.4 1078.8 564.1 889.2 103.2 67.1 311.9 320.1 74.7 1434.2 396.1
Eu Fe Hf K La Lu Mg Mn Na Nd Rb Sb Sc Sm Ta
Th Ti
u v Yb
LDL (n x g/p) 3 1 0.0004 1.5 0.04 14 0.05 8 0.05 0.3 0.03 2 0.02 0.002 28 0.03 2300 0.02 0.004 80 5 0.2 0.2 2 0.2 0.003 0.005 0.02 0.03 0.1 0.01 0.03 0.02
RSD (%)
2 10 6 13 10 5 5 8 5 6 6 5 5 5 10 5 5 4 4 8 3 4 8 5 7 6 3 3 6 5 12 3 7
Note: LDL = Detection limit according to Reference 342 (see also Reference 51); RSD = relative standard deviation.
determined (see Table 5). The most important result of this study is that, on the basis of the chemical composition, the production of different workshops may be discriminated. The similarity in the composition of Rouen glasses permitted the authors'69to reach the conclusion that they are not only produced in one workshop but some of them seem to be from individual batches of glass preparation. Similar is the idea of the investigation of Bulgarian medieval glasses carried out by the INAA has been used for the determination of 32 authors of this chapter.162~163~165~176~180 elements in glass findings from the old Bulgarian capitals Pliska and Preslav. The two settlements are situated very near one to another (about 50 km) and historically developed at the same time (9th to 10th century). Among the samples there was glass taken from the walls of glass-melting pots excavated in the glassworkshops in Pliska and Preslav. The analytical data were subjected to cluster and discriminant analysis and the findings were classified on the basis of their chemical composition. Two clusters were formed, one containing most of the samples from Preslav and the other, samples from Pliska. Among the
451
Volume 11
I . -7,50
-6.00
-L,M
-3,m
-1,50 0,OO 1,50 3,00 CANONICAL VARIABLE 1
1 1.50
6,m
FIGURE 5 . Plot of the first two canonical variables for glass samples from Pliska. (1) Glass from glass-melting pot; (2) Preslav (B); and (3) Pliska (C) (glass findings).
outliers, however, was the joint glass sample from several glass-melting pots from Pliska. The result was confirmed by discriminant analysis (Figure 5). Discriminating elements turned out to be Ti, Sb, Th, Eu, Yb. The results permit, for the first time, the evaluation of the chemical profile of Bulgarian medieval glass. The comparison of the macroelemental composition of Bulgarian and Bizantine gla~s'~5ndicate high similarity, meaning the use of one receipe for glass production. This is very natural bearing in mind the connection between Bulgaria and Byzantium in that period. Additionally, it demonstrates that only macroelements cannot be used in provenance studies of glass. The discrimination between the glass from Pliska and Preslav was achieved thanks to the use of NAA which enabled the determination of the discriminating elements (Ti, Sb, Th, Eu, Yb). The difference in the chemical composition of the Pliska group and the glass from the glass-melting pots from Pliska rose doubts about the dating of the workshop, which may be later than 10th century. This result demonstrates how, in the course of an archaeometric investigation, unsuspected results may be obtained which may change archaeological concepts and pose new questions. One more demonstration of the fact that macroelemental composition of glasses cannot be used as the only criterion in provenance studies is the work of Sanderson and H ~ n t e r , " ~ who investigated glass from the first millenium A.D., excavated in Sweden and Britain. The aim of the investigation was to find possible relationship between vessel typology and chemical composition and to elucidate the question of manufacturing and distribution area. This study complemented an earlier project concerning macroelement determination by energy-dispersive XRF. NAA has been used to determine 13 elements (see Table 5). The results indicate that the use of NAA in combination with XRF allowed distinction to be made between Scandinavian Snartemo-type beakers and English and Continental beakers of the Kempston type, whose macroelement composition was surprisingly consistent. This study indicated the possibility for examination of glass distribution in that time.
452
Activation Analysis
Another interesting question, subjected to many archaeological investigations, is Celtic glass production. The Celts inhabited Southwestern and Central Europe about the first millenium B.C. Later in the 1st century A.D., they were conquered by the Roman Empire. Celtic glass has been successfully investigated by NAA.159J64,175.186 Frana and Mastalka, together with the archaeologist V e n k l ~ v a , ' ~ investigated ~ ~ ' ~ ~ glass findings from the period 6th to the 3rd century B.C. Thirty two elements have been determined in 47 findings by NAA. As a result of this study, the chemical profile of Celtic glass in Bohemia is determined and certain chronological order in the use of Mn is established. Additionally, the results indicate that not Sn but Sb had been used in the production of yellow opaque glass. Using XRF, the authorslWdetermined Pb and established good correlation between Sb and Pb. The results from the analysis lead to the conclusion that local sand had been used as a raw material and excluded the possibility of the use of local plant ash as the alkali source. Gebhard et al.lJ9investigated Celtic glass from Manhing (West Germany). The content of 5 elements is determined in 171 findings, dated 3rd to 1st century B.C. NAA and XRF were used in the analysis. To determine the oxidation state of iron, Mossbauer spectroscopy was used. The authors159establish clear chronological order in the development of Celtic technology for production of colored glass. All these examples indicate that NAA may provide useful information about glass production, which allows conclusions not only about the technological level but about the sources of raw materials as well. The study of ancient glass additionally permits the evaluation of long-termed physical andlor chemical influence on the quality of glass. Such investigations recommended by one of the pioneers in glass research, Be~borodov,'~'may lead to better understanding of the glass structure and the mechanism of some processes. An example in this respect is the work of Nauer et a1.170 where NAA has been used in combination with microscopic investigations of Roman and medieval glasses from Austria. The aim of the study is to discover the dependence of corrosion on the chemical composition of glass. The question is of vital importance for the solution of the problems concerning the reliable isolation and long-term conservation of radioactive wastes. The authors170 found that sodium glass is more resistant to weathering processes than potassium glass. The same result is reported about medieval glass from York.lS7
IV. ACTIVATION ANALYSIS OF NATURAL GLASS Long before starting to produce artificial glass, man discovered natural glass (obsidian and tektites) and used it for the points of arrows and the eyes of his gods. Tektites were discovered first in Czechoslovakia and after that in Oceanea, Australia, Southeast Asia, North Africa, and along the Eastern coast of North America (see e.g., Reference 153). This is natural, low-alkaline glass with high Fe and low Ca and Mg concentration. The major difference between tektites and other natural and artifical glasses is the low water content (10 to 100 times lower than in obsidian) and that even traces of crystallization are not observed. Man has never been able to produce such glass and perhaps this is the reason that for a long time tektites were considered to have extraterrestrial origin. According to recent concepts, tektites have appeared as a result of a clash between meteorites and certain types of earth rocks. Obsidian is another type of natural glass. It is actually alkali-alumosilicate volcanic glass, formed during the quick cooling of the Si0,-rich lava. Obsidian is isotropic, semitransparent, including different minerals and traces of crystallization. for the brisk trade with obsidian in ancient times. sometimes the goods crossed enormous
Volume 11
453
distances. Archaeologists are extremely interested in the routes of obsidian trade. Thus the characterization of obsidian findings may help the reconstruction of connections between different settlements and regions. The comparison of the chemical composition of findings with the composition of natural obsidian sources may lead to solution of the basic provenance question and thus to the solution of many archaeological problems.
A ANALYSIS The archaeometric investigations of obsidian have been done by mainly using NAA and XRF. The activation methods presented in Table 7 and used in the analysis of tektites and obsidian cover practically all known papers for the last 10 to 15 years. The review indicates that INAA is the most widely used method.59~'88-193~195~196~198,'w The possibilities of gammaactivation analysis have been evaluated'85 and for the determination of such elements as B, H, Si, Ti, etc. (see Table 7), NAA with fast neutrons and prompt-gamma measurement has been used. 19" Among the most frequently determined elements are Ce, Cs, Eu, Fe, La, Mn, Na, Rb, Sc, Sm, Yb, as well as Ba, Ca, Co, Cr, Hf, K, Sb, Ta, Tb, and U. In a limited number of papers, the determination of Al, As, B, Dy, Gd, Lu, Nd, Si, Sr, Tb, Ti, etc. is discussed. Generally these are elements which are determined in magmatic rocks (granite, basalt) by NAA (see e.g., References 5, 200, 201) and this is very natural since obsidian is chemically very similar to these types of rocks. There are of course some specific features. One of them is that the ratio of AVNa in tektites is such that A1 may be a source of error in the determination of Na due to the nuclear Reaction 9:
In some cases. this error may reach up to 2%. Thanks to the higher Na content in obsidian the contribution of Reaction 9 may be neglected. The most serious problem arises in the determination of Cr in obsidians, due to the interference from the nuclear reaction:
and the overlapping of the only "Cr gamma line (320.1 keV) with the gamma lines of '47Nd (3 19.4 keV) and of L 7 7 L(32 ~ 1.4 keV). Our evaluation made on the basis of the normal content of Cr, Lu, Nd, and Fe in obsidian, shows that the error in Cr determination due to Reaction 10 is between 4 and 10%. The overlapping with ' 7 7 Lmay ~ introduce up to 18%, while the '47Ndleads to even 100% error, when the measurement is performed on the 28th day after irradiation. Since both ' 7 7 L ~ and '47Ndhave shorter half-lives than SICr,a longer cooling time of about 60 d may eliminate the influence of ' 7 7 L ~ and reduce the influence of '47Nd to less than 15%. Perhaps these were the motives of Osawa et al.'" and Vogt et a1.19'j in proposing 60- and 160-d cooling times in their INAA schemes (see Table 7). These evaluations are in good agreement with the ones made by Perlmanm who adds one more possible source of error in the determination of Cr - the influence of the pairpeak of '82Ta(321 keV), which he evaluates to be 17%. All these possible interferences are very difficult to be strictly evaluated and make the NAA determination of Cr in obsidian very unreliable. This conclusion gives Perlmanm sufficient ground to recommend the data for Cr not to be used in provenance study of obsidian. In some cases, the precision in the determination of Cs, Ni, Sb, and Sr in obsidians and tektites is not good enough after pile irradiation. This may be explained by the fact that often the concentration of these elements is about the detection limit (Ni in obsidian is
TABLE 7 Activation Analysis of Natural Glass (Obsidians, Tektites) No.
Author(s)
1. Kuncir et al. (197O)lB8 INAA (8) sample (150-300 mg) 2. Gordus et al. (1971)IB9 INAA (14) sample (20 mg) 3. Aspinall et al. (1972)L42 INAA (15) sample (120-2700 mg) 4. Osawa et al. (1976)190 INAA (21) sample (20-50 mg) 5. Burger and Asaro (1977)19' INAA (17) sample (?) 6. Randa et al. (1979)lY2 INAA (12) sample (?) 7. Filippakis et al. (1980)'93 INAA (17) sample (80 mg)
Irradiation N, (1
X
1012)
N, (1 x 10¹²) N, (2 X 10")
t,
tc
t~
Determined elements
Standard
Object
Pure salts
Tektites (Moldavite); Various SRMs
Pure oxides
American obsidians
4d 21 d
Pure salts
Obsidian from Aegean islands and Anatolia
2 min 2-3 h 7d 30-60 d
SRM: JB-1; JG-I
Ancient Japanese obsidian artifacts
20 h
49 d
1 min 24 h
?
100 min
1200 s
Co,Cr,Cs,Eu,Hf,Rb,Sc,Th
?
N, (5 x loll)
2 min 30 h
N, (1.7 X 10¹²) 6 min 8h N,(2 x 10")
N, (2
X
N, (2.2
10")
X
2 min
10") 45 min
8 min 8d 21 d
Obsidian from Peru and Bolivia
15 min
Tektites from Czechoslovakia
6d 21 d
P&A standard Pottery
Obsidian from Kitsos (Greece)
8.
Ahmad et al. (1981)195 INAA (33) sample (200 mg)
N, (2
X
1013)
2 min lh
Ih 2h 2d
NBS-SRM-278, other SRMs 3600s 3600 s 3600s
Ca Ba,Cr,Fe,Nd,Rb,Sc,Yb
Ba,Ce,Co,Cs,Eu,Gd,Hf,Hg,In,Lu,Rb,Sb,
300 s 1000 s 3000s
AI,Ba,Fe,K,Mn,Na,Rb,Sc,Sr,Zr Ba,Ca,Cs,K,Mn,Na,Rb,Sc,Sr,Th,Zr Ca,Ce,Cs,Mn,Na,Nb,Rb,Sc,Y,Zr
Lab. standard Mol- Tektites (Bohemia) davites (CSSR)
? ? ?
Al,Mn,Si,Ti La,Na,Rb,U
USGS: BCR-1; G-2 Mesoamerican obsidians
Se,Ta,Tb,Th,Yb 9.
Randa et al. (1981)185 GAA (16) sample (50-100 mg) 10. Vogt et al. (1982)IM PGAA(9) INAA(25) sample (200-300 mg)
G (microtron)
170 min 44 min 19 h 17.9 d
?
11. Blackman (1984)59 INAA (27) sample (100 mg) 12. Boden and Richter (1984)19' INAA ( 18) sample (100 mg) 13. Bigazzi et al. (1986)16' INAA (19) sample (300 mg) 14. Boksenbaum (1987)Iw INAA (23) sample (?)
Ce,Co,Cr,Cs,Eu,Fe,Ni,Sb,Sc,Sr,Ta,Tb, Th,Yb,Zn W Ba,La,Na,Sm,U
2000 s NBS-SRM-278 10000 s Ce,Co,Cs,Eu,Fe,Hf,Rb,Sb,Sc,Ta,Tb,Th,Zn,Zr 7200 s As,Ba,Br,Ca,K,La,Lu,Na,Nd,Sb,Sm,U,Yb NBS-SRM-1633 14400 s Ba,Ce,Co,Cr,Cs,Eu,Fe,Gd,Hf,Nd,Rb,Sb,Sc, Ta,Tb,Th,Yb,Zn ? Cu,K,Na,Mn,Si ? Gd,La,Nd,Sc,Sm,U,Yb ? ? Ce,Cr,Eu,Fe,Hf,Th ? '? ?
2000 s
(Dy),La,Lu,Sm,U Ce,Nd,Rb,Th,Yb
USGS: BCR-I Pure salts
Cs,Eu,Fe,Gd,Ho,Sc,Ta,Tb,Tm
Ba,Ce,Co,Cr,Cs,Eu,Fe,Gd,Hf,La,Lu,Nd,Os, Obsidian in house Rb,Sc,Se,Ta,Tb,Th,Tm,Yb,Zn,Zr standard
Mesoamerican obsidians Obsidian from Iran
Libyan desert glass
NBS-SRM-278 Obsidian artifacts and sources in Italy Obsidian sources and artifacts from Mexico
TABLE 7 (Continued) Activation Analysis of Natural Glass (Obsidians, Tektites) No.
Author@)
15. Al-Jobori et al. (1987)216 INAA (5) sample (?)
Irradiation
N,, (108)
t. 5min 15 min
k 15min 36 min
tr.4
600s 7500 s
Determined elements Si AI,Fe,Ti,Zr
Standard NBS-SRM-97a
Object NBS-SRh4-69a NBS-SRM-12% Glass sand (Iraq)
Volume 11
457
usually below the detection limit, but in tektites is higher and may be used as discriminating element in their study). A possibility to increase the sensitivity in the determination of these elements, and in this way, the precision of the analysis, is to irradiate the samples with epithermal neutrons (e.g., Reference 200). Additionally, the epithermal irradiation will increase the precision of the analysis in respect to Rb, Ta, Tb, and U and, in this way, the list of determined elements by INAA and XRF will be equalized. This result is important because it allows comparison of the results between the two methods and in this way increases the reliability of the localization studies. Such an approach has not been used in obsidian studies yet. It, however, allows the determination of several "discriminative" elements. The basis for such an assumption is the results of P e r l ~ n a nabout ~ ~ three obsidian sources in Anatolia. For their discrimination, a precision better than 2 to 3% was necessary. Besides, Stross et a1.202 demonstrated the possibility for discrimination of obsidian sources in Central America, Mexico, California, Bolivia, and Peru, on the basis of the content of Rb, Sr, and Mn or Rb, Sr, and Zr. Of course it is not often that two or three elements are enough to differentiate investigated findings and to discover their origin. Yellin and Perlman220investigated the distribution of rare earth elements in seven obsidian sources in Turkey and discriminated them on the basis of their Ce, Eu, La, Lu, Nd, Sm, Yb content. (Tb has been also determined but was not used due to the low precision 33%. For all other elements the precision is between 0.6 to 5.5%.) So discriminative elements in Anatolian obsidian sources turned out to be the rare earth elements, while in Central American obsidians - Rb, Sr, Mn, and Zr. This demonstrates the necessity of determining a larger number of elements in the investigated obsidian samples since it cannot be postulated a priori which elements will be important in the provenance study. The idea of Yellin and Perlman,220however, deserves attention since it is based on the well-known behavior of rare earths in the volcanic processes. It should be checked by analysis of more obsidian sources all over the world. Certainly the successful solution of the problems depends very much on the standard used in the analysis. Usually in the analysis of obsidian which is chemically similar to magmatic rock, different geological reference materials have been used, such as USGS: BCR-1, G-2; JB- 1, JG-1; etc.). This approach demands, however, the simultaneous use of two types of standards, basalt and granite, due to some discrepancies in the composition of obsidian and the two types of rocks, respectively. The review of the methods presented in Table 7 indicates that the problem with the standards in the analysis of natural glass has not been successfully solved yet. A great variety of materials is used which hinders the comparison of results between different laboratories. A possible outcome of the situation is the NBS-SRM-278 (obsidian) which may be used as intercomparison standard as has already been done in Reference 198.
B. APPLICATION The interest towards obsidian findings and their localization is enormous. Almost all known obsidian sources have been investigated by using mainly NAA and XRF. (The investigations of obsidian from Oceania and Australia have been done mainly by PIXE,205.206 but NAA has also been used.207,208.245 One of the major motives in these investigations is to determine the "chemical profile" of the obsidian beds and to find out the discriminative elements between them. By using NAA, the greater part of the obsidian sources in Mexico,'91~1"~1w~202.209 Belize,191,203.210 HonduraS,l%.mGua~ema~a,l%.199.~03.218S&ador,202 Peru and Bolivia,191 the U.S.189.202.204.211.222 and CanadaIs9 have been studied. Not so thoroughly but still well-enough investigated are ~ ~ the . ' ~ Near * East, and some obsidian sources in the Aegean r e g i ~ n , ' ~ ~ . ' in ~nato~ia42.142,189.220.297-299.319 a well as in the Miale East,59.189 Japm,140 Sou& Fmce,212.213 and Greenland.245
458
Activation Analysis
The results from these numerous investigations proved that usually the material from one source is very h o m o g e n e ~ u s ' ~ ~ and . ~the ~ , differences ~'~ in the content of many elements between the sources are very small. Thus to detect the origin of obsidian findings, the number of many elements should be determined with high precision. So the use of NAA guarantees to a great extent the success of the study. Additionally, the results from the investigations established high linear correlation between certain elements, e.g., in the obsidians from north California, correlation between FeISc, FeICo, FeICs, etc.'" This fact presents special requirements towards the programs for cluster analysis used in the classification of the investigated findings. The influence of the correlated elements should be eliminated, otherwise the classification based on Euclidean distances will not be correct (see e.g., Reference 4). An alternative is to make a classification based on Mahalanobis distance. Tektites are not as well investigated. Usually papers report results from the investigations on the origin and the geochemical characterization of tektites (e.g., References 110, 214, 219, and 343). Of course these are important questions in an archaeometric study and that is why we would like to mention the study of Czechoslovakian tektites in which NAA has been used~185,188,192.214,215 Certain methodological interest is represented by the investigation of desert glass from Libya.'97 In this study, a very interesting method - neutron activation autography - has been used (see Reference 217). This useful method still has not found wide application in archaeometric studies. It enables the determination of the distribution of different macroand microcomponents in the investigated findings. NAA with fast neutrons has also been used in the study of desert glass.216
V. ACTIVATION ANALYSIS OF ROCKS Depending on the environmental conditions and the level of its development, each social structure has used different magmatic (granite, basalt, etc.), sediment (limestone, sandstone, etc.), and metamorphic (marble) rocks as building materials. Today the study of ancient cultures is interested in the place where the building materials have come from. Until recently, this evaluation has been done on the basis of geological criteria (mineralogical composition) which, however, cannot give a definite answer to the question. Much easier is the solution of this problem when the chemical composition of the materials is determined. Especially interesting is the information about the microelemental composition. Information about the possibilities of activation analysis in geochemistry and geology is included in the other chapters of this book as well as in many papers (e.g., References 5, 200, 201, 221). That is why Table 8 includes only some activation analysis investigations of marbles,223,225.232.233 ~ t e a t i t e , 2 ~ flint,226 ~ , ~ ~ and ~ . ~l i~r ~n .e ~s t~~~n ewhich ~ ~ ~ ,are ~ ~related ~ to archaeometric studies.
A. MARBLE AND LIMESTONE Limestone and marble are actually CaCO, and the difference between them is that marble is metamorphically transformed limestone. This transformation means that the heterogeneous porous sedimentary rock has turned to homogeneous, monomineral rock. The most successful localization is performed by determination of the ratio 13C/12Cto 180/160,but in many cases, the discrimination of different marble sources on the basis of isotope ratio is not possible (see Reference 2). In such cases, the information about the impurities and trace elements may help in the solution of the problem. There are some papers reporting results about the successful localization of marble223,225,232,233and l i m e s t ~ n on e ~the~ basis ~ ~ ~of~their ~ chemical composition determined by NAA.
TABLE 8 Activation Analysis of Rock Materials (Marble, Steatite, Flint) No. 1.
2.
Author(s)
Rybach and Nissen N, (3.6 ( 1964)223 INAA (2) sample (300 mg) N, (5.1 Braetter et al. ( 1970)224 lNAA (20) sample (500-1000 mg)
RNAA (1) Draskovic and Draskovic (1970)225 INAA(3) sample (200 mg) 4. de Bruin et al. (1972)226 INAA (21) sample (20 mg) 5. Allen et al. (1975)227 INAA (23) sample (600 mg) 6. Bard et al. (1976)228 INAA (12) sample (100 mg) 3.
Irradiation X
t,
lo1') 30 h
t~
tc
10 h
60 s
Determined elements
Standard Pure salts
Object Ancient Greek sculptures Marble quarries in Aegean region Dolostone and limestone Tyrol (Austria)
10") 10 min 1-2 min 2h Ih 36h U d 14--20 d 30 d 90 d N,(3.2 X 10") 3 6 h 3-5d N, (4 X loL2) 4 d ?
? ? ? ? ? ? ? 3600 s
N, (7
? ? ?
CaCO, plus known Flint material from amounts of eleNetherlands, Denments mark and France
? ? ? ?
USGS: BCR-1 Pure salts of REE
X
X
1012)
N, (5 x 10")
15 min 5 h 24h 5d 21 d l min l h
N, (1.7 x 10") 5 min
N, (2
X
loL3) 8 h
1-3d 5-10d 30 d 8 min 1h 1l d 21 d
?
Au-foil as monitor
60 s 360 s 1200 s 9000 s 5400 s
P&A standard pottery
Marble from various deposits in Yugoslavia
Prehistoric steatite artifacts and sources from eastem USA Desert varnish from Grimes point petrogliph site (Nevada, U.S.)
TABLE 8 (Continued) Activation Analysis of Rock Materials (Marble, Steatite, Flint) No.
Author(s)
Allen and Pennel (1978)229 INAA (22) sample (250--600 mg) 8. Ohde et al. (1978)2M INAA (18) sample (200-500 mg) 9. Oddone et al. (1985)232 INAA (21) sample (20 mg)
Irradiation
t,
k
7.
Tb,'h,Yb
N, (5
X
10")
15 s 3min
N, (1.5 x 10¹²) 60 h
11. Moffat and Buttler ( 1986)234 RNAA (14) sample (500 mg)
20-25 s 15 s 30-120 600s min 7d 3000 s
48 h 300 s 1 G 1 2 d 3000 s Reirrad.
30 s 90s
Note: PIPGR
=
Standard
Ba,Co,Cr,Fe,La,Lu,Na,Sc,Sm,U,Yb USGS:BCR-1 Ba,Ce,Co,Cr,Eu,Fe,Gd,Hf,Nd,Ni,Sc,Se, soapstone home-
10 Genova et al. (1986)233 INAA (18) sample (500 mg)
12. Brissaud et al. ( 1986)277 PIPGR (4) sample (100 mg)
Determined elements
f~
P(Ep 1.8 MeV) 20 min -
200s 1200 s
standard
Object Soapstone artifacts and quarries eastem U.S.A.
USGS: G-2, W-1 plus pure salts
Limestone and dolostone (Japan), coral (Pacific)
Mn,U Ba,Ca,La,Lu,Sm Ce,Co,Cr,Cs,Eu, Fe,Gd,Hf,Ho,Rb, Sb,Th,Tm,Yb
Pure CaCO, plus known amounts of elements
U
USGS: BCR-1; G-l
Italian marble quarries. Facade of the cathedral of Como (Italy) USGS: BCR-I; G-1 Italian marble quarries Roman monuments
La,Lu,Sm Ba,Ce,Co,Cr,Eu, Gd,Hf,Ho,Rb, Sb,Sc,Th,Tm,Yb Er,Eu,Gd,Ho,La, Pr,Sm Er,Eu,Gd,Ho,La, Lu,Pr,Sm,Yb La,Lu,Sm,Tb,Tm,Yb Dy(La for chemical yield) Al,Li,Mg,Na
Proton induced prcxnpt gamma-rays. For other abbreviations see Table 1
Pure salts
Sources of steatite in Shetland
Geological SRMs
Lava from some volcanos
Volume 11
461
Generally the problems in the analysis of marbles and limestone arise from the relatively lower concentrations of many elements in comparison to magmatic rocks. Perhaps this is the motive that explains the relatively longer irradiation periods (2.5 to 4 d) proposed by some scientists (see Table 8) and the bigger quantities used in the analysis (500 mg230,233 to 1 gZZ4). In our opinion, one of the difficulties in the analysis of marble and limestone comes from the large variation of certain elements in samples from different sources. Thus it is not very easy to choose an appropriate standard for analysis. Most of the scientists use basalt, USGS BCR-1;233 geological SRM magmatic rocks (granites, USGS G-1, G-2;230,233 diabase, USGS W-1 ;230granodiorite, USGS GSP-1235),although the concentration of certain elements in magmatic and sedimentary rocks is very different. That is why at present it is perhaps better to prepare primary standards by pipetting aliquots of standard solutions onto high purity CaCO, as in References 223 and 232. The idea to classify the marbles from different regions on the basis of their chemical composition started with the work of Rybach and NissenZz3who determined Mn and Na in numerous samples from the Aegean region - continental Greece, the Greek islands, and Asia Minor. Using also a small number of elements, Cu, Mn, and Na (Mn and Na again), ~~~ by absolute activation analysis and discriminated Draskovic and D r a ~ k o v i cinvestigated several marble sources in Yugoslavia. One of the "achievements" of modem society is the erosion of marble and limestone monuments due to the increased atmospheric content of such aggressive agents as SO,, NO,, etc. (see e.g., Reference 236). In many cases, the restoration of such monuments demands knowledge about the place where the material has come from. Oddone et aLZ3' report that such a necessity has arisen during the restoration of the cathedral in Como (Italy), and they determined the content of 22 elements in samples from the biggest marble quarry in Italy. The results from cluster and discriminant analysis indicate that in such localization studies, one should consider the changes of the material due to weathering processes. The same marble quarry has been investigated by Genova et a1.233who tried to find the origin of some Roman monuments in the museum in Como (Italy). The solution was reached after interpretation of the results by cluster and discriminant analysis. G r i m a n i ~investigated ~~~ the limestone head of Pan, excavated in the Athenean Acropolis and nowadays kept in the Museum of Art, Cleveland, OH. The finding is dated 5th century B.C. and it is presumed to be part of the monument of Miltiades, made in honor of the Marathon fight.237The study of Grimanis aims the localization of the material used for the head. Sample from the finding together with two limestone samples from other sculptures in the Acropolis have been investigated by INAA. In Figure 6 are presented the analytical data of Grimanis after suitable interpretation by us. It does not only visualize the results, but it is also an example of how to solve the question about identity of samples using simple statistical criteria. This approach has already been used by us (e.g., References 165 and 180) and Widemann and co-workers"' even gave suitable limits for its a p p l i c a t i ~ n . ~ ~ . ~ ~ It may be very easily detected that Pan's head is very different from the other two sculptures (AM-57, AM-8 114) which invalidates the attractive hypothesis of Robinson.237 This result Grimanis supports with data from thermoluminescent analysis, stable isotope ratios, macropaleontological investigations, and electron microscope pictures.
B. STEATITE Steatite is very easily cut material having the more popular name soapstone. It is hydrated magnesium silicate material, the main constituent of which is tal~/Mg,Si,0~O(OH)~. Its pleasant color, the possibility for easy treatment and polishing have attracted the attention of man since ancient times. Findings made of steatite have been dated back to 3000 years B ,C.229.238
462
Activation Analysis
1
As Ce Cr Cs La Lu Na Sc SmTh Yb U Zn
FIGURE 6 . Comparison of the chemical content of limestone monuments AM-8114) and Pan's head.235 from the Athenian Acropolis Museum (AM-57, C,,JC, = Ratio of the concentration of each element in the sculpture (C,) and in Pan's head (C,). Dotted lines parallel to the line at value 1 point the 20- interval.
The possibility to localize steatite findings on the basis of their chemical composition was discussed by Allen et al.227,2299231,239 The problems in the analysis of steatite arise from its indefinite composition which leads to enormous differences in the content of some elements in the samples from different steatite sources. Thus, for example, Cr content varies within three orders of magnitude; Co, Mn, and Sc, about 2.5 orders, etc.238This fact is a serious handicap in the choice of a suitable standard for analysis. The methods used for NAA of steatite227.229.231.234 are obviously aimed at the determination of rare earths and enable the determination of 7 to 9 elements. The neutron activation radiochemical method of Moffat and B ~ t l e 2(see ~ ~also Reference 240) permits the determination of all the 14 rare earth elements. The interest in rare earths is based on the results of Allen and c o - ~ o r k e r s ~ who, ~~,~~~.~~' on the basis of the content of rare earths, discriminated several steatite sources in the eastern part of the U.S. The attempt to use the same approach for steatite in southwest Asia238and in the Shetland Isles,234however, was unsuccessful. Many difficulties have been observed in the investigation of steatite findings from Iran. For this purpose, Harbottle and c o - w o r k e r ~used ~ ~ ~an impressive number of methods: NAA, X-ray diffraction, Mossbauer spectroscopy, AAS, XRF, petrographic analysis, and succeeded in discriminating several groups of steatite. This result indicates the interdisciplinary nature of archaeometry where there is a collaboration between all modem analytical methods and the methods of the natural sciences like geochemistry and mineralogy. C. FLINT Flint is perhaps the material that has played the most important role in mankind's history. It has been used as a basic material for the production of tools in a long period of human history - the stone age and later to build a fire. These are the main reasons for the archaeological interest in the provenance study of flint artifacts. For the solution of this interesting and yet not satisfactorily solved problem, INAA has been used, too.226,245-248
Volume I1
463
Flint represents hydrated SiO, including Ca, Fe, and Mn impurities. It is a very convenient matrix for INAA, since Si is poorly activated and hinders the determination only of A1 and Mg (see Section 11). That is why theoretically one cannot expect very serious problems for the INAA determination of many elements in flint material. The problems arise, however, from the great inhomogeneity of the material. De Bruin et a1.226.245 investigated the variation in the analytical data from the analysis of ten separate samples from one flint artifact and the results are very di~turbing."~The content of La is reported to vary between values below detection limit (in our evaluation about 1 ppb) and 2.4 ppm which is more than three orders of magnitude. The values for Cr, Fe, and Sm vary about three times, etc. Similar observations are reported by Aspinall et a1.246-248 and Craddock et a1.249So it may be stated that although analytical problems do not exist, the reliable localization of flint artifacts on the basis of their chemical composition is not possible at present. The number of investigated artifacts from different regions should be increased and more elements should be determined before reaching a final conclusion on this point.
D. OTHER MATERIALS The rocks in the desert regions of the southwestern U.S., some parts of Europe, Africa, and Australia are covered with brown to black varnish. The idea to investigate this weathering product is connected with the presumption that if one determines the rate with which the varnish covers the rock, it will be possible to develop a method for dating prehistoric stone drawings and monuments. The investigations of Bard et al.228.250 on rocks from Nevada indicate that INAA is a convenient method for such investigations and the upper layer of varnish is enriched in W, As, Sb, Th, U, etc. which may serve as information about its age. The investigation of the petroglyphs from Grimes Point in the Western Great Basin proves the possibility for dating by this method. Of course there are a lot of other problems (climatic variations, the mechanism of varnish formation, etc.) which remain to be investigated before this approach is to be used for dating. When excavations in volcanic regions are performed, often separate findings covered by volcanic rocks are discovered. If it is possible to identify which of the flows has caused the destruction, this will enable the exact dating of the event. Having in mind this idea, Perlman et al.25' investigated basalt flows in the region of Berekhat Ram (North Golan). Using INAA, they determined the chemical composition of the flows and indicated that they can be stratigraphically discriminated on the basis of their composition. This approach is very successful when morphostratigraphic conclusions are not definite.
VI. ACTIVATION ANALYSIS OF BONES Bones are material built of organic substances (collagen, lipids, etc.) and a mineral phase (hydroxiapatite). Trace elements in bones may be associated with both organic and inorganic phases. Since hydroxiapatite has a definite chemical composition, Ca,,(PO,),(OH),, one can expect an approximate ratio Ca:P around 2.16 The difference between contemporary and archaeological bones arises from the so-called diagenetic effects - the addition or removal of trace elements by soil or ground water. About 25 elements have been identified as having been introduced into archaeological bones as a result of environmental influence.252 The investigations of archaeological bones nowadays may lead to interesting conclusion about health and diet of ancient people. The results, however, may be used reliably only after investigation of the local diagenetic effects and comparison with results of modem bones so that in the evaluation only elements not influenced by diagenesis to be used. Usually to establish the dietary habits of ancient people, the content of Sr, Zn, Cu, Fe,
464
Activation Analysis
Al, Mn, K, and Na should be determined. The differences in the concentrations between men and women, adults and children, peasants and hunters, etc. may lead to certain conclusions about the habits of different population groups. For example, a relatively high Sr content in bones indicates a plant-based diet. Similar is the meaning of high levels of V and Mn, whereas elevated Zn and Cu levels point to meat consumption. Elevated concentrations of As, Sb, Hg, and Cd may indicate the cause of death or, compared to present data, may lead to certain evaluation of environmental pollution. The Ca to P content may be used to separate bones from diagenetically influenced archaeological materials. The content of U, F, and N may be successfully used for establishing whether a particular bone is contemporaneous with other bones found in the same deposit. Although this technique does not provide absolute dates, it may be used for bones of far greater age than those dated by the radiocarbon method. The idea of the method is that the phosphatic mineral of bone is altered during burial through substitution of F and U for the hydroxil and Ca ions, respectively. Thus the F and U contents increase with time. The rate of accumulation depends on the hydrological conditions and the burial medium. In this way the depletion of N and accumulation of F and U offers a possibility for relative estimation of age.'s2 In spite of the high sensitivity and wide use in the analysis of modem biological materials, activation methods do not appear to have been used in the analysis of fossil bones (Table 9). The list of elements usually considered interesting for the study of ancient bones contains only one element (Pb) which is extremely problematic for activation determination. The possibilities offered by activation methods in the analysis of biological materials are discussed in the chapter "Activation Analysis of Biological Materials" (Chapter 7) of this volume. Normally, fossil bones have elevated concentrations of trace elements in comparison to modern ones, which makes their analysis easier from a sensitivity standpoint. Especially drastic is the elevation in U content reaching up to 460 ppm.257 In Table 9, the methods used especially in the analysis of fossil bones are presented. In most cases, pile irradiation of the samples is performed.252.253p255-257.259 For the deterrniand epitherma135p259 nation of specific elements like N and P, activation with 14-MeVB4.258 neutrons is performed. The number of determined elements varies between 135,253.254*257 and 17.252Some scientists35.252.253.258 discuss the problem with the determination of P which may be interfered by A1 and Si from Reactions 4 and 5, re~pectively.~~' The problem with standards in the analysis of fossil bones is rather complicated. The available biological reference materials differ very much from archaeological bones, especially in respect to some elements like U, Sc, Co, etc. A little unexpected seems the decision of some scientists to use geological SRMs as standards. At present, however, it is rather difficult to recommend a suitable SRM. It seems really that self-made primary standards are the best outcome for the moment. The problem of fossilization of bones which involves not only degradation of organic substances but exchange with inorganic substance with the environment have been investigated in several papers by using INAA.252,256,259 Badone and FarquhaP2 identify a variety of elements which have entered bone from the environment. They defined several correlations among elements as well as correlation between surface color and the concentration of some elements (Mn, Fe, Ba, F, etc.). These correlations lead to certain conclusions about the conditions some of the bones have been exposed to after burial. Hancock et al.259investigated the analytical reliability of INAA of regular and defatted modem bone and compared the results with analytical data for bones from Egyptian mummies and normally buried 1 lth century French bones. The conclusions are that the "clean" Egyptian mummy bones are very similar to modem ones. The results for buried "dirty" bones indicate that the content of some trace elements is significantly elevated even in dry and clean burial environment. Of the nine trace elements, all except Sr have shown diagenetic
TABLE 9 Activation Analysis of Archaeological Bones Nr. 1.
2.
3.
4.
5.
6.
7.
Author@)
Irradiation
Blotcky et al. N, (3.1 X 10") (1978)253 NAA (CI)(l) sample (500 mg) Wessen et al. N, (6 x 10¹²) (1978)2" INAA (3) sample (10-20 mg) Badone and Far- N, (1 X 10") quhar (1982)252 INAA (17) N, (2.5 X 10") sample (50-300 mg) Cesana and Terani N,,, (1.2 X 10") ( 1 984)" INAA (1) sample (300 mg) Edward et al. N, (1 X 10¹²) ( 1984)256 INAA (1 1) sample (2-250 mg) Hashimoto et al. N, (7 X 10") (1985)25' INAA (1) sample (1200 mg) Ilkov (1984)258 N,, (?) INAA (2) sample (?)
tc
t~ 5 min
?
10 min
10 m 12 min
t~ ?
Standard
Determined elements Al
Object
?
Various bone samples
Pure salts
Deer bones
Fossil bones Yukon (Canada)
?
10 s 6 min 16 h
?
I min
1 min
6h
3d 42 d
30 s
4-11
20 min
20 rnin 40 min
?
USGS: BCR-1 Human bones PeloCaCO, plus pure ponnes (Greece) salts 111-11 century B.C. d
Pitchblend
Ratio 214Bi/23RU in fossil bones (Bolivia)
Celoloid (N) Teflonm (F)
Human bones
TABLE 9 (Continued) Activation Analysis of Archaeological Bones Nr. 8.
Author@)
Irradiation
Hancock et al. (1987)259 INAA (13) sample (1mg)
N, (1 x 10")
1-3
N,, (1 X 10") N, (1 X 10¹²)
1-3 min l min
Note: CI
=
t~ min
tc 1-20 ? I h
t~ min? ? ?
Determined elements
Standard
Ba,Br,Ca,Cl,Dy,Mg,Mn,Na,P,Sr,Ti,U,V P Ba,Dy,Mn,Na,Sr
irradiation after chemical isolation; see previous tables for explanation of abbreviations.
Object Modem, medieval and mummy human bones
Volume 11
467
effects in soil-buried bones. The authors259have serious doubts on the usefulness of all trace elements in archaeological bone, and eventually recommend the use of stable isotope analysis in the study of dietary status of prehistoric man. As a result of the investigation of 40 bone samples from Hellenistic nekropolis of Asine (Greece), Edward et aLZ5'jreached the conclusion that the elevated concentration of Br, U, Sc, Cr, Fe, Co, and Ba is a result of the contamination from the soil. Ribs were much more contaminated than femurs. The authors reveal a very interesting dependence between the ratio SrlZn and the increase in the consumption of red meat and coarse unleavened bread during the late Hellenistic period. A possibility to date archaeological bones is discussed in Reference 257. The content of 238Uis determined by NAA and age determination is performed on the basis of the ratio 214Bi/238U In References 254 and 258, the content of N and F, determined after activation with 14-MeV neutrons is used for age determination of relatively young bones (1000- to 2000years-old). The result indicates that there is not a strict correlation between N content and age for this time interval. The results, however, may be successfully used in paleoclimatology since a dependence has been detected between N content and the temperature during fossilization. At the end, an attractive application of NAA to archaeological bones may be mentioned. In 1945, the skeleton of an early Homo sapiens from Comb Capelle (Berlin) was destroyed by bombs. An attempt was made by means of INAA to find among the remains the bones belonging to Comb Capelle man.260
VII. ACTIVATION ANALYSIS OF ANCIENT METALS The beginning of archaeometric investigations was 200 years ago when the German chemist Heinrich Klaproth analyzed metal objects.263Since that time, a lot of metal artifacts have been investigated with the aim of answering one of the following questions: What were the ore deposits used for the production of the metal? What technology has been used for metal production and how it developed? Where is the place of production of the metal artifact? Obviously a pure archaeological investigation cannot solve all these problems. The investigated metal object is the final product of many processes starting with the discovery of the ore deposit, ore processing, production of the metal, use of the metal object, and finally its underground storage which has brought many changes. It is quite clear that the answers to the above questions demand investigations, not only of the iron objects but of One of the the ore and the slag too. Nowadays this is the field of Montanarchae~rnetry.~~ numerous methods in this research is activation analysis. Although a total archaeological investigation is not possible without the analysis of the ores and slag, here we discuss only the application of activation analysis to metal artifacts. (The classical chemical methods are described by one of the pioneers in this research, Caley .269 Many examples for the application of other methods may be found in References 1 and 2. The possibilities of GAA for analysis of different minerals and ores are demonstrated in the work of Randa et a1.,Ia5and in Reference 192, some information about the NAA of ores with short-lived isotopes is given.) The activation methods used in the analysis of ancient metals are presented in Table 10. Practically all activation techniques have been used:
TABLE 10 Activation Analysis of Metals and Alloys Nr.
Author(s)
1. Thompson and Lutz (1972)327 INAA (3) RNAA (6) sample (10 mg) RGAA(6) sample (10-20 mg) 2. Barrandon et al. (1973)265 PAA (30) sample (?) 3. capp&o et al. (1973)'% INAA (3) sample (w.o.) 4. Gordus (1973)275 INAA (5) sample (?) 5. Heurtebise et al. ( 1973)267 INAA (3) sample (30 mg) 6. Meyers et al. (1973)268 INAA (3) sample (0.2-1 mg) sample (0.2-4.5 mg) RNAA (13)
Irradiation
t,,
Nr (6 x 10")
2s lh
G (LINAC)
Ih
P (5= 11 MeV)
Ih
N,,(3.3
N, (1.8
X
X
lo3) 10min 1 min 24h l h 5d 2d
IOl4) 30 min 3 h 16 h
t~
Determined elements
Standard
Object
Pure metals
Chinese bronze artifacts
Pure metals
In pure metals (Ag,AI,Co)
Pure metals
Roman and Greek Etruskian coins
Pure metals
Sasanian coins
Absolute method Pure metals
Modem gold alloys
Pure metals
Sasanian silver objects
7.
8.
9.
Wyttenbach and N, (1 X loL3) 5 h Schubiger (1973)270 INAA (6) sample (200 mg) Gilmore (1977)278 N,, 90 s INAA (9) (1.2 x 10¹¹) 7 h sample (1-5 mg)
Jordan and May N, (2 X lo1)) 100 s (1977)"9 INAA (13) sample (5000 mg) 10. Schubiger et al. N, (9 X 10¹²) 4 h ( 1977)280 INAA (3) RNAA (8) sample (7 mg) 30 s 1 I . Gilmore and Beny N,,, (loL2) (1980)281 N, (3 x 10¹²) 7 h INAA (8) sample (few mg) 12. Gilmore and Otta- N,,, (3 X 10¹²) 90 s way (1980)282 6-8 h INAA (10) sample (3 mg) 13. Siddappa et al. N ,, ? (1981)283 (0.2 TBq) INAA (1) sample (w.o.) 30 s 14. Veres & Pavlicsek G (1982)284 (740TBq"Co) 120 s GAA (1) sample (w .o.) 15. Carter et al. N, (2 x 10") 30 min (1983)286 40 h INAA (5) sample (5-84 mg) GAA (16) G (LINAC) ? sample (w.o.)
Roman lead artifacts
60 h
10 min 5d 30 d 2-3 h 28-33 h 3-4 d 23-28 d
Pure oxides and metals
?
Copper coins from 3rd to 9th century A.D; Brass from 19th century French and German instruments of the La Maire epoch
Pure metals
Greek silver coins
15 min 5d
NBS-SRM:37E, 124d Pure metals
Silver coins 19th century England
10 rnin
Pure reagents
NBS-SRM:37E, 124d Copper based artifacts Indian and U.S. and Europian silver coins
? -
5d
Absolute method
Pure metals
Gold and silver coins and medals
Roman orichalcum coins
TABLE 10 (Continued) Activation Analysis of Metals and Alloys Nr.
Author(s)
Irradiation
16. Glascock and Corn-N, (5 x lo8) man (1983)285 INAA (5) sample (?) 17. Aycik and Edgueer N, (1 x 10") (1984)"' INAA (8) sample (170-500 mg) 18. Glascock et al. N, (5 x lo8) (1984)288 INAA (4) sample (w.o.)
t,
t,
t~
2-4 h -
1h
2-8
2 - 8 h As,Au,Cu,Sb,Zn
4d 28 d
h -
19. Pemicka (1984)289 Nr INAA (9) (int. 3 x loL4) sample (40 mg) N, (int. 1 x loL6) 20. Bhoraskar et al. N,, (5 x lo8) 8 min (1985)290 INAA (5) sample (1000 mg) 21. Cojocaru et al. N, (9.5 x loL2)96 h (1985)331 INAA (12) N, (2 X 10¹²) 2 min sample (2-20 mg) N-, (lo7) 2 min 22. Cosma et al. (1985)"' INAA (1) sample (w.o.) 23. Elayi et al. N,, (10") 5 min (1985)"6 INAA (3) sample (w.o.)
2-3
Standard
Determined elements
Pure metals
Roman coins; alloys; medical instruments
NBS-SRM-365
Iron artifacts from Turkey 8%. B.C. to 20mA.D.
Pure metals
Greek and Roman coins; Greek Iranian bronzes NBS-SRM-37E NBS-SRM- 1 % ~ Copper and bronze artifacts (N.W. Anatolien)
h
21-28
d
Object
?
1 min
Pure metals and salts
6d
Monostandard (Ni) Eneolithic Cu axes (Romania)
Iron objects from Naikund and other sites in India
1h 20 s
Pure Ag
Roman and Greek coins (Romania)
3 min
Alloy Ag,Cu,Sn
Ag-Cu-Sn Gaulish coins
Rosenberg (1985)291 INAA (1) sample (w.o.) Rousset and Fedoroff (1985)292 INAA (9) sample (w.o.) Beauchesne and Barrandon (1986)294 INAA (10) sample (w.o.) Holtta and Rosenberg (1986)293 NAA(C1) (15) sample (20 mg) INAA (16) sample (20 mg)
N, (Ed = 17, 5 MeV)
Is
85 s
60 s
Ag
Pure metal
20 s
900s 1800 s 1800 s
In,Sn Ga,Mn Ag,As,Au,Cu,Sb
Pure metals; alloys
5s
30 rnin 3h 4d
15 min
18 h
?
Ag,As,Au,Cu,Fe Ni,Pb,Sb,Sn,Zn
Pure metals and salts
Copper and bronze Roman coins SRMs from bronze brass
Al,Mg,Mn,Ti,V (in eluate) Ag,As,Au,Co,lr Na,Ni,Sb,Sn,W, Zn (in resin) Cu Ag,As,Au,Co Ir,Na,Ni,Sb,Sn, W ,Zn
Pure metals and oxides
NBS-SRM:Cu I; Cu 11; Cu VII; Bronze.
?
35 h
Swedish, Russian, Finland silver coins Silverkopper coins (Venetae Tribe)
Bronze Age axes (Finland)
N,, = neutrons from 252Cf-so~r~e,N,,, = neutrons from AmIBe-source, N, = fast neutrons, PAA = activation analysis with protons, Sample (w.o.) = whole object, E, = energy of the panicles, N,, = neutrons with energy of 14 MeV, N(int n X 10") = integral neutron flux, P = proton, GAA = photoactivation analysis, NAA(C1) = NAA after chemical separation, For other abbreviations see Table 1.
472
Activation Analysis
Irradiation with neutrons from isotope sources,266,274.283 neutron generator^,^^^.^^^.^" nuclear reactor,267.268.270,275,277-282.287 Irradiation with g a r n r n a - q ~ a n t s and ~ ~ ~with . ~ ~protons265 ~ Almost
all
kinds
of
archaeological metals have been analyzed: siland copper ~loys,266,268,278,279,282,286,289.292-294 lead,270iron and ~ t e e l , ~ ~gold;267.284 ~ . ~ " and the content of macroelements, impurities, and trace elements has been determined. For provenance studies, especially important are the trace elements, while the changes in the macroelements (Ag, Au) in coins give valuable information about the economic conditions of the respective social structure.282,295,296,306,308,314 That is why some of the activation methods presented in Table 10 permit the quick and reliable determination only of macroelements in Ag and Au coins. Sometimes provenance studies of metal artifacts may not be successful in spite of the method used for analysis. The reason is that metals may be recast, mixed, etc. for the production of new objects. In such cases, even isotope methods, based on lead isotope ratio, cannot help. The problems in the analysis of metal artifacts start with the sampling. One of the reasons is that usually these are valuable objects and only an extremely small sample may be taken (some times less than 1 rng). Often another problem is created by inhomogeneity of the material especially typical for copper alloys (see e.g., References 269, 338, 340). That is why when objects are small enough (e.g., coins), the whole artifact may be irradiated and ana1yzed.z66.283.284.2888294 ~ ditionally, d the surface may be covered by corrosion products and in the case of iron artifacts, the metal may be totally absent. At present, sampling is performed by drilling with steel drills in different points of the artifact.278.282.308 Specific problem for the activation analysis of metal artifacts is the high radioactivity of the matrix component (Ag, Au, Cu) which at pile irradiation hinders the determination chargedof many micro- and trace elements. That is why methods using epithermal,278.28',282 particle irradiation,z65.3~z,3~3 and GAAl58,276.284,338 are proposed. To reduce the influence of interfering nuclear reactions and self-shielding effects, methods with fast neutron irradiation are Used.285,288,290,294 In spite of these problems, activation methods permit the reliable determination of many elements in metal artifacts. Usually one analytical method, however, is not enough for the characterization of the artifact, so a combination of several methods should be used. Perhaps for archaeometric investigations at present the best results are achieved by combination of NAA and AAS. In the future, this combination probably will give way to ICP-AES which it seems may be able to present an answer to all requirements towards the analysis of metals. ver,265,266,268,274,27S,280,281 ,289,284,291,292
A. COPPER AND COPPER ALLOYS The content of Cu in copper artifacts varies between 50 and 100% and as additives Sn (2 to lo%), Zn (2 to 25%), Ag (1 to 30%), Pb (0 to 30%), and As (0.1 to 10%) are included. Besides, a lot of impurities and microelements are present which are very important in provenance studies. In the latter case, the content of Ag, As, Au, Sb, Ni, Se, Te, Sn, Pb, Additionally Pt, Pd, Ru, Ir,302In, and Mo282may be of Bi should be determined.282.302 importance. The content of Bi, Se, and Te changes substantially in the process of smelting especially with Sn and Pb. The content of such elements like Fe, Cr, and Mn does not bring any information about the origin of the sample but may provide additional information about the methods of ore processing and their concentration is important in technological studies. The determination of this list of elements in copper and its alloys cannot be done only by one analytical method. NAA with pile neutrons for example cannot be used for the determination of Bi and Pb. Activation methods that permit their determination are GAA158.286,338 or irradiation with fast neutron^.^" Another approach is to combine NAA with AAS .282,289.310
Volume I1
473
Although many s ~ i e n t i s t s ~ ~ use ~ , NAA ~ ~ ~with . ~ pile ~ ~neutrons , ~ ~ ~for , ~the, analysis ~ ~ ~ who irradiates of copper artifacts, we would like to recommend the approach of the sample with epithermal neutrons. Thus the high background of the spectrum due to 6 4 C ~ ( 6 6 Cis~reduced ) and the conditions for the determination of Ag, As, Au, Sb, and Sn are improved.278In this way, however, the determination of Fe is not always possible, but it may be performed after a second irradiation with pile neutrons. Another approach used for the reduction of the background described in References 294 and 307 is measurement of prompt gamma-quants generated during (n,y) reactions. This approach ensures certain quickness of the analysis, but the installations which should be used are rather unique which hinders the wide application. One interfering reaction that should be mentioned in analysis of copper and its alloys is
z ~ ~ ~ Correction in the content of Co should be introduced.330Thompson and L ~ t evaluated Our calculations indicate that the contribution of Reaction 11 to be about 1.7 x the irradiation of 10-mg Cu in a nuclear reactor for 6 h with 1 x 1013 cm-2 s-I thermal neutron flux and 1 X 10'2 cm-2 S - I fast neutrons generates "Co activity equivalent to 8 x 1 0 - ~ CO. Maybe one of the most significant investigations of metals by INAA is the study of native copper sources in the U.S.304The aim is to trace the trade routes and the distribution of different copper alloys in North America. Jordan and May279investigated brass sun-dials to establish imitations. In Reference 303, the absolute identity of two French sculptures from the 17th century was established and the conclusion made that they were made in one workshop. C h i n e ~ e ~and ~ ~Japanese326 .'~~ coins were investigated by INAA and also in combination with ICP-AES.326Transition from Cu-Pb-Sn to Cu-Zn alloys326was established during the 15th to 16th century in China and 18th century in Japan. Some differences in the chemical composition between Japanese and Chinese coins were detected.jz6 The famous Chinese bronze mirror was also investigated by NAA with fast neutrons.307 In a series of papers, Gilmore et a1.278,282,308 report the results from the investigation of silver-brass coins from North Umbria. These investigations elucidate the methods for the production of this special kind of alloy. Greek285,28\nd Roman266.286.288.2w copper-based coins have been investigated as well as different prehistoric331and Bronze Age283objects. The possibilities of GAA are demonstrated in Reference 338 as well as in interlaboratory analyses of o r i h a l c ~ m . ~ ~ ~ The investigations of Pernicka et a1.3'0.329are the beginning of an ambitious project for an archaeometallurgical study of the production and processing of copper alloys in Asia Minor. NAA and AAS are only a part of this investigation which includes lead isotope analysis, I4C dating, and factor analysis. The aim of these works is to characterize different ore deposits used in ancient times and to find criteria for the localization of the artifacts.
-
-
B. SILVER AND LEAD In most cases, the sources for the production of silver are lead ores and that is why we shall discuss silver and lead together, although the problems in the analysis are quite different. The information about the content of Au, Bi, Cu, and Sb is very important in the study of silver objects3" and for the provenance studies, the determination of Ir, Pd, Pt, and Ru302 is very useful. It is rather difficult to determine the noble metals and that is why information about their content is rather limited with the exception of Ir.265,268,280,28',289,293,312 For the
474
Activation Analysis
correct determination of the noble metals (and other elements, too) in silver artifacts, radiochemical NAA may be used (e.g., Reference 268) or activation analysis with charged partiCleS.265,312.313 The content of Pb and Bi in silver artifacts is interesting for the technological studies on the production of Ag from lead ores. Since both elements cannot be determined by NAA, combination with AAS should be used. The problems in the NAA of silver and its alloys arise from the high radioactivity of the matrix and the big number of gamma lines in the spectrum of llOmAgwhich interfere in the determination of Co, Ni, Sb, Se (see Table 11). The data in Table 11 indicate that Sb cannot be determined correctly by INAA with pile neutrons when lZZSbis used. The manifold decrease in the sensitivity of the analysis when '24Sbis used often makes the determination of Sb impossible. The same is the case with Se, where only the gamma line at 279.5 keV - the 1173.2-keV gamma peak. Thus it is already obvious why may be used and for oC@ ' reliable results may be obtained only after radiochemical isolation of Ag.268,280 Gilmore and use INAA but irradiate the samples with epithermal neutrons thus reducing the macroactivity of Ag. In such cases, the use of PAA is very successfu1.265~312~313 In many cases, the main interest is the determination of the content of the matrix element. That is performed after irradiation with pile neutrons from isotope sources like Am/Be,274.25Z,283.346Cf,266,313,31414-MeV neutrons,316and by GAA276,284,330,332 using "Co as a gamma source.284 When charged-particle activation analysis is used, the results for Ag and Au may be considerably higher than the real ones. The reason is that charged particles enter only the surface layer (about 250 ~ m where, ) due to corrosion, the non-noble metal (e.g., Cu) may be removed and concentration of the noble metal is increased. In such cases, the error may reach up to 50%.312(When XRF is used, the error may amount to more than 100%.312) The analysis of lead artifacts has not suffered such serious problems. The matrix (Pb) is "transparent" for the neutrons (e.g., Reference 160) and the determination of Ag, As, Au, Cu, Sb, Sn is without difficulties. Besides Se, Te and the Pt metals should be determined in the case of provenance This, however, is valid for a metal from which Ag has not been extracted. (Usually lead ore has been most often used for production of Ag.317) Indication for such a processing is the silver content - usually below 0.01%. A possible source of error in the analysis is the absorption of low gamma- and X-rays of the radioisotopes generated in the lead sample. For example the error coming from the absorption of gamma-quants of '98Au (41 1.6 keV) in 100-mg sample of lead (spherical form) and standard with "zero" mass amounts to 20%! That is why it is recommended that standards be prepared for analysis by pipetting standard solutions onto pure lead foil which, after careful folding, acquires the form of the sample. The archaeometric investigations of silver artifacts are usually aimed at the localization of the ore deposit used for the raw material or at revealing the technology of silver production. Many papers have been devoted to such investigations and mainly the Pb isotope ratio has been used for discrimination between artifacts.2,317.319-322 The archaeometric group in Heidelberg recommends the use of at least two independent criteria, the lead isotope ratio and the chemical composition (e.g., References 302, 31 1, 3 17, 319, 321). The chemical analysis reveals the type of the ore and is very useful in the case of overlapping of the isotope ratio in different regions. A lot of papers discuss investigations of silver artifacts while their number for lead artifacts is limited. Iranian (SasanAlmost all silver coins have been analyzed: Greek,2~~280~3'2~313~317~320 ian),275 Roman,266,284,292,311,313.314,321s324.330 Galian,316 medieval from England,281.308.309 F r a n ~ e , ~Hungary,284 ~ ~ . ~ ' ~ as well as Russian and Swedishz9'and Indian.283.284 The chemical composition of Greek317,321,322 and Roman270lead artifacts has been in-
TABLE 11 Matrix Interferences in INAA of Trace Elements in Silver Artifacts Intefering Element
Radionuclide
CO Ni Sb
CO-60 Co-58 Sb-122 Sb- 124 Se-75
Se
Gamma line (kev)
Gamma yield
g photons . s-'
Gamma line (keV)
Gamma yield
(a)
10-3 ~g photons . s-' 140 7070 760 97 110 230 48 35
1332.5 810.6 564.1 1690. 1 121.1 135.9 264.5 400.7
Note: Conditions of irradiation: irradiation time s-' fast neutrons.
=
6 h: neutron flux = 1
X
.
10" cm-= s C 1thermal neutrons and 1
X
1012 cmC2
476
Activation Analysis
Additionally, activation methods have been used in the characterizationof silve?11.320,322 and lead3" ores from the Aegean region. We would like to mention the approach of the archaeometric group in Heidelberg where, thanks to the collaboration between geologists, chemists, physicists, archaeologists, etc. and the use of many modem analytical methods (INAA, RNAA, AAS, XRF), we now know almost everything possible about the silver sources and the production of silver in the Aegean region~2,311.317,318.320,322
C. GOLD Man started the production of gold from native gold about 6000 years ago. In the provenance studies of gold, extremely useful according to RiedereP5 is the information about the content of Pt and Sn. According to P e r n i ~ k athe , ~ ~content ~ of Ag, Sn, Te, Cu, as well as the Pt metals (Ir, Pt, Pd, Ru, 0 s ) may be very important. All these metals may be determined by activation analysis but the papers devoted to such investigations are rare. Besides the high value of gold artifacts, another possible explanation of this fact is the high matrix radioactivity and shielding and self-absorption effects. When pile irradiation is performed even of samples weighing 60 mg (spherical form) and standard with "zero", mass shielding effects amount to 10%. So the standard and the sample must have equal composition, weight, and form, which is very difficult when whole objects are analyzed. There are also problems even when fast neutrons are used.332When gamma spectrometry is performed, correction for the self-absorption should be introduced (e.g., for a sample of about 100 mg, the correction for T u [5 11 keV] amounts to 5%). The possibilities of RNAA after isolation of Au are considerably greater. It seems that the best activation method in this case is PAA312and to a certain extent, GAA.33s Archaeometric investigations of Egyptian,2M.284.312 Roman,2M~2s4~312 German,276 Turki ~ h , and ' ~ ~Swedishzs4coins have been done, In all cases, only the content of Au has been determined, with only the exception of Barrandon312who determined 25 elements by using PAA. We would like to mention the use of NAA for the discovery of the gold mines in T h a ~ o and s~~ S y~p h n o ~ , described '~~ by Herodoth.
D. IRON Iron together with copper has played a very important role in human history (e.g., Reference 335). As a source for its production, different iron ores are used (usually oxides) and iron is produced after reduction with carbon (coals). This process demands very high temperatures (1800 K) and was developed most probably around the middle of the second millenium B .C. The study of iron artifacts usually is done by metallographic methods. The determination of carbon provides information about the technology of steel production.337The investigation of slag is also very important in technological s t ~ d i e s . ' ~Activation ~ , ~ ~ ~ methods may find application in provenance studies where the trace element composition plays an important role. In our opinion, NAA is extremely useful in establishing the meteorite origin of iron artifacts. The questions of INAA of iron meteorites are discussed by Willis and W a ~ s o n ~ ~ ~ and a method is proposed permitting the determination of 12 elements. At present the use of activation methods for analysis of iron artifacts is limited.287.290.337 The irradiation of the samples is done by pilez8' and generator fast neutrons.290When reactor neutrons are used, problems arise with the correct determination of Mn and Cr (e.g., Reference 51) due to the interference in Reactions 10 and 12.
Volume 11
477
In a sample irradiated for 3 h with 1 x 10¹³ cmP2 s-I thermal and 1 x 1012cm-2 s ~fast ' neutron flux, 500-mg Fe is equivalent to 3.6 x g Mn (according to Reaction 12) and to 2.3 x g Cr (Reaction 10). This problem may be solved if the samples are irradiated with a well-thennalized neutron flux or pure iron monitor should be used in the irradiation. While shielding effects are negligible, in the gamma spectrometry of irradiated iron samples, self-absorption of low energetic gamma and X-rays should be considered. For example in a 500-mg sample, the error in the determination of Se ('3e,264.5 keV) will be 5% if the standard is 100 mg. In such cases, it is perhaps best to dissolve the samples and standard and dilute them to equal volumes. We would like to mention the archaeometric investigation of Aycik and E d g ~ e e r . ~ ~ ' They successfully combine INAA and AAS to increase the number of determined elements in iron artifacts from the 8th century B.C. until today, excavated in Turkey. After using cluster analysis, they succeeded in grouping the artifacts on the basis of their composition. Using NAA with generator neutrons, Bhoroskar et al.2" investigated artifacts from the medieval metallurgical center in India.
VIII. CONCLUSION At the end of this necessarily incomplete survey, we would like to mention that activation analysis, although extremely convenient for solution of archaeological problems, should not be considered the only perfect method in this research. That is why we tried to outline its advantages and shortcomings in each separate case, and we hope that the numerous problems that still remain to be solved become evident. To illustrate how an archaeometric problem should be posed and eventually solved by activation analysis, we described some typical examples and we hope that this will stimulate further research in the application of activation methods in archaeology.
REFERENCES 1. Tite, M., Methods of Physical Examination in Archaeology, Seminar Press, London, 1972. 2. Mommsen, H., Archaeometrie. Neuere natunvissenschafrliche Methode und Erfolge in der Archaeolgie, B. G. Teubner, Stuttgart, 1986. 3. Massart, D. and Kaufman, L., The Interpretation of Analytical Chemical Data by the Use of Cluster Analysis, John Wiley & Sons, New York, 1983. 4. Harbottle, G., Activation analysis in archaeology, in Radiochemistry, Newton, G. W. A,, Ed., The Chem. Soc., Burlington House, London, Vol. 3., 33, 1976. 5. Laul, J. C., NAA of geological materials, At. Energy Rev., 17, 603, 1979. 6. Korpusova, V. N. and Gorlitskii, B. A., Lithological-geochemical criteria for the classification of ancient ceramics, Visn. Akad. Nauk. Ukr. SSR, No. 6 , 34, 1983. 7. Wilson, A. L., Elemental analysis of pottery in the study of its provenance: a review, J . Archaeol. Sci., 5, 219, 1978. 8. Gritton, V. and Magalousis, M. N., AAS of archaeological ceramic material, inArchaeologica1 Chemistry11, Carter, G . F . , Ed., Advances in Chemistry, Ser. 171, American Chemical Society, Washington, D.C., 1978, 258. 9. Hatcher, H., Hedges, R. E. M., and Pollard, A. M., Analysis of Hellenistic and Roman fine pottery from Benghazi, Archaeometry, 22, 133, 1980. 10. Hughes, M. J., Archaeological applications of AAS, Anal. Proc., 22, 75, 1985. 11. Perlman, I. and Asaro, F., Pottery analysis by NAA, Archaeometry, 25, 77, 1969. 12. Sayre, E., Chan, L. -H., and Sabloff, J., High-resolution gamma-ray spectroscopic analysis of Mayan fine orange pottery, in Science and Archaeology, Brill, R., Ed., MIT Press, Cambridge, MA, 1971, 165. 13. Delcroix, G. and Philippot, J. Cl., NAA by the monostandard method, J . Radioanal. Chem., 15, 87, 1973.
478
Activation Analysis
14. Bauterla, G., Stenico, A., Terrani, M., and Villani, S., Characterization of Samian ware sherds by means of NAA, Archaeometry, 15, 209, 1973. 15. Abascal-M.R., Harbottle, G., and Sayre, E., Correlation between terra-cota figurines and pottery from the valley of Mexico and source clays by activation analysis, in Archaeological Chemistry, Beck, C. W., Ed., Advances in Chemistry, Ser. 138, American Chemical Society, Washington, D.C., 1974, 81. 16. Abascal-M. R., Harbottle, G., and Sayre, E. V., NAA of a group of Tlatilco figurine, Rep. BNL 16567, 1971. 17. Bieber, A. M., Jr., Brooks, D. W., Harbottle, G., and Sayre, E., Compositional groupings of some ancient Aegean and Eastern Mediterranean pottery, in Proc. Congr. Int. Applicatione di metodi nucleari nel campo delle opere d'arte, Roma-Venezia, 1973, Academia Nazionale dei Lincei, Rome, 1976, 111. 18. Birguel, O., Diksic, M., and Yaffe, L., Activation analysis of Turkish and Canadian clays and Turkish pottery, Proc. 5th Conf. Modern Trends in Activation Analysis, Munich, 1976, 1136. 19. Hancock, R. G. V., Low flux multielement INAA in archaeometry, Anal. Chem., 48, 1443, 1976. 20. Segebade, Ch. and Lutz, G., Simultane instrumentelle Multielementbestimmung in antiker Keramik (Terra sigillata) durch Aktiviemng mit hochenergetischen Photonen, J. Radioanal. Chem., 34, 345, 1976. 21. Aspinall, A., NAA of medieval ceramics, Medieval Ceramics, 1, 5, 1977. 22. Als Hansen, B., Sorensen, M. A., Heydorn, K., Mejdahl, V., and Conradsen, K., Provenance study of medieval, decorated floor-tiles carried out by means of NAA, Proc. 18th Intern. Symp. Archaeometry and Archaeological Prospection, Bonn, 1978, 119. 23. Attas, M., Analyse par activation neutronique de la ceramique de Lerne (Greece) a l'age du bronze ancient: productions locales et echenges commerciaux, These Universite de Paris-Sud, Centre d'Orsay, 1980. 24. Ferriera-Marques, M. F. and Schubiger, P. A., Comparison of NAA from five ceramic standards of C.R.A.M. CAEN and the PerlmanIAsaro standard, J. Radioanal. Chem., 55, 131, 1980. 25. Grimanis, A. P., Filippakii, S. E., Perdikatsis, B., Vasilaki-Grimani, M., Bosana-Kourou, N., and Yalouris, N., Neutron activation and X-ray analysis of "Tapsos Class" vases. An attempt to identify their origin, J. Archaeol. Sci., 7, 227, 1980. 26. Schwabe, R., NAA Spurenelementbestimmung und Anwendung der Clusteranalyse an archaeologischer Keramik aus Spandau und Peru, Berl. Beitr. Archaeomerie, 5, 105, 1980. 27. Allen, R., Rodgers, M., Mitchel, R., and Hoffman, M., A geochemical approach to the understanding to ceramic technology in predynastic Egypt, Archaeomerry, 24, 199, 1982. 28. Hancock, R. G. V., On the determination of Si in pottery, J. Radio Anal. Chem., 69, 313, 1982. 29. Kaplan, M., Harbottle, G., and Sayre, E., Multi-disciplinary analysis of Tell el Yahudiyeh ware, Archaeometry, 24, 127, 1982. 30. Mello, E., Lusuardi, S., Meloni, S., and Oddone, M., Provenance studies of Roman amphorae by INAA, J . Radioanal. Chem., 69, 259, 1982. 31. Cesana, A., Ciasca, A., Cuomo di Carpio, N., Terrani, M., and Tusa, V., Characterization of Phoenician pottery from Mothia by NAA, J. Radioanal. Chem., 78, 347, 1983. 32. Filliers, D., Harbottle, G., and Sayre, E., Neutron activation study of figurine, pottery and workshop materials from the Athenian Agora, J. Field Archaeol., 10, 56, 1983. 33. Pike, H. H. M. and Fulford, M., NAA of black-glazed pottery from Carthage, Archaeomerry. 25, 77, 1983. 34. Slusallek, K., Bumester, A., and Boerker, Chr., NeutronenaktivierungsanalytischeUntersuchungen an gestempelten griechischen Amphorenhenkeln: erste Ergebnisse, Berl. Beitr. Archaeometrie, 8, 261, 1983. 35. Cesana, A., and Terrani, M., Determination of P in bones and of Al and Si in pottery by activation with reactor neutrons, Int. J. Appl. Radiar. Isot., 35, 405, 1984. 36. Hancock, R. G . V., On the source of clay used for Cologne Roman pottery, Archaeometry, 26, 210, 1984. 37. Hughes, M. J. and Vice, A. G., NAA and petrology of Hispano-Moresque pottery, Proc. 24th Int. Symp. Archaeometry, Washington, D.C., 1984, O h , J. and Blackman, M., Eds., Smithsonian Institution Press, Washington, D.C., 1986, 353. 38. Yellin, J., Gamma-ray spectra map of standard pottery, Part I: 11-409 KeV, Radiochim. Acta, 35, 107, 1984. 39. Hancock, R. G. V., NAA of ceramics: Problems with Ti and Ca, Archaeomerry, 27, 94, 1985. 40. Hou, L. H., Characteristic elements of Longquan Greenwre, Archaeometry. 27, 53, 1985. 41. Penev, I., Kuleff, I., and Djingova, R., Simultaneous neutron activation determination of Al, Mg and Si in rocks, glasses and pottery, J. Radioanal. Nucl. Chem., 96,219, 1985. 42. Perlman, I., Applications to Archaeology, in Nondestructive Activation Analysis, Amiel, S., Ed., Elsevier, Amsterdam, 1981, 259. 43. Hancock, R. G. V., Millet, N. B., and M i , A. J., A rapid INAA method to characterize Egyptian ceramics, J. Archeol. Sci., 13, 107, 1986. 44. Hopke, Ph. K., Martin, R. C., and Evans, M., The interpretation of multielemental INAA data using pattern recognition methods, Proc. 7th Int. Conf. Modern Trends in Activation Analysis, Copenhagen, 1986, 55.
Volume 11
479
45. King, R., Rupp, D., and Sorenson, L., A multivariate analysis of pottery from Southwestern Cyprus using NAA data, J . Archaeol. Sci., 13, 361, 1986. 46. Kuleff, I., Djingova, R., and Penev, I., INAA of Pottery, J . Radioanal. Chem.. 99, 345, 1986. 47. Wolff, S., Liddy, D., Newton, G., Robinson, V., and Smith, R., Classical and Hellenistic black glaze ware in the Mediterranean: A study by epithermal NAA, J . Archaeol. Sci.. 13, 245, 1986. 48. Yeh, S. J. and Harbottle, G., Intercompanson of the Asaro-Perlman and Brookhaven archaeological ceramic analytical standards, J . Radioanal. Nucl. Chem., 97, 279, 1986. 49. Kuleff, I., Neutron Activation Determination of the Content of Uranium in Rocks, Minerals and Natural Waters, Ph.D. thesis, Faculty of Chemisty, University of Sofia, Sofia, Bulgaria, 1980. 50. Kuleff, I. and Kostadinov, K., Epithermal NAA of U by 239Npusing high resolution gamma-spectrometry, J . Radioanal. Chem., 63, 397, 1981. 51. De Soete, D., Gibels, R., and Hoste, J., Neutron Activation Analysis. Wiley Interscience, London, 1972. 52. Alfassi, Z. and Lavi, N., Simultaneous determination of Na, Mg, Al, Si and P by INAA using reactor and epithermal neutrons, Analyst, 109, 959, 1984. 52a. Alfassi, Z., Epithermal NAA, J . Radioanal. Nucl. Chem., 90, 151, 1985. 53. Sneat, P. H. A. and Sokal, R. R., Numerical Taxonomy, W. H . Freeman, San Francisco, 1973. 54. Hoede, D. and Das, H. A., Accuracy and precision of INAA based on gamma-spectrometry with a planar intrisic Ge-detector, J. Radioanal. Chem., 62, 171, 1981. 55. Harbottle, G., Provenience studies using NAA: the role of standardization, in Archaeological Ceramics, Eds. Franklin, A. D. and Olin. J., Eds., Smithsonian Institution Press, Washington, D.C., 1982. 56. Harbottle, G., Chemical characterization in archaeology, in Contexts for Prehistoric Exchange, Academic Press, New York, 1982, 13. 57. Harbottle, G., private communication, 1987. 58. Brissaud, I., Lagarde, G., Sabir, A., and Houdayer, A., PIXE macro and microprobe techniques in archaeometry, J . Radioanal. Chern., 115, 99, 1987. 59. Blackman, M. J., Provenance study of Middle Eastern obsidian from sites in highland Iran, in Archaeological Chemistry-III, Lambert, J . Ed., Advances in Chemistry, Ser. 205, American Chemical Society, Washington, D.C., 1984, 19. 60. Perlman, I., Modem NAA and ancient history, inArchaeologica1 Chemistry-III. Lambert, J . , Ed.,Advances in Chemistry, Ser. 205, Am. Chem. Soc., Washington, D.C., 1984, 117. 61. Sabir, A., Etude de justesse et de precision dam une methode automatique d'analyse par activation neutronique non destructive. Cas des matrices siliceuses. Application a la recherche de l'origine de ceramiques archeologiques, Ph.D. thesis, University Paris XI, 1986. 62. Hallett, J., Keall, E. J., Vitali, V., and Hancock, R. G. V., Chemical analysis of Yemeni archaeological ceramics and the Egyptian enigma, J. Radioanal. Nucl. Chem., 110, 293, 1987. 63. Tobia, S. K. and Sayre, E., An analytical comparison of various Egyptian soil, clays, shales, and some ancient pottery by neutron activation, in Recent Advances in Science and Technology of Materials III, Bishay, A., Ed., Plenum Press, New York, 1974, 99. 64. Kaplan, M. F., Harbottle, G., and Sayre, E., Tell El Yahudiyeh Ware: A reevaluation, in Ports and Potters. Current Approaches in Ceramic Archaeology, Rice, P. M., Ed., University of California, 1984, 227. 65. Artzy, M. and Asaro, F., Origin of Tell El-Yahudiyah ware, Rep. LBL-4399, 1977. 66. Perlman, I. and Asaro, F., Deduction of provenience of pottery from trace element analysis, in Scientific Methods in Medieval Archaeology, University of California, Los Angeles, 1970, 389. 67. Perlman, I., Asaro, F., and Michel, H. V., Nuclear applications in art and archaeology, Annu. Rev. Nucl. Sci., 22, 383, 1972. 68. Allen, R. 0. and Hamroush, H., The application of geochemical techniques to the investigation of predynastic sites in Egypt, in Archaeological Chemistry 111, Lambert, J . B., Ed., Advances in Chemistry, Ser. 205, American Chemical Society, Washington, D.C., 1984, 51. 69. Broocs, D., Bieber, A. M., Jr., Harbottle, G., and Sayre, E., Biblical studies through activation analysis of ancient pottery, in Archaeological Chemistry, Beck, C. W., Ed., Advances in Chemistry Ser. 138, American Chemical Society, Washington, D.C., 1974, 48. 70. Allen, R. O., Cracked pot chemistry. The role of analytical chemistry in archaeology, J . Chem. Educ., 62, 37, 1985. 71. Allen, R. O., Hamroush, H., and Hoffman, M. A., Uncovering the secrets of the ancient Nile, Anal. Chem., 58, 572A, 1986. 72. Perlman, I. and Asaro, F., Pottery analysis by neutron activation, in Science and Archaeology, Brill, R., E d . , MIT Press, Cambridge, MA, 1971. 73. Matthers, J., Liddy, D. J., Newton, G. W. A., Robinson, V. J., and Al-Tawel, H., Black-on-red ware in the Levant: A NAA study, J . Archaeol. Sci., 10, 369, 1983. 74. Frierman, J. D., Asaro, F., and Michel, H. V., The provenance of early islamic luster wares, in Ars Oricutalis, Smithsonian Institution, Washington, D. C . , 1979, vol. XI, 111.
480
Activation Analysis
75. Davidson, T. E. and McKerrell, H., Pottery analysis and Halaf period trade in the Khalur headwaters region, Iraq, 38, 45, 1976. 76. Attas, M., Fossey, J., YatTe, L., Variation of ceramic composition with time, Archaeometry, 24, 181, 1982. 77. Gunnewey, J., Perlman, I., and Meshel, Z., The origin of the pottery of Kuntillot, Ajmd, Isr. Explor. J . , 35, 270, 1985. 78. Yellin, J., The provenance of two red-on-black sherds from Tel Mevorakh, Isr. Explor. J., 35, 46, 1985. 79. Megers, E. M., Stratigraphic and ceramic observations from the medieval strata of Khibet Shema, Israel: assessment of the value of scientific analysis, Bull. Am. Sch. Oriental Res., 260, 61, 1985. 80. Artzy, M., Asaro, F., Perlman, I., The origin of the Palestinian bichrome ware, Rep. LBL-1286, 1973. 81. Dobel, A., Asaro, F., and Michel, H. V., NAA and the location of Wassukani, Orientalia, 46, 375, 1977. 82. Whitehouse, D., Neutron activation and the provenance of islamic pottery from the Persian Gulf, in Proc. Conf. Application of the Physical Sciences to Medieval Ceramics. 1975. 83. Birguel, O., Diksik, M., and Yaffe, L., A composition of the statistical treatment of results using concentrations of elements determined by neutron activation and X-ray fluorescence analysis methods, J. Radioanal. Chem., 55, 101, 1980. 84. Matson, F. R., The brickmakers of Bab'ilon, in Ceramics and Civilization: Ancient Technology to Modern Science, Vol. 1, Kingery, W. D., Ed., American Ceramic Society, Columbus, OH, 1985, 61. 85. Wright, R. P., Technology and style in ancient ceramics, in Ceramics and Civilization: Ancient Technology to Modern Science, Vol. 1, Kingery, W. D., Ed., American Ceramic Society, Columbus, OH, 1985, 5. 86. Reindell, I. and Riederer, J., Materialanalysen an archaeologischen Keramiken aus dem Iran, Berl. Beitr. Archaeometrie, 8, 21 1, 1983. 87. Thuesen, I., Heydorn, K., and Gwoulz, R., Investigation of 5000-year-old pottery from Mesopotamia by INAA, PACT, 7, 375, 1982. 88. Thuesen, I., Distributional patterns behind the Scarlet Ware tradition, Colloques Int. CNRS Prehistoire de la Mesopotamie, 1984, Edition du CNRS, Paris, 1986, 461. 89. Bieber, A. M., Brooks, D. W., Harbottle, G., and Sayre, E., Application of multivariate techniques to analytical data on Aegean ceramics, Archueometry, 18, 59, 1976. 90. Asaro, F., Michel, H. V., and Mosier, D., Application of NAA to archaeology and the humanities, Rep. LBL-6877, 1977, 159. 91. Hancock, R. C. V., Betancourt, P. P., INAA of Minoan ceramic composition with time, Archaeometry, 24, 181, 1982. 92. Aspinall, A., NAA of pottery from Thera, in Proc. 2nd Int. Sci. Congr. Thera and the Aegean World, Vol. 11, Santorini, 1978, Doumas, C., Ed., London, 1980, 155. 93. Grimanis, A. P., Vassilaki-Grimani, M., and Karayanis, M. I., INAA of "Melian" potsherds, Proc. Int. Conf. Modern Trends in Activation Analysis, Munich, 1976, 1120. 94. Farnsworth, M., Perlman, I., and Asaro, F., Corinth and Corfu: a neutron activation study of their pottery, Am. J . Archaeol.. 81, 455, 1977. 95. Attas, M., Widemann, F., Fontes, P., Gruel, K., Laubenheimer, F., Leblanc, J., and Lleres, J., Early bronze age ceramics from Lerna in Greece: radiochemical studies, Archaeophysiku, 10, 14, 1979. 96. Attas, M., Yaffe, L., and Fossey, J. M., NAA of early bronze age pottery from lake Vouliagmeni, Parakhora, Central Greece, Archaeometry, 19, 33, 1977. 97. Attas, M., Fossey, J. M., Yaffe, L., An archaeometric study of early bronze age pottery production and exchange in Argolis and Korinthia (Corinthia), Greece, J. Field Archaeol., 14, 77, 1987. 98. Attas, M., Fossey, J. M., and Yaffe, L., Provenance-groupe formation using a general-purpose statistical analysis package, Adv. Comput. Archaeol., 2, 1, 1985. 99. Attas, M., Fossey, J. M., and Yaffe, L., Compositional reference groups for pottery from Sparta in Greece, 8 to 4 c.B.C., in Proc. 20th Int. Symp. Archaeometry, Paris, 1980. 100. Pike, H. and Fulford, M. G., NAA of Black-glazed pottery from Carthage, Archaeometry. 25,77, 1983. 101. Wolf, S. R. and Harbottle, G., The provenance of micaceous amphoras from Carthage using NAA, MASCA, in press. 102. Liddy, D. J., Newton, G. W. A., Robinson, V., and Peacock, D. P. S., Study of Roman and Punic amphorae from North Africa by NAA, in 25th Symp. Archaeometry, Athens, 1986, 103 (Abstr.). 103. Cesana, A., Ciasca, A,, Cuomo Di Caprio, N., and Terrani, M., Provenance studies on Phoenician pottery by NAA, in Proc. Int. Symp. Archaeometry, Naples, 18 to 23 April, 1983, 21. 104. Widemann, F., Picon, M., Asaro, F., Michel, H. V., and Perlman, I., A Lyons branch of the pottery making firm of ateins of Arezzo, Archneometry, 17, 45, 1975. 105. Wideman, F., Laubenheimer, F., Attas, M., Fontes, P., Gruel, K., Leblanc, J., and Lleres, J., Analytical and typological study of Gallo-Roman workshops producing amphorae in the area of Narbonne, Archaeophysiku, 10, 3 17, 1979.
Volume 11
481
106. Fontes, P., Laubenheimer, F., Leblanc, J., Bonnefoy, F., Gruel, K., and Wideman, F., New analytical and typologycal data for amphorae workshops in South Gaul, in Proc. 20th Int. Symp. Archaeometry, Paris, 1980. 107. Laubenheimer, F., Fontes, P., Leblanc, J., Dodinet, M., Lacharme, J., Lleres, J., and Wideman, F., Romaines-mise en evidence d'exportions aux frontieres de l'empire, in Proc. 20th Int. Symp. Archaeometry, Paris, 1980. 108. Naciri, A., Widemann, F., Sabir, A., Distinction par analyse par activation neutronique des amphores 103, 1983. 109. Laubenheimer, F., La production des amphores en gaule Narbonnaise, Les Belles Lettres, Paris, 1983. 110. Koeberl, Ch., Geochemistry of tektites and impact glasses, Annu. Rev. Earth Planet Sci., 14, 323, 1986. 111. Asaro, F., Michel, H., Widemann, F., and Fillieres-Kunetz, D., Etude analytique de la provenance d'un vase signe, Gallia, 33, 225, 1977. 112. Fontes, P., Attas, M., Vertet, H., Widemann, F., Gruel, K., Laubenheim, Leblanc, J., and Lleres, J., Analytical study of three Gallo-Roman white figurine workshops, Archaeophysika, 10, 101, 1979. 113. Joron, J. L., Treuil, M., and Jaffrezic, H., Trace elements archaeochemistry in different sigillated potteries, using NAA, J . Radioanal. Chem., 39, 6 3 , 1977. 114. Hoffman, B., Schneider, G., and Vernhet, A., An early mould for Samian ware from La Graufesenque (Southern France), in Proc. 25th Symp. Archaeometry, Athens, 1986, (in press). 115. Hancock, R. G. V., On the source of clay used for Cologne Roman pottery, Archaeometry, 26, 210, 1984. 116. Rottlaender, R. C. A., Ueber die Veraenderungen von Elementkonzentrationen in keramischen Scherben waehrend der Bodenlagerung, Sprechsaal, 115, 210, 1982. 117. Segebade, Ch. and Lutz, G. J., Die Untersuchung einiger Bodenlagerungseinfluesse auf die Zusamensetzung von roemischer Keramik (Tera sigillata), Berl. Beitr. Archaeometrie, 5, 69, 1980. 118. Franklin, U. M. and Vitali, V., The environmental stability of ancient ceramics, Archaeometry. 27, 3, 1985. 119. Bagnasco, M. B., Branca, M. E., Conforto, L., Nicoletti, M., Palmieri, A. M., and Taddeucci, A., Imported and locally produced ceramics at Locri Epizephiri: Results of spectrochemical analysis, chemical considerations on the thermal treatment of row material and weathering of ceramics, in Proc. 20th Int. Symp. Archaeometry, Paris, 1980. 120. Ajdacic, V. V., Franklin, U. M., and Hancock, R. G. V., The environmental stability of ceramics, in Proc. Int. Symp. Archaeometry, Naples, 1983. 121. Vitali, V., Franklin, U. M., and Hancock, R. G. V., La stabilite des ceramiques par rapport a I'environnement, Revue d'Archeometrie 8, 41, 1984. 122. Hancock, R. G. V., Hayes, J. W., and Wightman, E. M., INAA of ceramic samples from the lower Liri Valley, Italy, MASCA J . , 3, 7 5 , 1984. 123. Krywonos, W., Newton, G. W. A., and Robinson, V. J., NAA of Roman coarce ware from Cyrenaica, Archaeometry, 22, 189, 1980. 124. Cesana, A., Cuomo Di Carpio, N., Terrani, M., Elemental analysis by INAA of Hellenistic-Roman pottery from Morgantina (Sicilia Italia), in Proc. 25th Int. Symp. Archaeometry, Athens, 1976, in press. 125. Kuleff, I., Djingova, R., Djingov, G . , Provenance study of pottery by INAA, in Proc. 7th Int. Conf. Modern Trends in Activation Analysis, Vol. 2, Copenhagen, 1986, 787. 126. Kuleff, I., Djingova, R., and Djingov, G., Provenance study of sgraffito ceramics (XIII-XIV c.) from Shumen, Vama, Tchewen (Northeastern Bulgaria), in Proc. 25th Int. Symp. Archaeometry, Athens, 1986, in press. 127. Talbot-Rice, B., Bizantine Glazed Pottery. Oxford, 1930. 128. Kuzev, A., Medieval sraffito ceramics with monorams from Vama, Bull. de Musee National de Varna, XV(XXX), 125, 1979. 129. Hansen, B. A., Soerensen, M. A., Heydorn, K., Christensen, H., Mejdahl, V., Winter-Nielsen, M., and Conradsen, K., The Bistrup project: A comparison of floor-tiles from medieval churches by means of NAA in 2nd Nordic Conf. on the Application of Scientific Methods in Archaeology, Elsinore, 1981, Hackens, T. and Mejdahl V., Eds., Risoe National Laboratory, Roskilde, 1982, 383. 130. Jornet, A., Blackman, M. N., Olin, J. S., 13th to 18th century ceramics from the Patema-Manises area (Spain), in Ceramics and Civilization: Ancient Technology to Modern Science, Vol. 1, Kingery, W. D., Ed., American Ceramic Society, Columbus, OH, 1985, 235. 131. Hughes, M. N., Cherry, J., Freestone, J. C., Lease, M., NAA and petrology of medieval English decorated floor tiles from Midlands, in Current Research in Ceramics: Thin Section Studies, Freestone, I . , Johnes, C., Potter, T., Eds., British Museum Occasional Paper No. 32, London, 113. 132. Hughes, M. J., Surface and interior analysis of antiquities, Nucl. Instrum. Methods, B14, 16, 1986. 133. Leese, M. N., Hughes, M. J., and Cherry, J., A scientific study of N. Midlands medieval tile production, Oxford J . Archaeol., 5, 335, 1986.
482
Activation Analysis
134. Gonzales-Vichez, C., Garcia-Ramos, G., Gonzales-Garcia, F., and Pellicer-Catalan, M., Cerro Macareno (Sevilla) pottery: the nature and provenance of amphoras and other earthenware pots from VIII to 111 c.B.C., in Proc. 22nd Inr. Symp. Archaeometry, Aspinall, A. and Warren, S. E., Eds., University of Bradford, Bradford, U.K., 1983, 388. 135. Olin, J. S., Harbottle, G., and Sayre, E., Elemental compositions of Spanish and Spanish-colonial majolica ceramics in the identification of provenience, in Archaeological Chemistry II, Carter, G. F., Ed., American Chemical Society, Washington, D.C., 1978, 200. 136. Bennyhoff, J. A. and Heizer, A. F., NAA of some Cuicuilco and Teotihuacan pottery, archaeological interpretation of results, Am. Antiq., 30, 348, 1965. 137. O h , J. S. and Sayre, E., Compositional categories of some English and American pottery of the American colonial period, in Science and Archaeology, Brill, R . , Ed., MIT Press, Cambridge, 1971, 165. 138. Sayre, E., Chan, L. -H., and Sahloff, J. A., High-resolution gamma ray spectroscopic analysis of Mayan fine orange pottery, in Science and Archaeology, Brill, R., Ed., MIT Press, Cambridge, MA, 1971, 165. 139. Filherth, E. W., Rowe, M. W., and Shaefer, H. J., Uranium in Hueco and Guadalupe mountain Indian ceramics, Archaeometry, 22, 107, 1980. 140. Stimmell, C., Heimann, R., and Hancwk, R. G. V., Indian pottery from the Mississippi Valley: Coping with bad row materials, in Archaeological Ceramics, Olin, J . and Franklin, U. M., Eds., Smithsonian Institution Press, Washington, D.C., 1982, 219. 141. Bishop, R. L., Rands, R. L., and Harbottle, G., A ceramic compositional interpretation of incenseburner trade in the Palenque area, Mexico, Rep. BNL -26787, 1980. 142. Kolb, C. C., Technological and cultural aspects of Teotihuacan "Thin orange ware", in Pots and Pottery: Current Approaches in Ceramic Archeological, Rice, P. M., Ed., University of California, Los Angeles, 1984, 209. 143. Wagner, U., Aha, W., Kaufmann-Doig, F., Riederer, J., Salazar, R., Tellenbach, Ulbert, C., Vreeland, J. M., Wagner, F., and Mueller-Karpe, H., Physical study of Precolumbian ceramics from the Andes, Archaeol. Peruana, 1, 167, 1987. 144. Wagner, U., von Bradis, S., Marticorena, B., Salazar, R., Schwaba, R., Reiderer, J., and Wagner, F., Moessbauer studies of ceramics from the Inca period, in Proc. 25th Int. Symp. Archaeometry, Maniatis, Y . , Ed., Elsevier, Amsterdam, 1989, 159. 145. Boulle, G. J. and Peisach, M., Characterisation of South West African potsherds by NAA of trace elements, J. Radianal. Chem., 39, 33, 1977. 146. Boulle, G. J. and Peisach, M., Trace element analysis of archaeological materials and the use of pattern recognition methods to establish identity, J . Radioanal. Chem., 50, 205, 1979. 147. Boulle, G. J., Peisach, M., and Jacobson, L., Archaeological significance of trace element analysis of South West African potsherds, S. Afi. J. Sci., 75, 215, 1979. 148. Iyer, R. K., Jaganndha, and Krishnamoorthy, K. B., Study of trace element distribution in Indian potsherds by NAA, Rep. BARC, 1-105, 1971. 149. Li, H. H., Mei, Y., and Sun, Y., Trace element in Jun ware, Guisuanyan Xuebao, 14, 28, 1986. 150. Lee, C., Kwun, 0. C., and Kang, H. T., Characterization of Korean clays and pottery by NAA. Part I. Characterization of Korean porcelain sherds, Bull. Korean Chem. Soc., 7, 73, 1986. 151. Mitsuji, T., Okai, T., Sugi, N., and Yamaguchi, K., Distribution of Korean earthenwares in the Japanese ancient archaeological sites, Archaeol. Nut. Sci., 18, 51, 1986. 152. Kawashiia, T. and Matsuno, Y., Provenance studies of the KO-kutani wares by NAA, Archaeol. Nat. Sci.. 18, 51, 1986. 153. Bezborodov, M. A., Chemistry and Technology of Ancient and Medieval Glasses, (orig. Russian), Nauka i Tekhnika, Minsk, 1969. 154. Stapova, Yu L., On the History of Ancient Glassmaking, (orig. Russian) Izd. Moskovskogo Universiteta, Moscow, 1983. 155. Henderson, J., The raw materials of early glass production, Oxford J. Archaeol., 4, 267, 1985. 156. Caley, E. R., Analysis of Ancient Glasses, 1790-1957. A Comprehensive and Critical survey, Comin, New York, 1962. 157. McGinley, J. R. and Schweikert, E. A., Multielement charged particle activation analysis with X-ray counting, Anal. Chem.. 48,429, 1976. 158. Burmistenko, Yu. N., Foto-yadernyi analiz sostava veshtestva, (Photonuclear method of analysis), Energoatomizdat, Moscow, 1986. 159. Gebhard, R., Riederer, J., Scbwabe, R., Wagner, U., and Kossack, G., Coloration of Celtic glass, in Proc. 25th Int. Svmu. Archaeometrv. Athens, 1986, (in oms). 161. Sayre, E., Refinement in methods of NAA of ancient glass objects through the use of lithium drifted germanium diode counters, in Proc. 7th Congr. Glass, Brussels, 1965, Rep. 220. 162. Kuleff, I., Djingova, R., and Djingov, G., Provenience study of medieval Bulgarian glasses by NAA and cluster analysis, Archaeometry, 27, 185, 1985.
Volume 11
483
163. Kuleff, I., Djingova, R., and Penev, I., On the chemical composition of medieval Bulgarian glasses from Preslav (IX-Xc.), Glastech. Ber., 58, 232, 1985. 164. Frana, J., Mastalka, A., and Venclova, N., NAA of some ancient glasses from Bohemia, Archaeometry, 29, 69, 1987. 165. Kuleff, 1. and Djingova, R., Application of NAA in the study of archaeological finds and works of art, Izv. Nut. Histor. Museum (Sojia), 4, 290, 1983. 166. Gills, T. E., Marlow, W., and Thompson, B., Determination of trace elements in glass by activation analysis using HAP for Na removal, Anal. Chem., 42, 1831, 1970. 167. Coleman, R. F. and Goode, G . C., Comparison of glass fragments by NAA, J. Radioanal. Chem., 15, 367, 1973. 168. Kim, J. I. and Born, H. -J., Monostandard activation analysis and its application of Kale powder and NBS standard glass samples, J. Radioanal. Chem., 13, 427, 1973. 169. O h , J., Sayre, E., Neutron activation analytical survey of some intact medieval glass panels and related specimens, in Archaeological Chemistry, Beck, C. W., Ed., Advances in Chemistry American Chemical Society, Washington, D.C., 1974, 100. 170. Nauer, G., Sorantin, H., and Krejsa, P., Determination of trace elements in ancient glasspieces and correlation with corrosion and devitrification, in Proc. 5th Con5 Modern Trends Activation Analysis, Munich, 1976, 1198. 171. Glascock, M. D., Spalding, T. G., Biers, J. C., and Cornman, M. F., Analysis of copper-based metallic artifacts by prompt gamma-ray NAA, Archaeometry, 26, 96, 1984. 172. Pernicka, E., Nauer, G., NAA der Spurenelementein StandardglasI der DGG(Kalk-Nauonglas), Glastech. Ber., 52, 125, 1979. 173. Kanda, Y., Oikawa, T., and Niwaguchi, T., Multi-element determinations of trace elements in glass by instrumental photon activation analysis, Anal. Chim. Acta, 121, 157, 1980. 174. Sanderson, D. C. W. and Hunter, J. R., The NAA of archaeological glasses from Scandinavia and Britain, PACT, 7, 401, 1982. 175. Frana, J. and Mastalka, A., NAA of some glasses from the Stronghold of Zavist, Pamatki Archeologicke, LXXV, 458, 1984. 176. Kuleff, I., Djingova, R., Iowtschev, M., and Alexandrova, A., INAA of medieval glasses from the first Bulgarian capital Pliska (9th c.), Isotopenpraris, 24, 90, 1988. 177. Carriveau, G. W., Hood, R., Cefaratti, P., Examination of the content of a Bronze age spindle bottle, in Proc. 25th Int. Symp. Archueometry, Athens, (in press). 178. Sayre, E., The intentional use of Sb and Mn in ancient glass, in Advances in Glass Technology, Part 2, New York, 1963, 263. 179. Sayre, E., Analytical studies of ancient Egyptian glass, in Recent Advances in the Science and Technology of Materials, Vol. 3, Plenum Press, New York, 1974, 47. 180. Kuleff, I., Djingova, R., Penev, I., and Chemshirova, K., Multielemental INAA of ancient and medieval glass, Izv. Nut. Historical Museum (Sofia), 6, 121, 1986. 181. Daniel, H., Hartmann, F. J., and Koehler, E., Analysis of glasses with muonic X-rays, Fresenius Z. Anal. Chem., 321, 65, 1985. 182. Daniel, H., Hartmann, F. J., Koehler, E., Beitat, U., and Riederer, J., Application of muonic X-rays in archaeology, Archaeometry, 29, 110, 1987. 183. Kuleff, I., Djingova, R., and Penev, I., Analysis of ancient and medieval glasses by INAA, J. Radioanal. Nucl. Chem., 83, 333, 1984. 184. Cox, G. A. and Pollard, A. M., X-ray fluorescence analysis of ancient glass: The importance of sample preparation, Archaeometry, 19, 48, 1977. 185. Randa, Z., Spacek, B., Kuncir, J., and Benada, J., Nondestructive Gamma Activation Analysis oj Mineral Materials, Nuclear Information Centre, Prague, 1981. 186. Venclova, N., Prehistoric eye beads in Central Europe, J. Glass Stud., 25, 11, 1983. 187. Cox, G. A., Heavens, 0 . S., Newton, R. G., and Pollard, A. M., A study of the weathering behavior of medieval glass from York minster, J. Glass Stud., 21, 54, 1979. 188. Kuncir, J., Benada, J., Randa, Z., and Vobecky, M., Multielement standard for routine instrumental activation analysis of trace elements in rocks and tektites, J. Radioanal. Chem., 5, 396, 1970. 189. Gordus, A. A., Griffin, J. B., and Wright, G. A., Activation analysis identification of the geologic origins of prehistoric obsidian artifacts, in Science and Archaeology, Brill, R . , Ed., MIT Press, Cambridge, MA, 1971, 222. 190. Osawa, M., Kasuya, H., and Sakakibara, Y., Trace element abandances in stone artifacts and related materials from Japan by NAA. An approach to archaeological provenience studies, in Proc. 5th Int. Conf. Modern Trends Activation Analysis. Munich, 1976, 1207. 191. Burger, R. and Asaro, F., Trace element analysis of obsidian artifacts from the Andes: New perspectives on Peru-Hyspanic economic interaction in Peru and Bolivia, Rep. LBL -6343, 1977.
484
Activation Analysis
192. Randa, Z., Vobeky, M., Benada, J., and Kuncir, J., Nondestructive NAA of Mineral Materials, 111. Application of Short-Term Activation, Nuclear Information Centre, Prague, 1979. 193. Filippakis, S. E., Grimanis, A. P., and Perdikatsis, B., X-ray and NAA of obsidian samples from Kitsos cave, Sci. Archaeol.. 23, 21, 1981. 194. Ambrose, W. R., Bird, J. R., Duerden, P., The impermanence of obsidian sources in Melanesia, in Archaeological Studies of Pacific Stone Resources, Leach, F. and Davidson, J., Eds., BAR Int. Ser. 104, 1981, 1. 195. Ahmad, S., Chandhary, M., and Qureshi, I., INAA of obsidian rock, J. Radioanal. Chem., 67, 119, 1981. 196. Vogt, J., Graham, C., Glascock, M., and Cobean, R., A study of Mesoamerican obsidian sources using activation analysis, J . Radioanal. Chem., 69, 27 1, 1982. 197. Boden, G. and Richter, E., Untersuchungen an libyschem Wuestenglas mit Hilfe ionisierender Strahlung, Chem. Erde, 43, 101, 1984. 198. Biggazzi, G., Meloni, S., Oddone, M., and Radi, G., Provenance studies of obsidian artifacts: trace element determination and data reduction, J. Radioanal. Nucl. Chem., 98, 353, 1986. 199. Boksenhaum, M. W., Tolstoy, P., Harbottle, G., Kimberlin, M., and Neivens, Obsidian industries and cultural evolution in basin of Mexico before 500 B.C., J. Field Archaeology, 14, 65, 1987. 200. Baedecker, P. A., Rowe, J. J., and Steines, E., Application of epithermal neutron activation in multielement analysis of silicate rocks employing both coaxial Ge(Li) and low energy photon detector systems, J. Radioanal. Chem., 40, 115, 1977. 201. Chattopadhyay, A. and Katz, S. A., Determination of 22 elements in geological samples by INAA, J. Radioanal. Chem., 46, 321, 1978. 202. Stross, F. H., Stevenson, D. P., Weaver, J. R., and Wyld, G., Analysis of American obsidians by XRF and NAA, in Science and Archaeology, Brill, R. H . , Ed., MIT Press, Cambridge, MA, 1971, 210. 203. Asaro, F., Michel, H. V., Sidris, R., and Stross, F., High-precision chemical characterization of major obsidian sources in Guatemala, Am. Antiquity, 43, 436, 1978. 204. Gordus, A. A., Wright, G. A., and Griffin, J. B., Obsidian sources characterized by NAA, Science, 161, 382, 1968. 205. Duerden, P., Cohen, D. D., Clayton, E., Bird, J. R., Ambrose, W. R., and Leach, B. F., Elemental analysis of thick obsidian samples by PIXE spectrometry, Anal. Chem.. 51, 2350, 1979. 206. Blackman, M. J., Olin, J., and Jornet, A., The use of interlaboratory data sets in provenance studies, in Proc. Archaeomerric Symp., Smithsonian Institution Press, Washington, D.C., 1986. 207. Ambrose, W. R., Obsidian and its prehistoric disrribution in Melanesia, in Proc. Symp. on Scientrfic Methods of Research in the Study of Ancient Chinese Bronzes and Southeast Asian Metal and Other Archaeological Artifacts, Barnard, N., Ed., National Gallery, Melbourne, 1976, 35 1. 208. Ambrow, W. R., The loneliness of the long distance trader in Melanesia, Mankind, 11, 326, 1978. 209. Nelson, F., Nielson, K., Mangelson, N., Hill, M., and Matheny, R., Preliminary studies of the trace element composition of obsidian artifacts from northern Campeche, Mexico, Am. Antiquity, 42, 209, 1977. 210. Stross, F. H., Bowman, H. R., Michel, H. V., Asaro, F., and Hamond, N., Mayan obsidian: source correlation for Southern Belize artifacts, Archaeometry, 20, 89, 1978. 21 1. Bowman, H. R., Asaro, F., and Perlman, I., On the uniformity of compositionsin obsidians and evidence for magmatic mixing, J. Geology, 81, 312, 1973.
213. Thorpe, 0. W. and Thorpe, R. S., The distribution and sources of archaeological pitchstone in Britain, J . Archaeol. Sci., 11, 1, 1984. 214. Bouska, V., Banada, J., Randa, Z. and Kuncir, J., Geochemical evidence for the origin of moldavites, Geochim. Cosmochim. Acta, 37, 121, 1973. 215. Schock, H. H. and Weiskirchner, W., INAA von Moldaviten, in Proc. 5th Seminar Akrivierungsanalyse, Koln, West Germany, 1974. 216. Al-Jobori, S. M., Kettaneh, Y. A. H., and Mustafa, J. A., Determination of Si, Al, Ti, Fe and Zr in glass sand samples by 14 MeV NAA, J. Radioanal. Nucl. Chem., 1 11, 11, 1987. 217. Taure, I. Ya., Activation autoradiography, in Aktivatzionny analis (Activation Analysis). Izd. "Zinatne", Riga, 1976, 5. 218. Sidris, R. and Kimberli, J., Use of Mayan obsidian sources through time: trace element data for El Alsamo, Guatemala, J . Field Archaeology, 6, 116, 1979. 219. Van Patter, D. M., Swann, C. P., and Glass, B. P., Photon probe analysis of an irghizite and a highmagnesium Java tektite, Geochim. Cosmochim. Acta, 45, 229, 1981. 220. Yellin, J. and Perlman, I., Source obsidian rare earth patterns and obsidian artifact provenience, Rep. HUAL -7, 1980. 221. Activation Analysis in Geochemistry and Cosmochemistry, Bmnfelt, A. 0. and Steinnes, E., Eds., Universitetsforlaget, Oslo, 1971.
Volume 11
485
222. Bowman, H. R., Asaro, F., and Perlman, I., Composition variations in obsidian sources and the archaeological implications, Archaeometry, 15, 123, 1973. 223. Rybach, L. and W i n , N. -U.,Neutron activation of Mn and Na traces in marbles worked by the ancient Greeks, in Proc. IAEA Symp. Radiochemical Methods of Analysis, Vol. I, International Atomic Energy Agency, Vienna, 1965, 105. 224. Braetter, P., Moeller, P., and Roesick, U., Determination of the trace element distribution in coexisting calcite and dolomite by NAA, in 221. 225. Draskovic, R. J. and Draskovic, R. S., Determination of impurities in marbles from different deposits in Yugoslavia by activation analysis, J. Radioanal. Chem., 4, 299, 1970. 226. De Bruin, M., Korthoven, J. M., Bakels, C. C., and Groen, F. C. A., The use of non-destructive activation analysis and pattern recognition in the study of flint artifacts, Archaeometry, 14, 55, 1972. 227. Allen, R. O., Luckenbach, A. H., and Holland, C. G., The application of INAA to study of prehistoric steatite artifacts and source material, Archaeometry, 17, 69, 1975. 228. Bard, J. C., Asaro, F., and Heizer, R. F., ~er&ctives on dating of Great Basin petroglyphs by NAA of the patinated surfaces, Rep. LBL -4475, 1976. 229. Allen, R. 0. and Pennell, S. E., Rare element distribution patterns to characterize soapstone artifacts, in Archaeological Chemistry, N. Carter, G.F., Ed., Advances in Chemistry, Ser. 171, American Chemical Society, Washington, D.C., 1978, 230. 230. Ohde, S., Ohta, N., and Tomura, K., Determination of trace elements in carbonates by INAA, J. Radioanal. Chem., 42, 159, 1978. 231. Rodgers, M., Allen, R. O., Nagle, C., and Fitzhugh, W., The utilization of rare-earth element concentration for the characterization of soapstone quarries, Archaeometry, 25, 186, 1983. 232. Oddone, M., Meloni, S., and Mello, E., Provenance studies of the white marble of the cathedral of Como by NAA and data reduction, J. Radioanal. Nucl. Chem., 90, 373, 1985. 233. Genova, N., Meloni, S., Oddone, M., and Mello, E., Provenance studies of archaeological marbles by NAA and data reduction, in Proc. 7th Int. Conf. Modern Trends in Activation Analysis, Vol. I, Copenhagen, 1986, 171. 234. Moffat, D. and Buttler, S. J., Rare earth distribution patterns in shetland steatite consequences for artifact provenancing studies, Archaeometry, 28, 101, 1986. 235. Grimanis, A. P., INAA of ancient limestone sculptures, in Science in Archaeology, Jones, R. E. and Catling, H. W., Eds., British School at Athens, Fitch Lab. Occasional Paper, 2 , 17, 1985. 236. Leysen, L., Roekens, E., Komy, and Van Grieken, R., A study of the weathering of an historic building, Anal. Chim. Acta, 195, 247, 1987. 237. Robinson, H. W., A Greek head-animal or hybrid?, Bull. Cleveland Museum of Art, LXIV, 231, 1977. 238. Kohl, P. L., Harbottle, G., and Sayre, E., Physical and chemical analysis of soft stone vessels from Southwest Asia, Archaeometry, 21, 131, 1979. 239. Luckenbach, A. H., Holland, C. G., and Allen, R. O., Soapstone artifacts tracing prehistoric trade patterns in Virginia, Science, 187, 57, 1975. 240. Duffled, J. and Gilmore, G. R., An optimum method for the determination of rare earth elements by NAA, J. Radioanal. Chem., 48, 135, 1979. 241. Ariel, D. T., Sharon, I., Gunneweg, J., and Perlman, I., A group of stamped Hellenistic storage-jar handles from Dm, Israel Explor. J . , 35, 135, 1985. 242. Gunneweg, J. and Perlman, I., Hellenistic braziers from Israel: results of pottery analysis, Israel Explor. J., 34, 232, 1984. 243. Gunneweg, J., The origin of Eastern Terra Sigillata-A and Hayes "Cypriot Sigillata" (on the basis of NAA), in Proc. 13 Int. Kongr. Rei Cretariae Romanae Favtores, Munich, 1982, Studien zur Roemischen Keramik, Verlag Michael Lassleben KallMuenz, 1984, 111. 244. Gunnweg, J., Dothan, T., Perlman, I., and Gitin, S., On the origin of pottery from Tel Migne-Ekron, BASOR, 264, 3, 1986. 245. de Bruin, M., Korthoten, P. J. M., van der Steen, A. J., Houtman, J. P. W., and Duin, R. P. W., The use of trace element concentrations in the identification of objects, Archaeometry, 18, 75, 1976. 246. Aspinall, A. and Feather, S. W., NAA of prehistoric flint mine products, Archaeometry, 14, 41, 1972. 247. Aspinall, A., Feather, S. W., and Phillips, A. P., Preliminary analysis of French flint samples, in Proc. 2nd Int. Symp. on Flint, Maastricht, Nederlands, &I1 May, 1975, Engelen, F. H. C., Ed., Maastricht, Nederlandse Geol. Vereniging, 1975, 42. 248. Aspinall, A., Feather, S. W., and Phillips, A. P., Further analysis of Southern French flint, in Proc. 3rd Int. Symp. on Flint, Maastricht, Nederlandse Geol. Vereniging, 1979, 92. 249. Craddock, P. T., Cowell, M. N., Leese,M. N., and Hughes, M. J., The trace element composition of polished flint axes as an indicator of source, Archaeometry, 25, 135, 1983. 250. Bard, J. C., Asaro, F., and Heizer, R. F., Perspectives on the dating of prehistoric Great Basin petroglyphs by NAA, Archaeometry, 20, 85, 1978. 251. Goren-lnbar, N., Perlman, I., and Heiman, A., Chemical mapping of basalt flows at paleolithic sites, Archaeometry, 28, 89, 1986.
486
Activation Analysis
252. Badone, E. and Farquhar, R. M., Application of NAA to the study of element concentration and exchange in fossil bones, J. Radioanal. Chem., 69, 291, 1982. 253. Blotcky, A. J., Rack, E. P., Recker, R. R., Lefler, J. A., and Teitelbaum, S., Trace A1 determination and sampling problems of archaeological bone employing destructive NAA, J. Radioanal. Chem., 43, 381, 1978. 254. Buczko, Cs., Ilkov, N., Borbely, A., Fossil bones and the paleoclimatology, Radiochem. Radioanal. Letters, 35, 175, 1978. 255. Wessen, G., Ruddy, F. H., Gustafson, C. E., Irwin, H., Trace element analysis in the characterization of archaeological bone, in Archaeological Chemistry II, Carter, G. E., Ed., Advances in Chemistry Ser. 171, American Chemical Society, Washington, D.C., 1978, 99. 256. Edward, J., Fossey, M. J., and Yaffe, L., Analysis by neutron activation of human bone from the Hellenistic cemetery at Asine, Greece, J . Field Archaeol., 11, 37, 1984. 257. Hashiioto, T., Saitoh, H., Suzuki, H., Tonouehi, S., and Sotobayshi, T., Simplified evaluation of 214Bi/238U activity ratio in fossil bones using nondestructive activation analysis, J . Radioanal. Nucl. Chem., 94, 373, 1985. 258. Ilkov, N., Dating of archaeological objects by nuclear methods, Ph.D. Thesis, High Pedagogical Institute, Shumen, 1984. 259. Hancock, R. G. V., Grynpas, M. D., and Alpert, B., Are archaeological bones similar to modem bones? In INAA assessment, J . Radioanal. Nucl. Chem., 110, 283, 1987. 260. Braetter, P., Gessner, H., Herrmann, B., Lausch, J., and Roesick, U., Zur Identifizierung menschlicher Knochen durch neutronenaktiviemngsan~ytischebestirnmte Spurenelementverteilungsmuster,Berl. Beitr. Archaeometrie. 5, 187, 1980. 261. Carriveau, G. W., Contamination of hard-fW ceramics during sampling with diamond burrs, Archaeometry, 22, 209, 1980. 262. Attas, M., Fossey, J. M., and Yaffe, L., Corrections for drill-bit contamination in sampling ancient pottery for NAA, Archaeometry, 26, 104, 1984. 263. Riederer, J., Archaeometrie in Berlin, Berl. Beitr. Archaeometrie, 5, 7, 1980. 264. Sperl, G., Montanarchaeometrie, Wien. Ber. Natunviss. Kunst, 1, 175, 1984. 265. Barrandon, J. N., Debrun, J. L., and Kohl, A., Etude du dosage de 30 elements par activation dans les protons de 11 MeV, J . Radioanal. Chem., 16, 617, 1973. 266. Cappello, C., Katz, S. A., Padilla, L., and Williams, Ch., Determination of Au, Cu, and Ag in ancient and rare coins by NAA with u2Cf, Bull. N.J. Acad. Sci., 18, 30, 1973. 267. Heurtebii, M., Montoloy, E., and Lubkovitz, J. A., Rapid determination of matrix components by NAA: The analysis of Au alloys, Anal. Chem., 45, 47, 1973. 268. Meyers, P., van Zelst, L., and Sayer, E., Determination of major components and trace elements in ancient Ag by thermal NAA, J . Radioanal. Chem., 16, 67, 1973. 269. Caley, E., Analysis of Ancient Metals, Pergamon Press, Oxford, 1964. 270. Wyttenbach, and Schubinger, P. A., Trace element content of Roman lead by NAA, Archaeometry, 15, 199, 1973. 271. Kilikoglou, V. I., Papagiannopoulos, A., Doumas, C., and Grimanis, A., Provenance studies of Akrotiri pottery by NAA. 11. An attempt to identify middle Cycladic pottery, in Proc. Symp. Archaeometry, Smithsonian Institution, Washington, D.C., 1984. 272. Aitchison, S. and Ottaway, B. S., NAA of South German neolithic ceramics and of possible clay sources, in Proc. Symp. on Archaeometry, Smithsonian Institution, Washington, D.C., 1984. 273. Grimanis, A., Labrinoudakis, V. K., and Vassilaki-Grimani, M., Provenance studies of archaic ceramics from Naxos, Greece by NAA, in Proc. Symp. on Archaeometry, Smithsonian Institution, Washington, D.C., 1984. 274. Thiele, R. W., Aung Khin, U., and Kyaw, U., NAA of ancient Burmese silver coins with a low flux A d B e neutron source, Archaeometry, 14, 199, 1972. 275. Gordus, A. A., NAA of steaks from coins and metallic works of art, in Application of Science in Examination of Works of Art, Young, W. J . , Ed., Museum of F i e Arts, Boston, 1973, 9. 276. Reimers, P., Lutz, G. J., and Segebade, Chr., Photon activation analysis of coins and objects of art, J . Radioanal. Chem., 39, 93, 1977. 277. Brissaud, I., de Chateau-Thierry, A., Frontier, J. P., and Lagarde, G., Analysis of geological standards with PIXE and PIGE techniques applications to volcanic rocks, J . Radioanal. Nucl. Chem., 102, 131, 1986. 278. Gilmore, G. R., Analysis of ancient Cu alloys using epithermal activation techniques, J. Radioanal. Chem., 39, 113, 1977. 279. Jordan, P. and May, K., Identification of a modem imitation of an old scientific instruments by means of NAA, J. Radioanal. Chem., 39, 121, 1977. 280. Schubiier, P. A., Mueller, O., and Gentner, W., NAA on ancient Greek Ag coins and related materials, J. Radioanal. Chem., 92, 171, 1985.
488
Activation Analysis
310. Pernicka, E., Seeliger, T. C., Wagner, G., Begeman, F., Schmitt-Strecker, S., Eibner, C., Oeztunali, Oe., and Baranyi, I., Archaeometallurgische Untersuchungen in Nordwestanatolien, Jahrb. RoemischGermanischen Zentralmuseums, 3 1, 533, 1984. 31 1. Pernica, E., Archaeometallurgische Untersuchungen zur antiken Silbergewinnung in Laurion, Erzmetall, 34, 396, 1981. 312. Barrandon, J. N., Metals analysis by charged particles: evaluation and prospects, Nucl. Instrum. Methods, B14, 133, 1986. 313. Barrandon, J. N., Analyse par activation et numismatique, J. Radioanal. Chem., 55, 317, 1980. 314. Barrandon, J. N. and Brenot, C., The analysis of Constantinian coins (A.D. 313-40) by non-destructive Z52Cfactivation analysis, Archaeometry, 19, 173, 1977. 315. Reiderer, J., Multi-element-analysis in archaeometry, in Instrumentelle Multielementanalyse, Sansoni, B . , Ed., VCH Verlagsgesellschaft, Weinheim, 1985, 669. 316. Elayi, A. G., Damiani, P., CoUet, P., Gruel, K., Widemann, F., Grenier, G., and Parisot, D., 14 MeV NAA of Gaulish Ag alloyed coins, J. Radioanal. Nucl. Chem., 90, 113, 1985. 317. Pernicka, E., Wagner, G., Assmenos, K., Dournas, C., Begemann, F., and Todt, W., An analytical study of prehistoric Pb and Ag objects from the Aegean, in Proc. 22nd Symp. on Archaeometry, Aspinall, A. and Warren, S., Eds., 1982, 292. 318. Wagner, G. and Pernicka, E., Pb und Ag im Alterturn: ein Beitrag der Archaeometrie, Chemie Unserer Zeit, 16, 47, 1982. 319. Pernicka, E., Instrumental analysis and provenance of archaeological artifacts, in lnstrumentelle Multielementanalyse, Sansoni, B., Ed., VCH Verlagsgesellschaft, Weinheim, 1985, 657. 320. Gentner, W., Gropengiesser, H., and Wagner, G., Blei und Silber im aegeeischen Raum, in Mannheimer Forum 79/80, Dilfurth, H., Ed., Herausgg. von Boehringer, Mannheim, 1980, 143. 321. Pernicka, E., Wagner, G., and Todt, W., Chemische und isotopische Zusammensetzung fruehaisenzeitlicher Bleiartefakte aus Thasos, Rep. MPI H -1983-V37. 322. Gentner, W., Pernicka, E., Wagner, G., Gale, N., and Vavelidii, M., Ancient Pb and Ag production on Thasos, Greece, Rep. MPI H -1980-V5. 323. Gordus, A., NAA of streaks from coins and metallic works of art in Application of Science in Examination of Works of Art, Young, W. J . , Ed., Museum of Fine Arts, Boston, MA, 1973, 9. 324. Wyttenbach, D., Die zerstoemngsfreie, aktiviemngsandytische Bestimmung von Hauptbestandteilen in grosseren Probenstuecken (Anwendungsbeispiel: Muenzen), Helv. Chim. Acta., 49, 2555, 1966. 325. Hirao, Y., Izutani, A., Yagi, K., Kimura, K., and Mabuchi, H., Chemical compositions of western Han coins and imitative Chinese coins, Sci. Pap. Jpn. Antiq. Art Crafis, 29, 27, 1984. 326. Mabuchi, H., Notsu, K. N., Shigey, 0. F., and Keiichiro, 1. H., Chemical compositions of ancient coins, Nippon Kagaku Kaishi, V, 586, 1979. 327. Thompson, B. and Lutz, G., Characterization of bronze artifacts by neutron and photon activation analysis, 328. Wagner, G., Pernicka, E., Gentner, W., Vavelidis, M., The discovery of ancient gold mining on Thasos, Greece, Rep. MPI H -1980-V5. 329. Wagner, G., Pernicka, E., Seeliger, T., Oeztunali, Oe., Baranyi, I., Begemann, F., and SchmittStrecker, S., Geologische Uniersuchungen zur fruehen Metallurgie in NW-Anatolien, Rep. MPI-H -1984V30. 330. Segebade, Cbr., Rottlaender, R. C. A., and Carter, C. F., The analysis of trace element patterns of ancient Roman coins by activation with high energy photons, in Proc. 20th Int. Symp. Archaeometry, Paris, 1980. 331. Cojocaru, V., Ivascu, M., Beslim, C., Dimaerian, D., and Popovici, D., Monostandard activation analysis of prehistoric Cu objects, in Proc. 1st Balkan Conf. Activation Analysis, Vama, 1985, 186. 332. Bodenstedt, F. and Reimers, P., Zerstoemngsfreie Bestimmung der Legiemngsbestandteile Au, Ag und Cu von Elektronmuenzen aus Phokaia und Mytilene, Jahrb. Numismatic Geldgeschichte, XXV, 17, 1975. 333. Wagner, G. A., Pernicka, E., Gialoglou, G., and Vavelidii, M., Ancient Au mines on Thasos, Naturwissenschaften, 68, 263, 1981. 334. Pernicka, E., Bassiakos, I., and Wagner, G., Goldvorkommen und antiker Bergbau auf der Kykladeninsel Syphnos, Natunvissenschaften, 69, 39, 1982. 335. Riedel, E., Bibliographic zu Material und technologie kulturgeschichtlicher Eisenobekte, Berl. Beitr. Archaeometrie, 8, 337, 1983. 336. Wi,J. and Wasson, J. T., INAA of iron meteorites, Radiochim. Acra, 29, 45, 1981. 337. Voigt, A. F. and Abu-Samra, A., Analysis of a Damascus steel by neutron and gamma-activation, in Proc. Modern Trends in Activation Analysis, Texas, 1965, 22. 338. Segebade, Chr., Weise, H.P., and Lutz, G. J., Photon Activation Analysis, Walter de Gmyter, Berlin, 1988. 339. Hughes, M. J., Northover, J. P., and Staniaszek, B. E. P., Problems in the analysis of leaded bronze alloys in ancient artifacts, Oxford J . Archaeol., 1, 359, 1982.
-
Volume 11
489
340. Segebade, Chr. and Carter, G. F., Anmerkungen zur zerstoemngsfreien Activiemngsanalyse von anticen Muenzen, in Proc. 13 Seminar Aktivierungsanalyse, Koln, 1987. 341. Gatschke, W. and Gawlik, D., Simultaneous determination of A1 and P by NAA, J . Radioanal. Chem., 56, 203, 1980. 342. Currie, L., Limits for qualitative detection and quantitative determination, Anal. Chem., 40, 586, 1968. 343. Koeberl, Chr., Der Moldavit von Stainz und seine Beziehung zurn Moldavitstreufeld, Mitt. Abt. Miner. Landesmus. Joanneum, 54, 229, 1986. 344. Jones, R. E., Greek and Cypriot Pottery, Fitch Laboratory Occasional Paper 1, the British School at Athens, Greece, 1986. 345. Lee, C., Kwun, 0. C., Kim, N. B., and Lee, I. C., NAA of Korean clays and pottery, Bull. Korean Chem. Soc., 6, 241, 1985. 346. Cosma, C., Fiat, T., Znamirovischi, V., Darabau, L., Morariu, V., Boros, D., and Alicu, D., The determination of the Ag content in some ancient coins by using an Am-Be neutron source, in Proc. 1st Balkan Con5 ~ctivationAnalysis, Vama, 1985, 183.
Volume 11
491
Chapter 12
ACTIVATION ANALYSIS IN FORENSIC STUDIES
.
Vincent P Guinn
TABLE OF CONTENTS I.
Introduction ..................................................................... 492
I1.
Firearms-Discharge Applications ................................................492
...............................492
A.
Measurement of Primer Gunshot Residue
B.
Elemental Analysis of Bullet-Lead and Shotshell-Pellet Specimens ............................................................... 494
111.
Elemental Analysis of Other Nonbiological Evidence Materials ................498 A. Paint..................................................................... 498 B. Other Materials ..........................................................500
IV .
Elemental Analysis of Biological Evidence Materials ...........................500 A. Multielemental Analysis of Hair Specimens .............................500 B. Analysis of Hair for Arsenic and Mercury ..............................501
References .............................................................................. 502
492
Activation Analysis
I. INTRODUCTION It is not surprising that reactor-flux neutron activation analysis (NAA) has a number of important applications in the field of scientific crime investigation. The reasons for this are the great sensitivity of detection it offers for a large number of elements, and its very good accuracy, precision, and specificity. In addition, the purely instrumental form of the method (INAA) offers the advantages of a nondestructive method and of simultaneous detection of many elements. This last feature is important in applying the principle of trace-element characterization to determine probability of common origin of evidence specimens. Inspired by the early work in forensic INAA in Toronto by R. E. Jervis and A. K. Perkons' on the multielement analysis of human head hair, the author and co-workers soon embarked on a broad study of possible forensic applications of the NAA method. This study commenced in 1962, at the author's previous laboratory (General Atomic), and was completed in 1970. Since that time, the author and his students have extended these studies further, at the University of California at Irvine. Since the early 1970s, these forensic NAA applications have been used in the U.S. in the investigation and prosecution of many hundreds of criminal cases, by a number of laboratories -especially by the Federal Bureau of Investigation (FBI) Laboratory, in Washington, D.C., and by the author. The results have been presented in U.S. courts in hundreds of cases. The various kinds of applications are each described in the following sections, grouped into three categories.
11. FIREARMS-DISCHARGE APPLICATIONS Since many criminal cases involve the discharge of firearms (revolvers, pistols, and shotguns), there was a real need for the improvement of earlier inadequate methods for the detection of gunshot residue, and for the characterization of evidence specimens of bullet lead (BL) and shotshell pellets (SSP). Forensic NAA methods have greatly advanced the definitiveness of investigations in these areas.
A. MEASUREMENT OF PRIMER GUNSHOT RESIDUE When a person discharges a firearm, most of the smoke (consisting of millions of tiny particles of incompletely burned gunpowder and of materials from the detonated cartridge primer) comes out of the muzzle of the gun barrel in the forward direction. However, smaller amounts of the smoke are ejected in the sideways and backward directions, from small openings between the moving parts of the gun. A very small fraction (only about 0.01%) of the primer particles from a firing fall on the back of the gunhand. Unless the gun has been previously wiped clean from earlier firings, the mere handling of a gun can transfer gunshot-residue (GSR) particles to the palm of the hand, especially by contact with the muzzle end of the gun barrel. Up well into the 1950s, a method for the detection of GSR on the hands of a suspect (or victim) widely used by crime laboratories was the so-called "paraffin test" (also variously called the paraffin-glove test, the dermal-nitrate test, and the Gonzales test). This test is based on the blue color formed when an aqueous solution of diphenylarnine and sulfuric acid contacts particles of gunpowder (nitrocellulose/nitroglycerine), if present, removed from the back of the hand via solidified molten paraffin. After being used for some years, this test was discarded because of its lack of specificity, its insensitivity, and its only qualitative GSR, this one aimed at detecting three elements that are constituents of the primers of most
Volume I1
493
centerfire cartridges: Ba, Sb, and Pb (present in the primers as barium nitrate, antimony sulfide, and lead styphnate). In this test, aliquots of a few drops each of dissolved handswab sample are viewed in three cups of a spot plate as three different reagents are added, each giving a particular color reaction for the presence of ions of Ba, Sb, and Pb. Unfortunately, this different approach was soon found to have the same shortcomings as the paraffin test, and hence was also soon abandoned. In 1962, the author and colleagues decided to look for Ba and Sb in handswabs by reactor-flux NAA, thus providing a much more sensitive, specific, and quantitative method for the detection and measurement of these two elements that are constituents of most cartridge primers. This soon proved to be a good approach, and it was developed extensively as part of an 8-year study of forensic applications of the NAA method. A large number of test-firings of handguns of a variety of types and calibers, with various brands of arnmunitions, revealed that (1) the amounts of Ba and Sb deposited on the back of the firing hand in a single shooting, although only in the microgram range, were readily measured by NAA, (2) most of the GSR deposited on the back of the firing hand was in the area of the back of the thumblback of the index fingerlthumb-web area between the two, (3) the deposited GSR was easily removed by either a cotton swab moistened with a 5% solution of nitric acid or by solidified molten paraffin, (4) appreciably smaller, but still readily measured, amounts of Ba and Sb (usually in the range of tenths of a kg of Ba and hundredths of a ~g of Sb) could be found even in samples from nonfiring hands (so-called "occupational handblank" samples), (5) the amounts of GSR deposited were quite variable, even in replicate firings of the same gun with the same ammunition, and (6) BaISb weight ratios in the range of about 111 to 611 were characteristic of deposited GSR, as opposed to the appreciably higher ratios of about 1011 to 3011 characteristic of handblank samples. Typical GSR values are in the range of 1 to a few pg of Ba, plus several tenths of a kg to about 1 ~g of Sb. In the NAA procedure for the detection and quantitation of GSR, it was found necessary to employ a radiochemical separation, with carriers, of the Ba and of the Sb, rather than INAA, due to the relatively large amounts of Na and C1 present in hand samples. Typically, Ba is separated as BaSO, and Sb as Sb2S3,with Ba measured via the 166 keV y-ray of 82.9-min 139Ba,and Sb via the 564 keV y-ray of 2.70-d 12*Sb.Carrier yields are usually measured by reirradiation, or by use of added radiotracers (10.74-year 133Baand 2.73-year lZ5Sb). This study of GSR was eventually summarized, along with the detailed results, in a 144-page U.S. Atomic Energy Commission special report in 1970.2 The NAA procedure has been used extensively since then by various forensic groups (such as the author's) and particularly by the FBI Laboratory. The extensive case work of the latter group is a good example of the fact that possession of a nuclear reactor is not necessary for such work, so long as one has regular access to a nearby reactor (the FBI uses the National Bureau of Standards reactor, about 20 miles away). The excellent FBI Laboratory NAA procedure for GSR swabs has been published in detail by kilt^.^ During the 1970s, two additional methods for the detection of GSR were developed and published, competing with the NAA method. One is an atomic absorption spectrophotometry (AAS) method, to detect and measure the amounts of Ba, Sb, and Pb in handswabs. Its advantages are that (1) it only involves moderate-cost equipment, available in many crime laboratories, and (2) it measures the additional element lead in handswabs. Its shortcomings are (1) it is appreciably less sensitive than the NAA method for Ba and Sb, (2) lead is such a common environmental contaminant that its detection does not add much information of value, and (3) it is actually more time-consuming than the NAA method. The second newer method is the particle-analysis method, in which sticky-tape lifts from the hand surfaces are examined by scanning electron microscopy, with an energy-dispersive X-ray emission spectrometer (SEMIEDX). Its advantage is that it identifies the elements Ba, Sb, and Pb as
494
Activatim Analysis
constituents of particles. A typical "unique" GSR particle is one of spheroidal shape, 1 to 10 pm in diameter, containing percentage amounts, each, of Ba, Sb, and Pb. Its disadvantages are that (I) it typically finds few, if any, "unique" GSR particles even in a test-firing lift (and larger numbers of "characteristic", but not unique, particles that contain only one or two of the three elements), (2) examination of an individual lift often takes hours of time, (3) the SEMIEDX equipment is expensive (>$100,000), and (4) although it detects particles, it does not measure the total mass of any of the three elements present in a sample. All three of the GSR analysis methods in current use suffer from some limitations: (1) the hands of the suspect are often not sampled soon enough after the shooting to have sufficient GSR still present (if initially present) for detection, (2) any GSR initially present is readily removed by wiping, rubbing, or washing? (3) even if GSR is definitely found to be present (or, in the bulk analysis NAA or AAS procedure, to be present in amounts and ratios consistent with the hand-deposition amounts typical of a fkng), the results cannot ascertain how the GSR was acquired by the hand (e.g., by firing a gun, by being close to a discharging gun, by handling an uncleaned gun, by touching surfaces on which GSR was present, etc.), (4) there is a wide variability of GSR deposition on the firing hand even from a particular gun, with a particular ammunition, and under the same external conditions, such as wind direction and speed, (5) possible contamination of swabs or lifts with non-GSR occupational or environmental materials that contain one or more of the three elements can occur, and (6) there are difficulties with samples from the firing of 0.22-caliber rimfue cartridges (only one of the major U.S. brands containing both Ba and Sb in their primers5). Despite these difficulties, all three of these GSR detection methods are very useful in the investigation of gunshot criminal cases, and are far superior to the old and discarded "paraffin test" and Harrison-Gilroy test - but their results require careful interpretation.
B. ELEMENTAL ANALYSIS OF BULLET-LEAD AND SHOTSHELL-PELLET SPECIMENS In gunshot criminal cases, evidence specimens of BL andlor SSP are frequently obtained from the bodies of surviving or deceased victims. If relatively undamaged bullets or large BL-fragment samples are available, as well as the weapon involved in the shooting, comparison microscopy may be able to ascertain whether or not a given fatal or injury bullet was fued from that particular gun barrel, by "toolmark examination" of the microscopic markings in the land-and-groove areas impressed on the bullet from the victim, compared with those on bullets test-fired from the recovered gun. In the great majority of cases, however, this determination is not feasible, because the victim specimens are too damaged or fragmented, the particular gun and ammunition combination does not impart sufficient characterizing markings on the bullets, or the gun is not recovered. In such instances, an elemental analysis of the victim bullets and BL specimens from u n f i d cartridges associated with a suspect or defendant can ascertain whether or not the victim bullet(s) and any of the unfued ones were produced from the same batch (melt) of bullet lead. Since SSP are fied in smooth-bore shotgun barrels (rather than rifled barrels, with land and grooves, used in revolvers, pistols, and rifles), no characterizing marks are imparted to the pellets in a firing, and hence only elemental analysis can be of much help. In the commercial production of revolver, pistol, and rifle cartridges, lead bullets of a desired composition, shape, and mass are produced, and then (immediately or later) each is coupled with a brass or nickel-plated brass cartridge case that contains the gunpowder and a primer, to make a complete cartridge (or "round"). These are then put into boxes of 20, 50, or 100 cartridges, ready for shipment to gun shops that order them. The label on each box gives a production lot number, the manufacturer's name, the tradename of the particular type of cartridge in the box, and some other particulars. One lot may include bullets from a single homogeneous melt of lead (hence having a particular characterizing
Volume 11
495
elemental composition), or from a few different fairly similar melts of lead produced or used at about the same time. A typical homogeneous melt of bullet lead is of the order of one metric ton (1000 kg). Neglecting any losses, this is enough to make about 98,000 158grain indistinguishable bullets (1 g = 15.432 grains), i.e., a typical 0.38-caliber bare-lead bullet. About 90% of all bullets are made of antimony-hardened lead, in which the lead has been hardened by alloying it with some nominal concentration of Sb (usually in the range of about 0.5 to 4.0%). To produce a particular kind of hardened bullet, the cartridge manufacturer usually orders a supply of bullet lead from a lead supplier to contain a specified nominal Sb concentration (e.g., of 0.5, 0.75, 1.O, I S % , etc.). The actual Sb concentration in the bullet lead then supplied is usually within about + 10% of the specified concentration. Both virgin lead and recycled scrap lead are used for making bullet lead, and hence a particular shipment of hardened bullet lead contains not only the specified nominal concentration of Sb, but also much lower concentrations of various uncontrolled impurity elements, especially of Ag, As, Cu, and Sn. Each batch (or melt) of hardened bullet lead is characterized by its Sb concentration and its particular lower concentrationsof these four impurity elements. Among almost all samples of bullet lead that have been analyzed (made by various manufacturers, in various kinds of bullets, and in various production batches), the Ag levels are usually in the range of about 1 to 100 ppm, the As levels in the range of about 1 to 2500 ppm, the Cu levels in the range of about 1 to 1500 ppm, and the Sn levels in the range of about 10 to 2000 ppm. Throughout each of the possible element concentration ranges, INAA can measure each of the concentrations to a very good or at least useful precision and accuracy. The other 10% or so of bullets are made of soft lead, not hardened by the addition of Sb. Typically, such soft leads still contain some Sb (e.g., in the range of about 1 to 1500 ppm), but now present only as an uncontrolled impurity, plus the other four impurity elements mentioned above. A typical manufacturing procedure for the production of bullets is to extrude "pigs" of lead (about 80 lb each) into "bullet wire" of the desired diameter, cut the wire to the desired length (to make bullets of the desired mass), press each to the desired shape, polish each to remove irregularities, and then either assemble them into complete cartridges or store them in bins for later assembly into cartridges. In the case of some kinds of jacketed bullets, the procedure is different - molten bullet lead being poured into the jackets ("copper" jackets are usually made of brass: 90% Cu/lO% Zn or 9515, or steel, in the case of some military ammunition). In general, the whole cartridge-manufacturing process is highly automated. The manufacture of shotshells is quite different, although the elemental compositions of the pellets are similar to the elemental compositions of bullets, except that arsenic is deliberately added (usually along with Sb) to the molten lead, at levels in the range of about 0.1 to 2.0%, to adjust the surface tension of the molten lead so as to form more perfectly spherical drops while falling through the drop tower. Drop size, and hence pellet mass, is controlled by use of a sieve having holes of the desired diameter at the top of the drop tower. The spherical pellets solidify as they fall through the air in the tower and are then further cooled in water and sorted further by sieving. In the preparation of analytical samples from evidence specimens of BL or SSP, two main procedures are in use. In one, small samples (10 to 30 mg) are simply cut from the specimen with a surgical scalpel (or drilled out with a steel drill) and then accurately weighed into a small polyethylene vial. Even though such cuttings are irregular in shape, measurements in the author's laboratory show that, in order to make accurate small corrections for gammaray self-attenuation(absorption plus Compton scattering) in the calculations from the counting data, such cuttings can be treated as equivalent parallelopipeds, of dimensions X, X, and 2X, where X is the sample thickness and XI2 is the effective mean pathlength of gamma
496
Activation Analysis
rays in the sample (YI, = ecpWZ).The thickness X (in centimeters) is calculated from the sample weight (in grams): X = [ ~ / 2 2 . 7 0 ] ~In ' ~ .the other procedure, a larger sample is taken (100 to 200 mg), then pressed into a thin wafer from which small circular disks are cut, with a "cookie-cutter" device, each disk weighing in the range of 10 to 20 mg (each sample then also accurately weighed). In the case of copper-jacketed bullets, care must be taken not to contaminate the analytical lead sample with any of the copper-jacket material, since Cu intrinsically dissolved in the lead is one of the elements of analytical interest. Before cutting or drilling in the area of the specimen from which analytical samples are to be taken, the area is first scraped clean with a surgical scalpel, exposing shiny lead. Microscopic examination is used to detect (then remove) any observable contamination by jacket. Tiny surface specks of adhering jacket material can be dissolved away, if necessary, by a brief immersion in concentrated nitric acid, without altering the composition of the lead. For the INAA of small samples of BL or SSP, two main procedures are used. In one procedure, the longer one, many samples (and samples of a BL standard) are activated in the reactor at the same time, allowed to decay for some hours, and then counted sequentially with a Ge(Li) or intrinsic Ge multichannel gamma-ray spectrometer. Typical irradiation conditions are 60 min at a thermal-neutron flux of 1012n cm-2 s-I or 5 min at 1013n c r c 2 s- ' . With such activated samples, the principal photopeaks observed are those of 12.7 h Y U , 26.3 h 76As,and 2.70 d lZ2Sb.The peaks usually measured for quantitation are the 51 1 keV positron-annihilation peak of T u , the 559-keV (or smaller 657-keV) peak of 76As, and the 564-keV peak of lZ2Sb.In typical samples, the concentrations of each of these three elements can be measured to precisions of 2 1 to a few percent of the values. In the calculations, decay corrections must of course be made, and small corrections may be needed for pulse pileup, gamma-ray self-attenuation, and counting geometry (the latter two are not needed if all the samples and standards have the same thickness, as in disk samples). Livetime counting is used, so no correction for analyzer deadtime is needed. The second procedure is a rapid-scanning procedure,' employing a pneumatic transfer system and activating and counting one sample at a time. In the author's laboratory, irradiation times, decay times, and counting times each equal to exactly 40 s are used (at a - ~Since each sample and standard is treated thermal-neutron flux of 2 X 10" n ~ m s-I). identically, no decay corrections are needed in the calculations. The purpose of this procedure is to very rapidly (3 rnin per sample, in practice) reveal any large differences in elemental composition among numerous specimens involved in a given case. This fast method was developed by the author some years ago, when it was necessary to screen more than 150 BL samples from a particular case. If this fast method (measuring Sb, Ag, and Cu) clearly shows that none of the victim specimens match any of the specimens associated with a suspect, in elemental composition, no further analyses are needed. However, if one or more of the victim specimens appears to match one or more of the suspect samples, an additional analysis is called for (the longer procedure discussed earlier), to add a fourth element (As) to the comparison, and to provide better measurement precision for the Sb and Cu than is provided by the rapid-screening procedure for soft-lead samples (low Sb) and lower than typical levels of Cu. In this fast procedure, the most prominent peaks in the Ge pulse-height " 1 the 658-keV spectrum are the 498-keV, 603-keV, and 646-keV peaks of 93.0 ~ ' ~ ~ Sb; peak of 24.6 s "OAg; and the 1039-keV peak of 5.10 m Tu. Usually, smaller peaks are also observed at 51 1 keV (12.7 h V u ) , 564 keV (2.70 d lZ2Sb),and 633 keV (2.37 m 108Ag). A fifth element of interest, tin, can be detected and measured in BL and SSP samples, but is not as easy, and requires a different set of conditions than those used in the fastscanning procedure (Ag, Sb, Cu) or in the longer procedure (Sb, Cu, As). The difficulty arises from the inconvenient halflives of its two main (q,y) products (40.08 m lZ3"Sn and 9.52 m 125mSn) - too long for the usual fast-scanning procedure, too short for the usual
Volume I1
497
longer procedure. In the author's laboratory, an intermediate procedure5has been developed and tested that allows one to measure simultaneously all five elements (Sn, Ag, Sb, Cu, and As) in most BL and SSP samples to good or fair precision. The optimum pneumatictube conditions were found to be an irradiation time (ti) of 3 min, followed by a decay period (t,) of 5 min, and then a counting period (t,) of 3 min. With this intermediate procedure, the principal peaks used are those of 9.52m L25mSn (332 keV), 2.37 m lo8Ag (633 keV), 93.0 s124m1 Sb (603 keV), 5. 10m "Cu (1039 keV), and 26.3 h 76As(657 keV). Although t,, t,, and t, add up to 1I min, it is feasible to analyze samples at the rate of 1 sample per 7 min. This is accomplished by activating one sample while the preceding sample is decaying, and the sample before that is being counted. Returning to the discussion of the longer procedure, some additional comments should be made. One is that it is very helpful to have an exceptionally high resolution detector, in order to resolve the 559-keV 76Aspeak from the (usually much larger) 564-keV '22Sbpeak. Although one can instead use the 657-keV peak of 76Asto measure As, this peak is only about '1, as large as the 559-keV peak. Even the 657-keV peak of 76Asis not unambiguous in samples of very low As content (e.g., in the range of about 1 to 10 ppm As), since it is indistinguishable from the 658-keV peak of 249.8 d 'lomAg(657.1 keV vs. 657.7 keV). At typical Ag levels in BL and SSP samples (15 to 45 ppm Ag), the "OmAg produces an apparent one to a few ppm As, the exact value depending mainly upon the decay time and the actual Ag concentration in the sample. Another point of interest is that, in the longer procedure - if there is an appreciable fast-neutron flux in the sample-irradiation position - very small, but quite measurable peaks of 66.9 m 2"mSb, formed by the '"Pb (n,nl) '""Pb reaction, appear in the pulse-height ~pectrum.~ These peaks are at 375 keV, 899 keV, and 91 1 keV. In the case of metallic samples not known for sure to consist mainly of lead, measurement of these peaks (typically) enables one to measure the Pb concentration to a precision of about & 5%. Although more thoroughgoing statistical criteria can be employed, it is usually adequate to say that two BL or SSP samples "match" one another, in their concentrations of a particular element, if the two values overlap in their 5 1s ranges, where 1s is the onestandard-deviation total measurement precision of each value, i.e., not just the countingstatistics standard deviation. If replicate measurements (e.g., three) are made from samples taken from a given specimen, the s,, is usually larger than the s,,,, and can be used as the overall s. With just a few replicates, however, s,, can fortuitously be less than s,,, . In such cases, s,, is a better estimate of the overall s. It should also be noted that, for very low concentrations of a particular element, i.e., near 0 ppm, some negative NPPC values are often observed in replicate measurements. Such values are to be expected statistically (even though it is obvious that negative concentrations are not possible), and should be included as negative values in determining the mean NPPC (and hence derived ppm concentration value) and its s,,,. Such negative values should not be discarded or calculated as zero values. If one is to conclude that two BL or SSP specimens "match" one another to the extent that, to a high degree of probability, they had a common lead-melt origin, they must "match" one another in their concentrations of each of a number of elements measured to a reasonable precision, and not exhibit any significant mismatches. If the concentration of any particular element is so low that its relative s exceeds 33% of the value, it is of little use in the estimation of overall "matching". For a variety of reasons, it is presently not possible to calculate a numerical probability that any two specimens had a common lead-melt origin. Instead, assuming that they do not mismatch in any element, but only match one another in one or two measured elements, one usually merely states that they might have had a common origin; with three matching elements, that they probably had a common origin; and with four, five, or six matching elements, that there is a very high probability (approaching "certainty ") that they had a common origin.
498
Activation Analysis
At the present time, there appears to be only one other method of elemental analysis that competes with INAA for BL and SSP specimens, the method of inductively coupled plasma atomic emission spectroscopy (ICP-AES, or simply ICP). As shown by Peters et al.9 of the FBI, this method is capable of measuring six elements (Sb, Cu, As, Bi, Ag, and Sn) in samples of such specimens. However, (1) it requires appreciably more sample than does INAA, (2) it requires complete acid-dissolution of the sample (which is sometimes difficult), (3) it is destructive, rather than nondestructive, of the sample, and (4) it is appreciably less sensitive than INAA for As and Sb. In its favor, it measures Bi (not measurable by INAA), and it measures Sn more easily than does INAA. At medium to high concentrations, the measurement precisians, for the five elements measurable by both methods, are comparable ( r a few percent s,,). The ICP-AES equipment costs appreciably more than a Ge gamma-ray spectrometer, but of course not as much as a research-type nuclear reactor. Fortunately, fairly recently the U.S. National Bureau of Standards has prepared and issued an NBS Standard Reference Material Bullet Lead (SRM-C2416) that is very useful as a standard in the INAA (or ICP) of BL and SSP samples. At present, it is certified to contain 0.79 r 0.01% Sb, 560 k 10 ppm As, 650 + 20 ppm Cu, 44 a 2 ppm Ag, 900 2 100 ppm Sn, and 1000 r+- 100 ppm Bi. The INAA procedure has been used to advantage in many hundreds of criminal cases involving BL or SSP specimens in the U.S., including some very well-known cases (e.g., Many aspects of BL manufacture and the the President John F. Kennedy as~assination).'~ INAA of BL evidence specimens have been given elsewhere by Guinn. l1 The INAA of SSP has been discussed by Guinn et al.' The earlier study of BL by INAA was published in a U.S. Atomic Energy Commission (USAEC) special report.12
111. ELEMENTAL ANALYSIS OF OTHER NONBIOLOGICAL EVIDENCE MATERIALS The INAA of BL and SSP evidence specimens has been discussed, above, in some detail, because of its importance and extensive use. However, it is only one example of the effectiveness of INAA to determine the major/minor/trace-elementcomposition of evidence specimens of virtually any kind of evidence material that is manufactured or occurs naturally. The results of such multielement analyses then enable one to compare two evidence specimens in order to establish the probability that they did, or did not, have a common origin. The forensic INAA of a number of manufactured materials of forensic interest has been researched, and used in the investigation of many criminal (and some civil) cases. In this connection, paint, glass, and paper should be mentioned particularly, although metals, plastics, oils, greases, safe insulation, etc. are also often of interest. Many of these forensic NAA applications have been reviewed by Guinn.13 If a neutron activation analyst embarks into forensic investigations, it is essential that he or she not only be quite competent in the field of NAA, but also be reasonably knowledgeable in the broad field of forensic science and the law, and (in the case of manufactured materials) the manufacturing operations used to produce such materials. To illustrate this point, only one of the above kinds of manufactured materials, paints, will be discussed here in some detail. A. PAINT Evidence specimens of paint occur fairly often in criminal cases, e.g., in cases of forced entry, hit-and-run, etc. In such cases, the forensic chemist usually needs to compare crimescene evidence specimens with paint specimens associated witha suspect (e.g., specks of paint on his clothing, or on the bumper of his car), to establish whether or not they have a common manufacturing origin.
Volume 11
499
Various non-NAA techniques are available, and used, for the comparison of evidence specimens of paint. If they are sufficiently conclusive, NAA is not needed, but if they are not, INAA can be very useful. In the non-NAA techniques, microscopic examination is usually the first technique employed. If a "jig-saw" fit of two paint specimens is possible (which it is only in rare instances), no further comparison is really necessary. However, if multilayer paint specimens are involved, the microscopic examination can also ascertain whether two specimens have identical layer structures, the same sequence of paints of different colors and thicknesses. Again, if many layers of paint are involved, and they match perfectly, no further comparison is really needed. If paint specimens of only one or a few layers are involved, other examinations are often necessary. A one-layer paint specimen (or each layer split from a two- or three-layer specimen) is then examined for color and thickness, and possibly for solubility in selected solvents. Additional methods, such as infrared absorption and X-ray diffraction, may also be employed. If such methods give results that indicate the possibility that two evidence specimens of paint may have a common manufacturing origin, but do not prove that they do, methods of elemental analysis are then called for. In earlier years, emission spectroscopy was frequently employed, but its lack of precise quantitation has caused it to be replaced by such newer methods as X-ray fluorescence (XRF), particle-induced X-ray emission (PIXE) , atomic absorption spectroscopy (AAS) , ICP-AES, SEM/EDX, or INAA. Depending on the nature and size of the available evidence specimens of paint, and on whether a nondestructive analysis is required, various of these methods may be helpful, but INAA generally excels in detection sensitivity, specificity, nondestructive character, and measurement precision, for a large number of major, minor, and trace elements commonly present in paints. (Characterization of the organic material in a sample of dried paint is frequently carried out by the method of pyrolysis gas chromatography.) A typical organic liquid paint is a suspension of finely ground solid particles of pigment and fillers/opacifiers, etc. in a liquid medium consisting of an organic solvent in which the "vehicle" and oxidation catalysts are dissolved. When the paint is applied to a surface and allowed to dry, the solvent evaporates off, leaving a film that contains the other ingredients. During the drying process, the vehicle reacts with oxygen from the air and polymerizes to a solid film. The INAA method does not measure the organic material, but instead detects and measures numerous major, minor, and trace elements that are present in the sample, from the other ingredients that are present (pigments, fillers, opacifiers, and catalysts). Common-origin characterization requires not only matching concentrations of major and minor elements, but also impurity trace elements. In a major study of the forensic INAA of dried paint samples, conducted at General Atomic, the author and his colleagues analyzed samples of a large number of kinds of commercial paints (from different manufacturers and production batches, and of different types and colors). The results were published in a 26 1-page U. S. Atomic Energy Commission report.14 In toto, 37 different elements were detected and measured, a typical sample giving values for 15 elements. In general, paint samples of a given color, but made by different manufacturers, show measurably different elemental compositions of even some of the major and minor elements. Paint samples of a given color and brand name, made by a given manufacturer in different batches at different times, may match well in their concentrations of the major and minor elements present, but exhibit measurable differences in their traceelement concentrations from one batch to the next. The trace elements are generally present as uncontrolled impurities in the raw materials used (pigments, fillers, and opacifiers, particularly), which stocks usually vary somewhat from batch to batch. It is of interest to note that INAA has also been used to advantage in the field of art in many cases detecting and measuring elements in very tiny samples of paint removed from paintings that can show in some cases that a given painting is a forgery.
500
Activation Analysis
B. OTHER MATERIALS The forensic INAA of quite a few other kinds of manufactured materials often encountered as physical evidence in criminal and civil cases have also been studied, as mentioned earlier. In general, numerous major, minor, and trace elements can be detected and measured by INAA in even tiny samples, and the results then used to assess probability of common, or noncommon, origin. A special report to the USAEC was published on paper.I5 It should be remarked that the same technique of elemental-compositioncharacterization by INAA, as to probability of common origin, used in the study of evidence specimens of manufactured materials (e.g ., BL, paint, paper, etc .), also is applicable to nonbiological evidence specimens of natural origin (e.g., soils). In all applications to either manufactured or natural materials, it is important that each sample analyzed be a representative one. Due to the small available samples, in some cases, this can be a difficult requirement to satisfy if the evidence material is not quite homogeneous at this level.
IV. ELEMENTAL ANALYSIS OF BIOLOGICAL EVIDENCE MATERIALS INAA has also been applied to the elemental analysis of various kinds of biological materials encountered as physical evidence specimens in criminal cases - examples being human head or pubic hair, fingernails, and marijuana. The most extensively studied of these, hair, will be discussed here.
A. MULTIELEMENTAL ANALYSIS OF HAIR SPECIMENS Single strands or clumps of human head hair or pubic hair (in the case of sexual attacks) are often encountered as physical evidence in cases of struggles. In typical cases of this type, standard crime laboratory microscopy examinations of hair strands from the crime scene are usually compared with specimens from victim and suspect. Such examination can establish whether a given strand (1) is a strand of mammalian hair (vs. a synthetic or natural fiber), (2) is a strand of human hair (vs. animal hair), (3) is from the head, pubic, or other region of the body, (4) was a living, growing hair at the time it separated from the follicle (if the root end is available for examination), (5) was from a person of caucasian, negro, or oriental extraction, (6) is of dyed or natural color. Such microscopy examination also can determine a number of physical parameters of forensic importance: parameters such as color, curl, mean diameter, scale pattern, medulla pattern, etc. With further effort, even the ABO blood type of the individual can be determined from even a single strand of hair but, in general, sex and age cannot be determined. If the victim and suspect hair specimens differ significantly in any of these properties, it can be concluded that the specimens did not come from the same person. However, if they do not differ significantly, it can only be concluded that they might be from the same person. In an effort to utilize the possibility of trace-element composition to make forensic hair comparisons more definitive, Perkons and Jemis1 employed INAA to analyze head-hair samples from 1000 Canadians. In toto, they were able to detect and measure some 22 trace elements in the rather large (about 5 mg each) samples they analyzed. Many of these elements exhibited wide concentration ranges when all the samples were compared, in most cases exhibiting a log-normal type of distribution (frequency of occurrence vs. log of ppm concentration). Their findings led to optimism that the INAA comparison of evidence specimens of human head hair could establish, to a high degree of probability, that two evidence specimens were indeed from the same person. Unfortunately, even though being of considerable importance in stimulating INAA multielement studies of other kinds of evidence materials, application of the technique in actual criminal cases involving hair specimens was soon found to be fraught with numerous com-
Volume 11
501
plications. Some of these complications are that (I) even on a given person's head, there is an appreciable variation in elemental composition from strand to strand, (2) living, growing hairs usually differ appreciably in composition from dead (no longer growing) hairs from the same person, (3) even living hairs from a given person vary in composition along the length of a hair strand, (4) the hair of a given person changes in elemental composition with time, as the hair continues to grow, and (5) single strands often have to be analyzed, making fewer elements measurable and accentuating the difficulties of the strand-to-strand variability in composition. Despite these problems, in a few criminal cases in which these complications were minimal, successful applications of the INAA approach have been achieved. It should also be remarked that, although far less information is available on pubic hair (as opposed to head hair), it is generally found that the elemental composition of the pubic hair of a given person differs appreciably from that of his or her head hair. The INAA of human head-hair samples (larger samples) has proved to be of value in nonforensic studies, showing effects of race, heredity, diet, and environmental pollution. A large-scale study of this type has been published by the International Atomic Energy Agency.l6
B. ANALYSIS OF HAIR FOR ARSENIC AND MERCURY The earliest forensic NAA examples in criminal cases were a few involving the NAA of hair specimens for the single element, arsenic, in cases of suspected chronic arsenic poisoning. The most notable of such early cases is the investigation of the possibility that Napoleon died of arsenic poisoning. This study, conducted in Scotland by Hamilton some 150 years after the death of Napoleon, revealed that Napoleon did indeed ingest significant amounts of As at various times during the last 5 years of his life, while he was in exile. In some sections of some of his authenticated and dated head-hair specimens, concentrations of As as high as 40 ppm were found - compared with normal levels of only about 1 ppm. The results, when published, caused some people to conclude, erroneously, that Napoleon had been murdered, by arsenic poisoning, by the British, who supervised his exile. However, the same authors were able to show that (1) the As levels in his hair never reached values that would indicate lethal doses, and (2) his As input could be traced to Ascontaining medicines that he was taking, in efforts to cure his numerous illnesses. In this classic study, Smith activated the hair samples in a nuclear reactor at Harwell (some 400 miles from Glasgow); had the activated samples flown to Glasgow; sectioned them into I-rnm pieces (commencing from the root ends); radiochemically separated the arsenic present in each sample, with arsenic carrier; and then performed P- counting on each to determine its content of 26.3-h 76As. In general, samples exhibited several Asconcentration peaks along their length, of different magnitudes. From the approximate average growth rate of human head hair (about 0.3 mmld), he was able to ascertain certain times when Napoleon had ingested a significant amount of arsenic. Since the time of these earlier studies, INAA has been used in quite a few cases of suspected chronic arsenic poisoning, first via NaI (TI) gamma-ray spectrometry, and in more recent years via Ge gamma-ray spectrometry. Arsenic compounds have long been used to poison people, and still are used even today. In some instances, mercury compounds have also been used in poisoning cases, and the mercury levels in samples of hair then measured by INAA.
502
Activation Analysis
REFERENCES 1. Perkons, A. K. and Jervis, R. E., 3. Forensic Sci., 7, 449, 1962. 2. Schlesinger, H. L., Lukens, H. R., Guinn, V. P., Hackleman, R. P., and Korts, R. F., Special Report on Gunshot Residues Measured by Neutron Activation Analysis, USAEC Report GA-9829, U.S. Atomic Energy Commission, Washington, D.C., 1970. 3. Kilty, J. W., Crime Lab. Dig., 13, 54, 1986. 4. Kilty, J. W., J. Forensic Sci., 20, 219, 1975. 5. Guinn, V. P., Fier, S. R., Heye, C. L., and Jourdan, T. H., 3. Radioanal. Nucl. Chem., Articles, 114, 265, 1987. 6. Izak-Biran, T., Guinn, V. P., and Purcell, M. A., J. Forensic Sci., 25, 374, 1980. 7. Guinn, V. P. and Purcell, M. A., J. Radioanal. Chem., 39, 85, 1977. 8. Izak-Biran, T. and Guinn, V. P., Trans. Am. Nucl. Soc., 28, 94, 1978. 9. Peters, C. A., Havekost, D. G., and Koons, R. D., Crime Lab. Dig.. 15, 33, 1988. 10. Guinn, V. P., Anal. Chem., 51, 484A, 1979. 11. Guinn, V. P., J. Radioanal. Chem., 72, 645, 1982. 12. Lukens, H. R., Schlesinger, H. L., Guinn, V. P., and Hackleman, R. P., Forensic Activation Analysis of Bullet-Lead Specimens, USAEC Report GA-10141, U.S. Atomic Energy Commission, Washington, D.C., 1970. 13. Guinn, V. P., Applications of Nuclear Science in Crime Investigation, in Annual Review of Nuclear Science, Vol. 24, Annual Reviews, Palo Alto, CA, 1974, 561. 14. Schlesinger, H. L., Lukens, H. R., Bryan, D. E., Guinn, V. P., and Hackleman, R. P., Forensic Neutron Activation Analysis of Paint, USAEC Report GA-10142, U.S. Atomic Energy Commission, Washington, D.C., 1970. 15. Lukens, H. R., Schlesinger, H. L., Settle, D. M., and Guinn, V. P., Forensic Neutron Activation Analysis of Paper, USAEC Report GA-10113, U.S. Atomic Energy Commission, Washington, D.C., 1970. 16. Ryabukhin, Yu.s., Ed., Activation Analysis of Hair as an Indicator of Contamination of Man by Environmental Trace Element Pollutants, IAEA/RWSO, International Agency Energy Agency, Vienna, 1978. 17. Forshufvud, S., Smith, H., and Wassen, A., Nature, 192, 103, 1961. 18. Smith, H., Forshufvud, S., and Wassen, A., Nature, 194, 725, 1962.
Volume 11
503
Chapter 13
ACTIVATION ANALYSIS OF AIR PARTICULATE MATTER
.
.
A Alian and B Sansoni
TABLE OF CONTENTS I.
Introduction .....................................................................504
I1.
Inhalation Pathway ..............................................................505
I11.
System to be Analyzed .........................................................505
IV .
The Analytical Scheme .........................................................506 A. Formulation of the Questions to be Answered ...........................506 B. Sampling ................................................................508 1. General Rules for Sampling ......................................508 a. Representative Mean Composition ........................508 b. Representative Variance ..................................509 c. Accuracy of the Analytical Method ......................509 d. Efficiency ................................................509 2. Special Problems for Air Dust Sampling .........................509 3. Sampling Techniques ............................................509 a. Gravitational Settling .....................................518 b. Centrifugation ............................................518 c. Impingement .............................................518 d. Impaction .................................................518 e. Filtration .................................................518 f. Electrical Impaction ......................................519 g. Thermal Precipitation.....................................520 h. Pumps and Metering Devices.............................520 4. Other Implications ...............................................520 . 5 Sampling Procedures .............................................520 C. Sample and Standard Preparation ........................................532 D. Irradiation, Counting, and Gamma-Ray Spectrometry ...................532 1. Neutron Irradiation...............................................532 a. Whole Reactor Neutron Irradiation .......................532 b. Epithermal Neutron Irradiation ...........................534 c. Cyclic Irradiation and Counting .......................... 534 2. Photon and Charged-Particle Irradiation .........................534 E. Data Processing .........................................................536 1. Computerization .................................................536 2. Frequency Distribution of Data ..................................538 a. Gaussian Normal Distribution ............................538 b. Lognormal Distribution ...................................538 3. Data Concentration/Reduction ...................................539 F. Data Evaluation .........................................................539 1. Precision and Accuracy ..........................................540 G. Data Presentation ........................................................540
5M
Activation Analysis
V.
Relative and Monostandard Methods.. ......................................... .541 A. Relative Method (Mdtiekment Standard Method) ..................... .541 B. Monostandard Method (Monoelement Standard Method) ............... .542
VI.
Use of Activation Analysis for Atmospheric Samples in Various Localities ...................................................................... .543
VII.
Level of Toxic and Other Elements in the Atmosphere ........................ .549
Acknowledgments.. ................................................................... .558 References.. ........................................................................... .558
I. INTRODUCTION In recent years, atmospheric particulate elemental composition has received increasing attention for many reas0ns.l-l2 Thus toxic elements introduced into the environment as a result of fuel combustion, industry, and incineration as well as use of toxic pesticides are of increasing concern for air pollution. An inhalation threat is even frequently encountered, where these toxic elements are associated with particles of submicrometer diameter. An increase in ambient aerosol contamination has, therefore, become a serious problem of public health. The hazards of atmospheric contamination are to be predicted before antipollution legislation is introduced to protect the environment and hence the health and well-being of mankind now and in the future. The assay of metallic components in ambient atmosphere is achieved by using many methods including conventional chemical procedures, spectrophotometry, emission spectrograph~,atomic absorption, X-ray fluorescence, (conventional, total reflection, and synchrotron) and activation analy~is.~ Actually the determination of a large number of samples, as is the case with environmental investigations, necessitates the use of quick and accurate instrumental nondestructive methods mostly incorporating computer data handling. Due to the low abundance of aerosols, accurate and high sensitivity procedures are required in most of the studies. This has brought the activation technique (especially instrumental neutron activation analysis, INAA) to the forefront of methods applied in this field in almost all cases, where the detection limits of NAA are superior to other methods. In this chapter, the various aspects concerning such applications are outlined. The details of the analytical scheme are presented. These include formulation of the questions to be answered, sampling of aerosols, their subsequent preparation for irradiation, postirradiation procedures that might be used, counting, gamma-ray spectrometry, data handling and evaluation. In addition, an outline of the various ways of data presentation in this field is given. The closing section of this chapter compares levels of toxic and other trace elements in the atmosphere at various cities or localities in the world as determined mainly by the activation analysis method. This chapter is an updated version of our previous review1which comprises an extensive list of all elements analyzed in individual air by AA in more than 120 publications.
Volume 11
505
11. INHALATION PATHWAY" The most critical pathway for the uptake of toxic elements from air dust by the human organism is inhalation into the respiratory tract of the lung alveoli region. The alveoli are able to exchange gaseous oxygen, carbon dioxide, as well as toxic gases between inhaled air and blood. Toxic elements from dust particles reaching this region may also undergo quick exchange so that their soluble fractions are introduced into the blood and from there into the whole ~ r g a n i s m . ~ The uptake of toxic elements from dust particles in the lung greatly depends on the particle size and density of the particles. The largest fractions of dust particles within the inhaled air are removed in the upper parts of the respiratory tract before the alveoli are reached. Larger particles tend to be removed between the nasal passage ways and the lower bronchi, whereas the smaller particles, especially those with diameters below about 0.1 Fm diameter have a high probability of penetrating the alveoli. Depending on the region of deposition, the respiratory tract undertakes the removal, at least partly, of deposited dust particles by various mechanisms. Thus in the respiratory tract of the lung, above the terminal bronchi, the ciliated epithelium has the ability to move the dust deposits up and out of the respiratory tract. Depositions within the bronchial epithelium can be removed within hours, whereas deposits in the alveolar region may remain for longer periods. To some extent, however, the deposits can be removed by phagocytes. These are mobile white cells, which have the ability to engulf the particles and to transport them out of the alveolus region. The particles may then migrate into the ciliated epithelium to be eliminated on this route or they may pass into the lymphatic vessels and hence the lymph nodes. As a result, the uptake of toxic elements from dust particles of the air within the human lung greatly depends not only on the size and density of these particles, but also on the solubility of toxic elements contained in the particles, element concentration in the inhaled air, the rate of inhaling the dust, the capacity of the deposition region in the lung, and the rate of removing the particles from the respiratory tract. It is important to point out right at the beginning of this chapter that in the analysis of air dust for toxic elements, the fraction of air dust with diameters below about 0.1 pm is by far the most difficult to remove by air filtration and also to sample for subsequent element analysis of air dust. Many analytical investigations have, unfortunately, not included this fraction at all or only to an inadequate extent.
111. SYSTEM TO BE ANALYZED2-l2 Air, as a part of the biosphere, is essential for all phases of the life and welfare of man and other organisms on earth. It is the most important constituent of the environment around us, S ~ G A the human organism is able to live without eating food for several weeks, without drinking water in the desert for several days, but only for a few minutes without breathing air. The transportation of toxic constituents from the environment into the organism takes place mainly by inhalation of air through the respiratory tract, to a less extent through the intake of water and food, perhaps also as a result of diffusion through the skin. Air is not a homogeneous medium, but a mixture of gaseous, liquid, and solid components, called aerosols. It is a colloidal multiphase system, consisting of the air-gas phase, acting as a dispersion medium for suspended liquid and solid particles. The liquid and solid components of the aerosol are usually referred to as air particulate matter, airborne particles or air dust, regardless of their origin. However, air particulates could be named differently according to their nature, size, and concentration within the gaseous phase. The largest amount of dust in air is of natural and only to a smaller degree of anthro-
506
Activation Analysis
pogenic origin. The natural fraction consists mainly of finely distributed soil or rock particles, originating mainly from the soil around, but at least partly also of matter discharged by volcanoes and of plant material, such as pollen. This is transported by wind and the thermal convection of air from the ground into the lower atmosphere. The main constituents of anthropogenic dust are the emissions from industry, households, and traffic. The synonym "dust" for solid airborne particles can be defined in several ways. According to the most common practice this word refers to solid airborne particles ranging from pm (molecules, clusters of molecules) to lo3 pm (large grains, which can be transported only by strong winds). Such a large diameter range of seven orders of magnitude reflects inhomogeneities in chemical composition (and, therefore, density) and shape (due to agglomeration), as well as reaction with gases due to absorption and adsorption processes. One of the major problems in dust analysis is homogeneity of elemental concentration, of grain morphology, and of particle size distribution. Smoke on the other hand is a dense condensation of an aerosol with solid or solid plus liquid particles. Fog may be defined as a cloud of, usually, water droplets of less than 100 pm and a droplet concentration of about 0.01 g/cm3 at or very near the ground. Rain consists of water droplets of 400 to 1000 pm in diameter and its content is usually 0.1 to 0.3 g/ cm3. Mist is the name for liquid particles aerosols of any size. Haze refers to a non-cloudforming solid or liquid particle dispersion lower in concentration than fog and causing a slight or moderate diminuition of visibility in air. Smog is a mixture of smoke and fog; m a z e is smoke and haze. A cloud is any free aerosol system having well-defined bo~ndaries.~ In order to interpret analytical results, one has to distinguish furthermore between primary, secondary, and even tertiary particulate matter. Primary particulates are those injected directly into the atmosphere as a result of chemical and/or physical processes. They usually have sizes from 1 to 20 pm. Secondary particulate matter is usually 0.005 to several pm in size. It is the product of chemical reactions occurring in the atmosphere. It may contain, e.g., sulfate, nitrate, hydrocarbons due to reactions of SO,, NH,, NO,, H,O with primary dust nuclei under the influence of sunlight radiations. Tertiary particulate matter contains conversion products obtained during sampling, especially during long-time reactions.
IV. THE ANALYTICAL SCHEME The analytical scheme for AA of atmospheric environmental samples is shown in Figure 1.
A. FORMULATION OF THE QUESTIONS TO BE ANSWERED Before starting any elemental analysis of air or air particulate matter, detailed information has to be collected about the history and known properties of the material to be analyzed, as well as about the quality of the analytical results expected. After careful discussions, a clear and precise question has to be formulated, which can be answered by the expected analytical data. The next step is to prepare a detailed analytical scheme, which is optimal for the relevant problem, including a detailed sampling plan. During these discussions, it sometimes turns out that the question to be answered cannot be answered by the analytical results at all. If, for example, only one air dust sample from one single station is available, the analytical result can give information only about this one station during the sampling time and not about a whole city or country, or a longer time interval, because sampling is not representative enough. If the detection limits of the analytical method to be used are too near to the concentration levels to be investigated, precision and accuracy of the measurement will be too poor to characterize the contamination situation reliably enough. In the case of monitoring the observance of certain tolerance levels, a relatively inaccurate and nonprecise analytical method may be suitable, if the concentration levels to be analyzed are far below the tolerance level itself.
Volume 11
507
The scope of the trace element analysis of air or air particulate matter and, therefore, the questions to be answered may include establishing the present state of the multielement composition of a given volume of air with respect to all or only some few elements, variation of element composition in a given volume of air or geographical area as a function of time and meteorological conditions, monitoring of toxic elements in airlor air dust, observance of tolerance levels of toxic elements, measuring emission cadasters for toxic and nontoxic elements in air, estimating emission situations, evaluation of body burden and inhalation andlor ingestion pathways into the human organism, enquiry about exposure rates for the public, identification of emission sources, investigation of complaints, control of technical measures undertaken for environment improvement with respect to environment at protection, investigation of physical, chemical, and meteorological processes associated with material transfer into other environmental compartments, meteorological tracer experiments, and inhalation experiments of air dust particles with different sizes. As long as element concentrations in a given volume of air have to be investigated, all the difficult problems concerned with sampling of air dust or air, discussed in Section IV.B, have to be considered. The situation is much easier, if only the element content of a given sample of air particulate matter, without relation to a definite volume of air, is of interest. For the analyst, this situation involves an analysis of major, minor, and trace element contents in a mixed organiclinorganic material. The analytical scheme such as that given in Figure 1 is the most general one comprising all possible cases. It belongs to the art of the analyst and uses as few steps as possible. This is because every step is an additional source of errors, manpower, and costs. The so-called nondestructive analysis methods have the big advantage of avoiding chemical steps. It is to be noted that also for air dust, NAA is not the only and not in all cases the best method to use. S a n ~ o n i " ~pointed ~ ' ~ ~ out that NAA has an optimal sensitivity for a large group of elements; for others, it cannot be used at all. If it has been decided that NAA should be applied, one should try first to avoid chemical steps and to use only pure INAA especially in the case of routine analysis. The second consideration is the different possibilities of activation to be used. Elements which can be analyzed in air dust by AA include Ag, Al, As, Au, B, Ba, Br, Ca, Cd, Ce, C1, Co, Cr, Cs, Cu, Eu, F, Fe, Hf, Hg, In, K, La, Li, Mg, Mn, Mo, Na, Ni, Pb, Rb, Sb, Sc, Se, Sm, Sn, Sr, Ta, Th, Ti, U, V, W, Zn, and Zr. Of these elements, Ag, Au, In, Ta, Th, and U are best analyzed by epithermal NAA; B, F, Li, and Pb by proton AA, and I, Ni, Ti, and Pb by photon AA. Sometimes the activation method should be combined with some other methods of analysis. The gamma-ray spectra obtained after irradiation of the air particulate matter sample are the basis for its multielement determination. As an example, Figure 2 shows the high resolution gamma-ray spectrum of urban air particulates (NBS 1648) after irradiation with whole reactor neutrons in linear, and, in Figure 3, in logarithmic, scale. The experimental conditions are 12-h irradiation in the MERLIN reactor at Jiilich (FRJ-1)in irradiation position BE 12 with a neutron flux of 6.5 1013 n cmP2 s-', 24-h cooling and 4-h measuring time with a high purity Ge-detector of 20% relative efficiency, 1.8-KeV resolution at the Co-60 peak, and the multichannel analyzer ND-66, using 8000 channels. The linear scale in Figure 2 gives a better impression of the activity concentrations of the radionuclides included, and, therefore, of the element contents to be analyzed. The logarithmic scale in Figure 3 has advantages for the qualitative identification of the elements (or radionuclides) especially at trace levels. High resolution gamma-ray spectrometry is necessary to obtain as many as about 167 identified peaks, belonging to 38 induced radionuclides, from which more than 30 elements can be determined.
.
-
.
588
Activation Analysis Formulation of the questions to be answered
+ Sample and standard preparation
+
Irradiation of samples and standards
d Ashing
Dissolution I
Chemical separation I
+
1 Radioactivity measurement of gamma-ray spectrometry ] 1
Data processing
-i Data evaluation
Data presentation
Answering the questions, conclusions and proposals for protection of the environment
FIGURE 1. General scheme of activation analysis of air particulate matter.
B. SAMPLING6,9J3-20 Sampling of air dust in many cases is one of the most important and difficult steps in the surveillance of air pollution. The collection of a representative and adequate solid sample from the heterogeneous gaseous medium presents a variety of complications. If the sample collected is not representative, the final results of the analysis and calculation would be of little or no value. Misleading results are often worse than no results at all.
1. General Rules for Sampling19 The main problems of sampling are in general the representative composition of the sample to be analyzed, followed by obtaining a representative variance upon the statistical treatment of the analytical data, appropriate accuracy of the analytical method selected, and the need for an overall compromise. Accordingly four rules of sampling could be formulated: -
-
a. Representative Mean Composition The mean composition of an analytical sample in principle must be exactly equal to the mean composition of the total air volume to be evaluated.
b. Representative V b n c e The variance of an element concentration within an analytical sample should be an unbiased estimate of the variance of the totdity of air volume to be estimated. If this is not the case, a prerequisite for statistical tests is not fulfilled. c. Accuracy sf tlte ArtaCyhd Method The accuracy of all sampling operatiom should have at least the same order of magnitude as the accuracy of the subsequent analytical procedure. This means that not always the highest accuracy of an analytical method is necessary and vice versa. d. Efficiency For practical reasons, it is often necessary to have a compromise between requirements a and b on the one hand and a given expenditure of costs and manpower on the other. If it is unfavorable to achieve such a compromise, one has to be very careful in drawing conclusions from the data obtained.
2. Special PrebIems for Air Dust Saargliag The aerosol within a given volume of air is heterogeneous with respect to the components of the mixture. Therefore, the ratios of air-gas to solid and liquid particles, of solid to liquid dispersed particles, as well as the composition of the solid and the liquid particles themselves, have to be taken into consideration. Atmospheric and meteorological conditions in addition to the sampling operation itself, which in most cases is the separation of solid particles from the air, may change the original composition of the aerosol. The main problem of aerosol analysis is that the degree of its heterogeneous distribution over small and large areas and volumes cannot be easily observed; compared, for example with multiphase systems, such as soil. In the latter case, heterogeneities can be observed directly from the color or mechanical changes. Without external mixing, the degree of homogeneity in the aerosol, similar to two liquid streams, e.g., two different river waters flowing together, is less complete than one might assume. The instability of the aerosol composition is largely manifested through the settling of large dust particles, e.g., above 5 to 10 pm, by gravity. Inhomogeneities may also arise as the result of streaming winds, wash-out by wet precipitations, reaction with liquid aerosol particles, such as water droplets in fog, temperature, etc. Considering for example the wind speed in relation to the constant sampling speed, in the nonisokinetic case, the particle size distribution of the aerosol can be changed. High humidity may lead to a condensation of water in the interior of the sampler and the water film deposited therein may absorb solid particles or gas. In winter time, the filter may be covered with a water or an ice film thus changing the concentrations at various heights from the ground. The absorption of gases by solid or liquid particles and the uptake of liquid by solid particles would also lead to an increase of particle size due to swelling effects. In sampling air dust, it should be separated from liquid and gaseous constituents of the aerosol. One has to take care of the inhomogeneities and achieves a realistic average composition of the aerosol. If the volume of the sample to be taken is much smaller than the space of air to be estimated or controlled, random samples according to sampling statistics have to be taken in order to take care of the inhomogeneities and to get a realistic average composition of the aerosol.
3. Sampling Techniques' In general, the collection of air dust may be achieved by gravitational settling, centrifugal
510
Activation Analysis
Volume 11
512
Activation Analysis
+
'I,
mcu-0 ln
Volume 11
513
\---___-j
H
I'
Configuration Sample t i t l e Sample date L i v e time
: : : :
LUST003.CNF URB.PARTICLES PI: CANDB 26-AUG-1987 20: 45: 00 Aquis i t i o n date: 840.00 M i n u t e s Sensivity :
8-OCT-1987 4.0
FIGURE 3. Gamma-ray spectrum of urban particulates (SRM, NBS, 1648) as in Figure 2, but in logarithmic scale.
17: 06: 34
516
Activation Analysis
Volume 11
517
518
Activation Analysis
separation, inertial collection (wet impingement), impaction (dry impingement), filtration, electrostatic precipitation, thermal precipitation, or by ultrasonic agglomeration. The latter is used to agglomerate the particulates so that it may be collected in another device. a. Gravitational Settling Gravitational settling (also called dry atmospheric fall-out) is only used to collect large particles (>20 to 50 pm) that fall out of the atmosphere due to the force of gravity. It requires no vacuum source or metering system and dust is collected on dust fall glass slides, filter paper, plates, dishes, trays, or jars. Sometimes the surface of the receiver is coated with grease for the retention of sedimented dust. The method does not provide data on volumetric concentration and is beset by the complicating effects of wind velocity, direction turbulence and rain. It is, therefore, erratic, unpredictable, and usually nonreproducible.
b. Centrifugation In centrifugal separation using cyclones, the centrifugal action throws the heavy particles to the side of a cyclone where they can slide down into the collector. It has varying efficiencies in accordance with the type of cyclone used; the efficiency may reach 95 to 99% for 15 to 50-pm particle size. c. Impingement
Wet impingement involves abrupt changes in direction and velocity of the particles leading to their retention in a collector liquid. The very high discharge velocity in the impinger (>110 mls) may cause shattering of large particles, thus changing the particle size characteristics of the sample. Collection efficiency is nearly 100% for particles of >1 pm at the optimum sampling rate of 1 ft3/min.
d. Impaction In the impaction method, the deflection of air from its path of flow causes the deviation of dust particles from the flow way to adhere upon the deflecting (impaction) surface. This process depends on the particle size, so that if a cascade impactor functions in an ideal manner, each stage would collect all particles above a certain "cut-off diameter". At each successive stage, the cut-off diameter would be smaller than in the previous stage. In practice, however, there is an overlap in sizes from the various stages. Johansson et al. discussed the aspects of aerosol sampling by means of the cascade impactor^.^' This sampling process is capable of transforming qualitative concepts of the sources and atmospheric behavior of large and small particles into quantitative models, provided that a clear understanding of the nature of subpopulations of aerosol particles is attained. Cascade impactors, used for aerosol particulate fractionation pass the air stream at a carefully controlled rate, by means of a critical flow orifice through a series of stages with decreasing orifice diameters allowing higher linear air flow rates and impaction of the largest particles at each stage on a barrier just beyond the orifice. Impactors may have either a single orifice per stage," or a large number of orifices per stage.7 In all cases, the impaction surface, a coated-metal or glass surface, must be soft or sticky to realize adequate retention of particles on impact and to avoid bounce or dispersion of a particle deposit. Moreover, to assure good impactor performance, the mass collected by each stage should be kept to a minimum. In this case, the elemental analysis of the fractions would lead directly to a histogram of atmospheric concentration for the size ranges and it would thus be possible to establish a distribution of elemental concentration with particle size. By reducing the pressure inside the impactor, the smallest size of particles collected may be reduced by more than one order of magnitude.23 e. FiUration Filtration is perhaps the most widely used technique for the collection of air dust prior
Volume I1
519
to activation analysis. Filters are used in a wide variety of equipment and geometries for collecting particulate matter from the atmosphere and gas streams, for particle identification and sizing. Filters have high efficiencies, even for very small particles and low capital costs. The filtration mechanism is direct interception and inertial impaction for the largest particles, and Brownian, or diffusion impaction for the smaller ones. Perkins compared the characteristics of filters other than cellulose and cellulose nitrate.9 Resistance to abrasion is highest for nylon, ninex, dacron, and polypropylene, and poorest for fiberglass. Of the first-four filters, nylon is the cheapest and dacron has the highest air permeability (up to 60 ft3/min/ ft2). Organic membrane or nucleopore filters show the highest efficiency for particles of small size but have relatively low velocity of air stream. Polystyrene fiber filters (Mikrosorban) on the other hand allow high speeds of air stream but are difficult to ash, which may be necessary for activation analysis procedures associated with radiochemical separations. The efficiency of filters decreases with decreasing particle size, increase of pore size of the filter, and with increasing particle velocity at the face of the filter. Nevertheless, organic filters are suitable for the collection of particles as small as c0.03 pm in diameter." Glass fiber filters on the other hand are used with high volume (Hi-Vol) samplers as they allow very fast passage of air. These filters have, however, relatively low collection e f f i c i e n ~ y . ~ ~ In activation analysis, filter impurity is a very significant factor in the choice of the filter and in the determination of the detection limits of the activable elements. Parkinston and Grant evaluated the impurity levels in three types of filter materials and found that Whatman No. 42 filter would be the best choice in their case.26Keane and Fischer determined impurity levels in a number of filters using INAA and Na(T1) detector^.^' A total of 7 inorganic impurities were determined in 3 types of filters by Spumy and Fiser28.29while Tuttle et al. analyzed 11 elements in Millipore@ filters.30 The latter authors considered Millipore@filters to be quite satisfactory with respect to their background metal content for the activation analysis of metal pollutants in urban particulate matter. Dams et al. evaluated filter materials and impaction surfaces for nondestructive INAA of aerosols with the use of the high resolution Ge(Li)-detector.31In addition to elemental analysis, flow and retention properties, as well as tensile strength were studied. The same authors found that trace element contents are relatively high in most filter material, thus representing the principal limitation in analytical sensitivity. It was concluded that of commercially available filters, Whatman No. 41 cellulose has the lowest analytical blanks, favorable particle retentivity properties, but may clog during prolonged sampling. Millipore@filters have also low blanks for most elements, but tend to deteriorate during irradiation in the pile. Special polystyrene fiber filters have low blanks and excellent particle retentivity but are fragile. Vogg and HiirteP2 considered the cellulose paper filter to be the most favorable for sampling air dust, because of the low level and homogeneous distribution of the metallic impurities in the filter. They found, however, that the German Schleicher & Schiill as well as Binzer filters are superior to Whatman No. 41 (Balston). Zoller and Gordon33reported the levels of inorganic impurities in cellulose ester membrane (Millipore@)and polystyrene (Delbag) filters. It was found that continuous washing of some cellulose paper filters may be used to remove water-soluble impurities, without adverse effects upon the filtration proper tie^.^^
f. Electrical Impaction Electrical impaction collection, usually used to remove aerosols from large volumes of gases, has high efficiency for small particle size. A high electrical potential difference is maintained between two electrodes causing a current to flow. The particles are collected on the inside of a cylinder housing the electrodes and may be washed or brushed out for anal~sis.~.~
g. T h e d P r e c i ' o n
Thermal precipitation is based on the phenomenon of thermophoresis in the presence of a temperature gradient; small particles move to the colder zone. Cdlection is almost 100% for particles in size range of 0.01 to 10 Fm. Nevertheless, the method is still not widely used as an ambient air sampling technique. No particle shattering takes place so that this technique would be very suitable for the sizing of air dust particula~es.~.~
h. Pumps and Metering &vices In general, sampling equipment for air dust analysis is a device in which a movement of air is produced, for example by a vacuum source. Usually two types of vacuum pumps, operated by motors, are applied: positive displacement and centrifugal. The basic difference in their performance is that the relationship between suction pressure and capacity is linear in the first and nonlinear in the second. Since sampling may be required for extended periods of time, a heavy duty motor-driven pump offers the greatest versatility and reliability. Air-metering devices are also needed to relate the quantity of dust collected to the amount of air sampled. Two types of device are used: rate meters passing air in a continuous stream and volume meters capturing air in a specific v o l ~ r n e . ~ . ~ 4. Other IrapkatMas
Cdlection of tropospheric aerosols may involve vertical profiles up to 9 km from the surface, while stratospheric aerosols may be sampled during stratospheric flights.% Sampling of particulate matter from relatively stagnant ambient air should not necessarily be isokinetic as is the case with a gas stream, such as stack gas, since in the former case wind velocity and direction are seldom constant.' The passage of an air sample through a bent tube before precipitation of particulates on to the filter may lead to their deposition and loss by impaction at the bend. Different flow patterns for particles of various size are also expected for a bent tube as a result of the different particle moments leading to uneven deposition into the filter, and this would introduce error if only one filter segment is analyzed. A probe which points upwards is expected to collect more particles than one pointing downwards due to the gravitational settling effect, particularly with large particles. Particles may be lost in a sampler by electrostatic attraction to surfaces inside the sampler if these surfaces are made, for example, of glass or plastics. It is recommended, therefore, that the distance between particle entrance into the sampler and the coUector should be kept to a minimum. Leaks in samplers should also be avoided, tkws ensuring quantitative ampl ling.^
5. Sampling Prwedures Willcniss and Larson% collected dust from the marine atmosphere on board ship by impingement on nylon mesh panels of 1 mZ area, woven from 0.32 mm diameter nylon -lament with an open area of 50%. The meshes were flown in such a manner that their plane was normal to the wind. On another ship the authors used a high volume air sampler with filters made from nylon monofilament bolting cloth with 801cm mesh count, thus reaching an air flow of 1.8 m3/min. On an S2D aavd aircraft, an air sampler holding up to eight similar filters capable of being changed remotely was also used. Aras et aL3' collected atmospheric particulate matter by pumping air through a 20 x 20 cm2 Delbag polystyrene filter at 2 m3/min using a high vvdrne Hurricane pump. Particulates from 2500 to 5000 m3 air were collected on each filter and one eighth of the filter was used in each irradiation. Two samplers were placed at 2 and 20 m above the ground, the second b e i ~ gabout 500 m from a major source of atmospheric particulates, automobile exhaust from the busy U.S. Highway No. 1, and in the immediate vicinity of Chemistry Building parking lots. In six different stations in Munich, the fall-down method was used to collect heavier
dust particulates within 1 month.38 Polythene bottles each containing 100 ml bidistilled water, to avoid the escape of collected particles, were also used for sampling.38Iodine was trapped by filter paper and charcoal; factors effecting its collection and retention before 14MeV NAA were examined.39 The results obtained from many analyses may bear inadequate resemblance to the true state of affairs because of changes occurring in the samples between the source and the laboratory. It is almost impossible to avoid sampling of air dust for trace analysis by performing measurements in situ, as is the case with flowing streams of liquids. Jensen and Nelson constructed two aerosol sampling devices.40One of these holds 14 filters for discrete time intervals (<12 h), which can be determined by a commercially available programmable time switch. The other produces a continuous sample in a 5-mm wide strip for the period of a week. Both devices are light-weight, cheap, and have low power consumption, in addition of being easily demonstrated under changing weather conditions in both winter and summer. An automatic filter changer for the collection of short-period, high volume aerosol samples has been also de~igned.~' In order to obtain blank samples, which are as representative as possible, all manipulations carried out on the real samples were also done on the blank samples. The blank filters and collection surfaces were, therefore, placed in the collection devices between the different sampling periods and 2-min samples were taken with these blanks." In addition to sampling by the above-mentioned methods big dust batches were also collected. Thus the Joint Research Center of the European Community at Ispra collected a 600-g batch during the winters from 1962 to 1972, at the inlet of the air conditioning of a building in Milan, Italy. After sieving and homogenization, fractions of this sample were distributed for interlaboratory comparison.43." A fully automated sampling station set up at the Karlsruhe Nuclear Research Center, West Germany, described by Vogg and H a e l , consists of a high flow rate air dust sampler and an electronic control panel for setting any desired sampling intervals.32Using that station, samples of atmospheric dust were obtained monthly, with 170 m3 air per hour flow rate and an effective filter area of 412 cm2. A running cycle of 5 min duration per hour was preset, so that the total monthly filtered air was about 10,000 m3. The separation efficiency of 99% was verified and c o n f i e d by supporting a second filter and analyzing it separately. A similar separation efficiency was also reported by Salmon et al., who undertook probably the most ambitious program for the retrospective analysis of air samples collected in the U.K. during the years 1957 to 1974.45Individual filters, after exposure and assessment of radioactivity content, were packed in either paper or polyethylene envelopes, which were then stacked and stored in a dry cupboard with closed doors. The volume of air that passed through each filter and the date of its exposure were recorded. Due to the great number of filters ( h u t 5000), samples representing 3-month intervals were prepared for analysis. These samples were obtained by punching disks in an appropriate way. A saddler's steel punch with a thick polyethylene seat was used. Extensive tests were performed to prove the absence of any contamination caused by this procedure. For collecting air particulate from the Keiyo industrial area to the east of Tokyo, Bando et al. used deposit gauges with the containers placed at various points and samples of atmospheric precipitation were collected from the containers every month, dried at 100°C, and tarry matter removed by extraction with acetone in a Soxhlet extra~tor."~ In addition to the conventional way of sampling of air dust, samples of soil and vegetation (grass) were taken several hundred feet away from two highways in the U.S. in order to The determination of 26 elements in street dust evaluate the automobile exhaust p~llutants.~' samples from London, New York, and another 3 small urban cities48and from Christchurch, New Zealand49was recently reported. The various methods and conditions of sampling air dust by various authors are listed in Table 1.
TABLE 1 Sampling Conditions in Activation Analysis of Airborne Particulates Site
Sampling method
Type of sampler
Filtration Filtration
Cellulose filters Millipore" filters
Filtration
Membrane filter
Filtration
Delbag polystyrene High volume Hurricane pump filter, 20 x 25 cm
Filtration
Whatman filter, type 41 Deposit gauges
Italy Munich, West Germany Kyoto Okayama, Japan Washington, D.C. and Silver Springs, MD, 2 m above the ground Harwell, U.K. East of Tokyo
Settling
Filtration
Walker Branch Watershed. TN
Filtration
Paris
Filtration Impaction
Heidelberg, West Germany, 20 m above ground Chicago metropolitan area
Collector
Filtration
Filtration
Flow rate (volume)
Sampling time
Daily
Dust weight
Remarks
Ref.
Sampling as in Ref. 27 Samples filtered and dried at 100°C
53
Few mg
Open LV sampler 3(MOh
High volume samplers
Millipore@AA fil- Low-volume sam plers ten (0.8 mrn pore, 4.7 cm 0) Nuclepore" What- Vacuum pumps man 41 High volume samplers Cellulose Whatman 41 (5.5 0) 8 stages Andersens Impactor Delbag Microsorban filter (10 cm2) Cellulose-base filter High volume paper, Union Car- samplers bide Corporation, 18 X 23 cm backed with glassfiber-base filter
2h
46
2 weeks
1 month
6 m3/h (145-1236 m3 per sample) 2000 m3/24 h
0.1686 g 0.053 g
High retentivity of filters 99.6%
56
One cm2 cut from the filter for analysis (5 m3 air)
57
30 m31h
17-70
h
Diaphragm pump operated by a small induction motor, 240 V, 50 watts (gas meter)
6 Ymin (50 m3)
1 week or 1 month
Filtration
North-West England (rural site)
Filtration (parti- Whatman-41 or cles 100 ~ m ) 541.6 cm 0 held in polyethylene duct
Stuttgart, West Germany Hong Kong
Dry deposition
Leaves; plastic film
Filtration
24 h Diaphragm pump 1.30 Umin 2h and carbon vane Pump Low vacuum high 4.5 l/min/cm2 24 h or less 20 X 25 cm 0 volume pumps 12 Ymin/cm2 (5, 2.5 or 4.5 cm 0 10, and 80 m3) or high vacuum, low volume 28 Ymin Pumps Polyethylene sheet, Seven-stage cas9.6 c m 0 Durethcade (Andersen ene 12010 (Sinsampler) clair-koppers Co., Chicago III), 0.0025 cm thick Whatman No 41 Jet High volume Initi; 6-93 min filter, 63 cm2 efUnico samplers dust-loaded, 10 fective area m3/h (2-36 m3) Plates covered with Anderson 8-stage 28 Vmin 5.63 h polyethylene and cascade impactor 2.5 cm Whatman No. 41 filter
East Chicago, Indiana, and Niles, MI
Filtration
Impaction
Ghent, Belgium
Filtration
Impaction
Near Brussels
Filtration
Whatrnan 41
Portable mast
Atlantic Ocean
12.75 mg
58 59
60
Whatman-4 1
Whatman 41 20 cm3
CI, I, Br trapped o n charcoal Inlet nozzle faced downwards to avoid intake of rain, aluminum sampling duct coated with PTFE was initially used
Low volume sam- (1.5 m3) pler
Variable
Industrial, heavy traffic and residential areas Retentivity of filters down t o 0.1 p, particle size
Mylar@and Teflon" found unsatisfactory
3.42 mg/m3 total Particle size 0.1 from 8 stages to 29 pm (efficiency 95%) approx. 50% of dust particles smaller than 5
61
31
TABLE 1 (Continued) Sampling Conditions in Activation Analysis of Airborne Particulates Site
Sampling method
Collector
Type of sampler
Flow rate (volume)
Sampling time
Dust weight
Remarks
Ref.
Benghazi
Dry atmospheric Filter paper fall-out Neuherberg 10 km Filtration Cellulose acetate Millipore" aero- 24 h continuousnorth of Munich, filters, Millipore" sol sampler open l973/ 1976 2 m above ground EAWPo 47 (47 type, 47 mm mm 0 , 1-p pore (pump NK size) 186.2) Neuherberg 5 m Filtration Polystyrene fiber Automatic assemabove ground filters Microsorbly with 4 sambane, Delbag, 20 plers, RS-1, Mauler (Quantomm0 meter, Elster for flow) Copenhagen Filtration Whatman-1, 4.9 Low-volume samcmZexposure area plers (OECD) (25 mm 0 ) Sartorius cellulose High volume nitrate no. 11302, sampler on mocellulose acetate bile stations no. 11304, Milliporem cellulose acetate type EA U.S. Filtration Impaction Niigata, Japan Impaction Filtra- Whatman 41 Andersen impaction tors; LV air sampler Mid-Atlantic region Filtration Nuclepore", nylon, Rotameter 1-2.5 Ymin and charcoal U.S. Filtration Cellulose ester fil- Pump ters
Commercially available
6; 3; 2.5; 2.5; 2; 3; 5 h every day
Four RS-1 samplers are connected together into an automatic device
65
Montreal (workroom air) Canada Dearborn, MI
Filtration
Polyvinylchloride
BDX-44 and MSA-G pumps Sanyano Type A
Wet precipitation 0.6-2.2 mg 0.016m3/minper 10-24h Gelman type GA Filtration cm2 (9-22 m3) membrane filters, 47 mm 0 0.2-p pores Variable (2-90 24 h Variable Mobile samplers Whatman (W. & Guildford, Surrey, Filtration R. Bilston Ltd.), U.K. m3) 5 5 mm 0 Whatman 41 filters, Ghent Filtration 10 cm 0 Whatman 41 Unico 550 Tur24 h (longer peFiltration riods in remote bine Jet Samplers with 20 X areas) 25 cm filter holders Becker pumps (high vacuum with 11-cm 0 holders) Whatman 1 Cellu- Standard OECD Copenhagen Filtration lose filters, 25 instrument mm 0 , membrane filters (cellulose nitrate and cellulose acetate filters; 37 mm 0 ) Whatman 41, I1 High volume Filtration Ghent sampler cm 0 4 polyethylene-cov- Standard high 1.5 m31min and Scalp-hair; imToronto 0.57 m31min, repaction and fil- ered stages What- volume and high spectively man 41 (5 stages) volume model tration 65-000 Andersen samplers
72 Comparison of 73 NAA and X-ray fluorescence spectrometry 74
Cellulose nitrate 76 Milliporem AAWP or Sartorius SM 11302 or cellulose acetate SM 11104
Samples from 310 78, 79 persons size ranges 1.1, 2.2, 3.3, 3.3, 3.3-7 and 7 aerodynamic diameter
TABLE 1 (Continued) Sampling Conditions in Activation Analysis of Airborne Particulates Site
Sampling method
Houston, TX
Filtration
Sendai, Japan
Filtration
Several sites in
Filtration
U.K. Bombay, India
Filtration
Cleveland (metropolitan)
Filtration
Various cities in Filtration Australia and New Guinea Cambridge, MA Impaction Lake Michigan MI Impaction (from the deck of the research vessel "Inland Seas")
Memphis, Tenn.
Collector
Type of sampler
Teflonm,NucleDichotomous porem, and quartz Beckman Sampler Millipore" AA High-volume membrane filter samplers (0.8 (L pore 0, 20 X 25 cm) Teflonmand EsPump parto filter Whatman 41 High-volume samplers Whatman 41 High-volume samplers
Flow rate (volume)
Sampling time 2h
400 Ymin
Ref. 80
24 h
1 week
Four-stage cascade impactor Polyethylene inserts Scientific Advances six-stage cascade impactor and an Anderson sampler
ORNL sampler or EPA stack sampler (a new Cottrell precipitator)
Remarks
24 h
Polyester filter, 0.2 High-volume P sampler
Electrostatic pre- Alundum Humble cipitation and a glass fiber filter
Dust weight
Proportional to stack velocity
24 h
Possible contami- 87 nation from ship smoke stack monitored by high volume filter sampler to locate the impactors in contamination-free places 88
South Pole
Filtration (Air Cellulose, WhatBecker SV-380 Sampling van, man 542, 25 cm high-volume 2.4 m x 2.4 m 0 Nuclepore" fil- pump x 3.6 m, oper- ters, pore size 0.4 Rotary vane Gast ating with a 40 p, 11 cm 0 vacuum pump. kW Diesel genModel 3040 erator with 1.5 H P 1 V motor Impaction Polycarbonate (Nu- Six-stage scienclepore") and 14 tific advances cm 0 Whatman cascade and a 541 filter modified 5-stage Sierra Hi-Vol impactor (Dry gas meters -t 5-10% accuracy) Polyethylene fume1 The collecting Chalk River NuRain funnel was (15 cm 0 ) and clear Laboratories, screened with bottle (4.5 1) enOntario Canada closed in a black terylene mesh bag (0.5 mm) to exclude insects
Settlement
Teheran, Iran
Filtration
Whatman 541 filter A perspex frame paper (25 X 20 holding the filcm) ter, provided with a sheet of perspex as a shelter from rain Millipore" EHW Eberlin sampler PO 4700
150 m3/h
(100 ml rain)
24 l/h
9d
Rain water fil22 tered (Whatman 4.2 cm 0 ) ; residue dried on the filter and filtrate evaporated to dryness on a Whatman 41 filter, 5.5 cm 0, placed at the bottom of a polystyrene container Low intrinsic content of trace elements in filter
TABLE 1 (Continued) Sampling Conditions in Activation Analysis of Airborne Particulates Site Cambridge, MA
Munich
Mexico City
Oak Ridge, TN: Blacksburg, VA, highway sites
Prague, (Czechoslovakia)
'
4 sites in Ankara
Chilton
Sampling method Filtration
Collector
Type of sampler
Flow rate (volume)
Filters, EH and HA Vacuum pump Millipore", 47 mm 0
Filtration
Filtration
Sampling isokinetic tube Syn por 3 filters Vacuum pump
Delbag polystyrene High-volume filters 20 x 25 pump samplers cm or Whatman 41 filters
Dust weight
Remarks
Ref.
Filter blank cor90,91 rection for elements (V, Pb and Br) less than 5% for all samples
Electrostatic pre- Activated charcoal An electrostatic cipitation cleaned by heating precipitator to 750°C for 2 weeks in vacuum Filtration Glass fiber filter Dust monitor belt Millipore@fil30 m3/d ters (1700 m3) Filtration Dexter filter paper Curtin air sam(grade C-1140) pling pump (Model 251-223) Settlement on Soil, distal and grass and soil proximal portions of the grass (Poativialis)
Impaction
Sampling time
1d
24 h
760 individual 47 sets of soil and grass samples to study automobile exhaust pollutants 94
5m3/h (30 m3)
6h
2 m3/min
During fall or winter times
A special Teflon@ filter holder used to avoid contamination 95
Teheran 4 m above Filtration the ground level Mount St. Helens, WA Santiago, Chile
Livermore, CA Penn State Univ.
Louvai-la-Neuve, Belgium Ankara Munich
Ghent
Filtration
Milliporem filter E H 47 ~ mm 0, 0.5-k pore NASA turbo-prop P-3 aircraft Whatman 41
Air sampler of the elm an Instr. Co.
Modified stainless steel Buchner funnel Nucleporem filters, Modified EPA Filtration sampling train 47 mm 0 , 0.4 CL Wet scrubbing Filter paper lining High velocity electrostatic pre- the collection tube electrostatic precipitation cipitator Filtration Sartorius filters Gravikon (Sarto(SM-11302, 3-p rius) samplers pore 0 ) Filtration Whatman 41 HV pump sampler
Filtration
Settlement (Ber- Polyethylene bottles gerhoff method) each containing 100 ml bidistilled water Filtration Whatman 41 cellulose filter, 11 cm
3
M min
0.11-2.2 kg Sb Airborne gunshot 0 . 3 2 4 . 8 pgBa residues
1 month
0 Inlet of the air conditioning of a building Whatman-41 filters Staplex sampler Filtration Beersheba and Impaction working 2/3 of Shivta, Israel the time (30 min on and 5 min off) Cascade impactor Nucleporem filters, High-volume and Industrial stacks Filtration 0.25-p, pore size tape samplers and urban areas in Albany, Oregon
Milan
Winters of the years 1962-1972 24 h
600 g
100
TABLE 1 (Continued) Sampling Conditions in Activation Analysis of Airborne Particulates Site
Sampling method
Guildford Surrey, U.K.
Filtration
Cincinnati, OH; Columbia, MO
Filtration Filtration
Petten, Netherlands Filtration
Ghent 5-15 m above ground level
Filtration
Flow rate Collector
Type of sampler
(volume)
Whatman 1 Nuclepore" and Millipore" filters Millipore" WS fil- High-volume (9.5-18.2 m3) ters Milliporem sampling pumps (6.8-15.8 m3) EH filters (4.7 with filter cm) holder, Gelman and flow meter Actived charcoal Electrical suction 0.05-2.8 m3/h 20-35 mesh pump with variable capacity, a modified Swinnex 04700 model (an integrating flow meter with decimal reading to 0.2 1) Whatman 41 filter High volume 70 m3/h 20 X 25 cm or 10 sampler, Unico 2 m3/h cm 8 (for Becker 550. A high-ropumps) w Pump, Becker VT25 (calibrated rotameter)
Sampling time
Dust weight
Remarks
Ref.
24 hours
The filter out into 30 wedge-shaped 20 segments
For Hg analysis; 106 air first filtered using a membrane filter, 0.45-CLpore diameter
Few hours in highly polluted atmospheres to 2 weeks in clean air of remote areas
107 50 mg (from 400 Filter holders mounted in mem3 air per day with the 10 cm teorological filter) shelters for protection and shielding against particles larger than 100 k .
Karlsruhe, West Germany
Island of Puerto Rico and the San Francisco Bay area, 6 2 2 m above the ground
Equatorial Pacific Ocean
Trinidad-Barcelona Atlantic Ocean and Oalu, Hawaii
St. Louis, MO 15 m above street level
China (5 Sites) Montreal Cambridge, MA
.
Filtration
Some hours
Cellulose Weissband Sch. & Sch 58912
Microsorban filters A fully automated SM 159, Sartosampling station nus, 412 cm3 with a high flow rate sampler and an electronic control panel (Electronica, Hagnach) Polyethylene disks, Anderson CasImpaction 25 placed on cade, 7-stage stainless steel col- impactors held lection disks and a by ring stands backup 47 mm fil- and operated by ter '1, hp vacuum pumps Collodion-coated Single-stage imImpaction glass slides. Nypactor Ion mesh "kites", 1 m2 Impingement Nylon panels 1 m2 Filtration Nylon monofilaHigh-volume air ment holding cloth samplers with 8 8 mesheslcm filfilters (isokinetic ters flow) Impaction Polystyrene film Six stage Battelle coated with a Cascade Impaclayer of evapotor for 4 p , 2 p , ratedparaffinand l p , 0 . 5 p , 0 . 2 5 ~ supported by 2.5 diameter particle cm glass disks size Impaction Cascade impactor Snow Snow Filtration 57 mm 0 M i l k Electric vacuum poremEH (0.5-p pump pore 0 membrane filters o r Delbag polysterene filters
170mJ/h (10,000 m3 monthly)
Comparison with filters produced by other manufacturers
32
Sampling performed at 13 stations
108
Marine aerosols
36
Particles collected down to 0 . 1 ~
111
1 month with a running cycle of 5 min duration per hour (total 2 yrs.)
0.5 mJ/min 1.8 m3/min (variable) 1 llmin (0.7 m3)
(20-50
m3)
12h
532
Activation Analysis
C. SAMPLE AND STANDARD PREPARATION This step is of great practical importance. The sample size and weight cannot be changed in the case of air dust samples since the amount collected by the sampling apparatus is limited. Of course this amount can be controlled during sampling flow rate, time of sampling, size and efficiency of filter. In most cases, the problem of the standard is not so difficult as in other physical methods of analysis, such as emission spectroscopy, X-ray fluorescence, etc., since matrix effects (self-shielding) can be eliminated or kept the same for samples and standards. Air dust is easily weighed on the filter as the weight of the latter can be known with accuracy. The change of filter weight due to humidity can be computed by using a second filter during the sampling process and weighing it before and after exposure. The filter with dust may be pressed into a pellet, which is easy to handle in the subsequent steps.25Air dust may be packed in small snap-cap polyethylene vials. The polyethylene vials are enclosed in a polyethylene pocket. Individual specimens are usually numbered using special ink (e.g., Edding 3000). These pockets can be replaced after irradiation by other similarly numbered fresh polyethylene pockets to eliminate activity of irradiated ink and fingerprints. The problem of numbering can be avoided in the case of air dust without filter by placing all the samples (approximately 20 mg) next to each other in cavities made on a large polyethylene ribbon, 0.1 mm thick, 20 mm wide, and of adequate length.ll3 The cavities can be made using a press equipped with a soldering iron, covered with a piece of polyethylene and sealed. The belt is then folded like a concertina and placed in the irradiation can. The disadvantage of polyethylene is that it becomes brittle after irradiation in the reactor for periods exceeding 1 h for neutron fluxes > 1 1013n .cm-2 s- ' . For longer irradiations, air dust may be packed in aluminum saucers with covers or in thin aluminum sheets folded in the form of cylinders on a glass rod. In both cases, adequate sealing may be effected by squeezing and folding the container edges. Numbering can be made here using a pin or by cutting the edges in various code forms. The disadvantage of aluminum is the formation of relatively high 24Naactivity through the (n,a) reaction. However, cooling for 1 to 10 d after irradiation is enough for the decay of this activity. Packing of air dust without filter may also be done using silica vials, provided with a narrowing to facilitate quick sealing by means of a high temperature burner. After irradiation, the vials are counted as such or, in the case of using radiochemical separation, are opened with a diamond cutter mounted in a special glove box to avoid spreading radioactive dust. Numbering of silica vials is usually done by a glass marker or India ink. Bowen and Gibbons in their book on radioactivation analysis compared the properties and impurities of packing materials such as polyethylene, aluminum, and silica for NAA of air dust.'14
-
D. IRRADIATION, COUNTING, AND GAMMA-RAY SPECTROMETRY The various aspects of irradiation, counting, and gamma-ray spectrometry are fully discussed in other chapters of this book. Here only the aspects and methods are given that are specific for air particulate matter. 1. Neutron Irradiation a. Whole Reactor Neutron Zrradiah'on The packed air dust samples are subsequently enclosed in the irradiation cans or rabbits. These are made from materials that must resist high neutron fluxes and gamma radiation during irradiation, that give rise to low activities, preferably from short-lived nuclides only and are mechanically strong. For short-time irradiations, polyethylene or nylon rabbits made of two parts are used to transport samples in and out of the irradiation position using rapid transfer pneumatic systems. Due to the brief cooling periods associated with short-time irradiations, one single sample or standard is irradiated at a time; each sample or standard is wrapped for this purpose in an adequate amount of tissue paper to keep it constantly in
Volume 11
533
the same position in the can. The rabbits have usually a limited life duration as a result of radiation damage. For longer-time irradiations, aluminum containers with covers are used, where the covers are easily sealed by cold welding. After irradiation the cans are opened using an automatic lathe. At very high neutron fluxes, high-purity aluminum cans are necessary in order to avoid activities from long-lived radioisotopes. Since for such irradiations usually many samples and standards are placed together in one can, systematic errors due to flux gradients are possible. These errors can be corrected by placing a flux monitor, a Co-A1 alloy wire (e.g., 1% Co) along the axis of the can and counting small pieces of that wire (e.g., 0.5 cm each). The first determining factor in the INAA of air dust or any other material is the neutron flux in the reactor position available for irradiation. Dams et al.31have designed and executed a procedure for the nondestructive determination of up to 33 elements in air pollution particulates. For the analysis of elements giving rise to short-lived isotopes, each sample is packed in a polyethylene vial then placed in a rabbit, which carries it to the irradiation position (flux 2 1012n cm-2 s-I) by a rapid transfer system. Using the same system, the rabbit is returned to the laboratory, the polyethylene vial is transferred manually to a counting vial and after 3-min decay, the sample is counted for 400 s (life-time) followed by a count of 1000 s starting 15 min after irradiation. The same sample, or another portion of the same air filter with dust, is then irradiated for 2 to 5 h in the reactor core (flux 1.5 lOI3 n cm-2 s-I). Here nine samples and a standard mixture of elements are irradiated together in a polyethylene bottle. After irradiation, the samples and standards are transferred to clean containers and counted once for 2000 s after 20 to 30 h of cooling and then for 4000 s after 20 to 30 d of cooling. A similar procedure was presented by Kronbory and Steinne~."~ The elements thus determined in air dust and their detection limits (in brackets, pg) are A1 (0 .O4), Ca (1.0), Ti (0.2), V (0.00 l), Cu (0.1) , Na (0.2), Mg (3.0), Mn (0.003), In (0.0002), K (0.075), Cu (0.05), Zn (0.2), As (0.04), Ga (0.01), Sb (0.03), La (0.002), Sm (0.00005), Eu (0.0001), W (0.005), Au (0.001), Sc (0.003), Cr (0.02), Fe ( 1 . 3 , Co (0.002), Ni ( 1 . 3 , Zn (0. l), Se (0.01), Ag (0. I), Sb (0.08), Ce (0.02), Hg (0.01), and Th (0.003). The net peak area from every isotope is determined by totaling the counts over an interval of seven channels centered about the actual peak position and subtracting baseline counts. This can be done with the help of a suitable computer program.''' Peak areas are compared to those of the standard and after decay corrections (samples and standards are usually counted at different times after irradiation), the weights of the elements are computed. The above procedure cannot be used, however, if the irradiation position available has a higher neutron flux. For example, if the flux at that position is >1 1013n cmP2 s-I, which is often the case, short irradiations for 5 min are no longer possible and the analysis of elements giving rise to short-lived isotopes can be done through an irradiation for only 1 min.51,"8It has been found5' that with such high neutron flux for filters of 24-h sampling exposure duration of a maximum of 1-min irradiation and a minimum of 3- to 5-min cooling would give the highest permissible dead time factor (<20%) during measurement of the gamma spectra. In this case, counting for 300 to 400 s is also adequate. On the other hand, the duration of the long-time irradiation was found to also have one limitation: the polyethylene vial containing the filter with air dust or the standard undergoes severe radiation damage when irradiated for more than 30 to 60 min. This irradiation time limitation makes it desirable to count the samples and standards for longer times in order to reach reasonable detection limits. For example, with the same cooling periods and detection limits as attained by Dams et al.3' and for 30 min irradiation in a 1 lOI3 n cm-2 s-I flux, counting for at least 5 h would be necessary for the elements giving rise to long-lived isotopes. Nakanishi and S a n ~ o n investigated i~~ the possibility of using low-energy photon spectrometry (LEPS) in nondestructive whole reactor neutron activation analysis of atmospheric
-
.
.
.
-
.
-
-
534
Activation Analysis
air particulates and other environmental samples. The authors found that one advantage of LEPS over conventional INAA is the analysis of Cu through the assay of Ni,a X-rays which result from V U , even under extreme conditions with intensive activity of 24Naand 82Br. Another advantage of LEPS is the accurate determination of Zn in air dust even if the Znl Sc ratio in the sample is less than 100. In the latter case, conventional INAA brings about a considerable error since the photopeak activity ratio of 65Zn (1 115.4 keV)P6Sc (1 120.3 keV) would be less than 0.2.
b. Epithennal Neutron Zrradiution Here the air dust packed in thin aluminum foils is covered with a cadmium sheet of about 0.5 to 1 mm thickness or placed in a small cylindrical cadmium vial of that thickness, before being placed together with the similary packed standards in the irradiation can. Such a cadmium cover absorbs all neutrons with energies less than about 0.5 eV. Under these irradiation conditions, the reaction rate R will be given by
where I is the approximate resonance integral including the Yv tai1.119J20 Therefore, such irradiation is preferable for the determination of elements having high resonance integrals compared to their thermal cross-sections. A rapid transfer (pneumatic) system may be used, where short-lived isotopes are to be measured after epicadmium irradiation. The irradiation of air dust under a cadmium cover was found to increase the number and sensitivity of determinable elements. This advantage is particularly prominent for elements with relatively high resonance integrals. Figure 4 shows the gamma spectra of air dust obtained from the Munich region, irradiated once with whole reactor neutron spectrum and a second time with epithermal neutrons using a small cylindrical cadmium cover. It is seen that more peaks appear in the latter spectrum. These peaks are masked in the first spectrum by activities arising from the major elements in air dust. Thus the elements uranium (239Np),thorium (233Pa),indium ('I5"In), gold (19'Au), tantalum (Is2Ta),and silver (llO"Ag), which cannot be accurately analyzed by INAA through irradiation without cadmium cover, can be easily analyzed by epithermal neutron activation (ENA). This method was also used for the analysis of uranium in air dust collected on cellulose filters, but with 5-min irradiation followed by measurement of the 74-keV photopeak of 239U,applying a high resolution LEPS.121 Correction was made of uranium blanks of the cellulose filter paper limiting the sensitivity of the analysis. Simultaneously, the concentrations of the elements cobalt, bromine, antimony, and indium could also be determined using their short-lived isotope^.^' Epithermal NAA is only suitable for the analysis of a limited number of air dust samples, which is often required. The considerable amount of activity induced particularly in the analysis of elements requiring long activation periods as a result of irradiation of cadmium in the pile makes it difficult to use such activation for a larger variety of samples. Grass and Westphal used reactor pulse activation and high rate gamma spectrometry for Pb and C1 analysis in aerosols. lZ2
c. Cyclic Irradiation and Counting Cyclic irradiation and counting followed by further counting on a low-energy photon detector and a Ge(Li) detector was recommended by Spyrou et al. for the measurement of 38Cl" (0.74 s), 'O7Pbrn (0.8 s), O ' F (1 1.36 s), 77Sem(17 5 s), and 'lOAg (24.4 s) in environmental pollutants." In case of fluorine, the authors did not consider interference from the 23Na(n,ol) 20Freaction which amounts to about 50% in typical aerosol samples.
.
2. Photon and Charged-Particle Irradiation Wilkniss and L a r ~ o proposed n~~ a procedure for the determination of fluoride by photon
535
Volume 11
I
I
:
60
120
160
2M
2-0
1
I
280
320
1
I
*
360 u00 L40 C h a n n e l number
FIGURE 4. Gamma-ray spectra of neutron-irradiated air dust (20 mg from Neuherberg Station near Munich) Irradiation time: 2 h, cooling time: 8 d.'
activation analysis which is briefly as follows: fluoride is activated by I9F (y,n) IxF. The half-life of I8F is 110 min and it emits positrons. One sample and one standard are packed together in an aluminum capsule and are irradiated for 30 min in a photon beam produced by conversion from a 50 A average current electron beam in the NRL linear accelerator. After irradiation, the fluoride is separated radiochemically from the bulk of the sample by distillation from sulfuric acid solution. It is concentrated for counting in the form of PbClF. The counting set-up consists of two 3 in. X 3 in. NaI(T1) crystals, amplifiers, two singlechannel analyzers, a fast-coincidence module, scaler, and timer. The annihilation radiation of the I8F is counted in fast coincidence with a very low background. Calculation of fluoride concentrations is made in the usual way. The authors also investigated the use of deuteron activation to detect possible calcium isotope fractionation in environmental samples. The light elements Li, B and F were determined by proton activation. Calcium oxide samples were irradiated with a 1 FA beam of 15-MeV deuterons from the cyclotron for 10 min. The nuclear reactions T a (d,a) 38K and 4 T a (d,p) 49Cawere convenient for measuring the *Ca/48Ca ratio. The half-life of 38K is 7.6 min; the gamma-ray energy used for counting was 2167 keV; the respective values for 49Ca, are 8.7 min and 3084 keV. The counting of samples had to be done 15 min after irradiation, after the decay of the isotope I7F(t'/, = 66 s). The major problem is to accumulate sufficient counts under the photopeak. One million counts are needed to achieve a precision of 0.1%, which is mandatory to resolve calcium isotope fraction in natural samples. Factors contributing to this problem are limited counting time because of short half-lives, electronic limitations on total count rates, and practical considerations, such as availability of the cyclotron. Proton activation analysis of Li, B, and F was attempted with a 0.1 pA beam of proton (energy 1.4 to 2.0 MeV) from the Van de Graaff. The elements were identified by the prompt a-particles emitted from the 7Li(p,a), I1B(p,a), and I9F(p,a) reactions. The prompt a-particles were detected by a silicon surface barrier detector with an active area of about
536
Activation Analysis
0.5 cm2. The Rutherford scattered protons were deflected by the field of a permanent magnet placed between the target and detector inside the vacuum system. Such analysis has a high sensitivity for Li and B that are not easily determined otherwise. The limitations on surface determinations because of the short range of low-energy protons can be of advantage in the analysis of aerosol particles collected by impaction on metal plates for purposes of classification. Desaedeleer et al. applied proton activation analysis to determine lead concentrations in samples collected on filter paper.63 Radioactivity produced by 40- to 50-MeV proton activation via 2MPb(p,3n),'07Pb(p,4n), 208Pb(p,5n),'04Bi reactions was used to identify and measure trace amounts of lead. Up to 40 samples were bombarded simultaneously for a period of 30 min. The 374-keV gamma line was usually used for the assay of lead, although gamma rays above the annihilation radiation, as the 899 keV ones, are sometimes more suitable. The sensitivity recorded was 1 ng/cm2 for 5- to 50-min counting per sample and can be further improved by longer irradiation and counting times. The precision of the analysis was of the order of 15%. A system of gamma-ray spectrometry comprising a Ge(Li) detector and a well-type Nal(T1) counter for anti-Compton measurement has been also constructed and used for the analysis of aerosols.63 Instrumental photon activation analysis (IPAA) of atmospheric particulate material has been comprehensively treated by Aras et al., who published their work in 1973.37Concentrations of 14 elements have been measured by irradiation of the samples with bremsstrahlung radiations from electrons of 35 MeV at the electron linac of U.S. National Bureau of Standards. The elements analyzed routinely by their method are Na, C1, Ca, Ti, Ni, Zn, As, Br, Zr, Sb, I, Ce, and Pb. Several other elements, such as Fe, Se, Rb, and Y are marginally observable. Although, in general, IPAA is less sensitive than INAA, it can be used for the determination of several elements, which are difficult or impossible to measure in urban particulates with INAA, especially Ti, Ni, As, I, and Pb, most of them being toxic. The authors gave the properties of nuclides observable with Ge(Li) detectors in bremsstrahlung irradiated atmospheric aerosols and the approximate limits of detection compared with INAA and flame methods. Table 2 gives the detection limits for various elements in aerosols by INAA, IPAA, and flame atomic absorption spectrometry. For INAA37of elements giving rise to short-lived radionuclides (given in brackets in the table) samples were irradiated between 2 to 10 s and 5 min at a flux of 2 x 10¹³n cm-2 s-'. Counting started 2 to 10 min after irradiation ended and lasted for 2 to 5 min. For other elements, irradiation was carried out for 2 to 6 h at a flux of 3 X 10¹³ n cm-2 s-' and counting was done for 1 to 5 h, 3 to 6 d after irradiations and then for 5 to 20 h 10 d to 3 months after i r r a d i a t i ~ n . ~ ~
.
E. DATA PROCESSING123-130 Data processing may include collection, processing, and concentration or reduction of data. These operations can be performed with almost any homogeneous set of experimental data, regardless of the type of distribution, which, however, should be known. Routine analysis of air and air particulate matter often produces a large number of analytical data, which have to be handled. For example, the analysis of daily 24-h air dust samples, collected at 1 single station during 365 d a year, analyzed for only 4 elements in air, air dust, and ashed air dust, together with only three meteorological parameters, leads to about 6.100 single analytical values.'23
1. Computerization Data processing and evaluation can be more time-consuming than the physical measurement itself. Therefore, not only the analytical procedure, but also the subsequent pro-
Volume I1 TABLE 2 Detection Limits of Various Elements in Aerosols by INAA3', IPAA, and Flame Atomic Absorption Spectrometrys8 (Calculated for a 1000-m3Filtered Aerosol) Detection limits (ndm3)
Element
INAA
('41) Ag
10 1.2 x
As Au
-
2 1 30 2 x
(C1) Co Cr Cs
30 8 X lo-' 0.2 2 x
Eu
4 x
Fe Hg I La
5 0.1
2 x
(Mn) (Na) Ni Pb Sb
Se Sm Th
F-AAS
1 x
Ba Br (Ca) Ce
Sc
IPAA'
10-2 0.1 30
-
I x 10-2 1 x 10⁻³ 1.2 x lo-* 4 x lo-) I x
lo-'
Ti (V)
-
Zn Zr
0.8
a
2 x
Irradiation by brernsstrahlung from 35-MeV electrons
537
538
Activation Analysis
cessing, evaluating as well as even presenting and documenting of the results should be computerized as much as possible. Personal computers are often sufficient in many cases. A large number of IBM-PCcompatible programs for data processing and data presentation are commercially available. It is to be tested, however, if they are really " 100%" or only 99% compatible. 1n addition, it is desirable that data collection, processing, evaluation, as well as presentation are included in one single program. For scientific analytical applications, only a few such complete programs seem to exist. In the past 5 years, in many laboratories for activation analysis large computers, such as e.g., MikroVax 2 have become available. They are able to act as a whole set of multichannel analyzers as well as for fast, complex and convenient data evaluation. 2. Frequency Distribution of Data2,3,4Jm Since the majority of the more elementary statistical operations is valid only for a normal Gaussian frequency distribution of data, it is important, to test the type of distribution and then to decide which statistical operation can be applied. The most normal data distribution in the environmental contamination of elements is not the Gaussian normal but the skew logarithmic distribution, which can often be approximated by a lognormal distribution. If the type of distribution is neglected, large errors may become involved. Thus the wrong use of the arithmetic mean instead of the appropriate median for 365 daily contents of Pb, Cd, Zn, and Ca in the example given in the last section, has produced errors between 7 and 50% for the annual (!) mean element concentration. This is much more than an analytical error of only 5 to + 10% for the single trace element determination itself.
x
x
*
a. Gaussian Normal Distribution This is the simplest distribution type, familiar to the analytical chemist, when repeating determinations and calculating stochastic or systematical errors under the same analytical conditions. The mean value or the "center of gravity" for a given homogeneous data collective in the case of the Gaussian normal distribution is the arithmetic mean 2. It can, however, in a more or less pronounced manner be biased by "outlier" values located outside the symmetrical Gaussian distribution curve. If the outliers are on the side towards larger values, 2 may become too high. Outliers have to be tested first by outlier tests and then eliminated. In this laboratory for example, a program ZCH-312 uses simultaneously t-test, Nalimov-, Grubbs-, and Dixon-tests for outlier elimination at the same time. Experience has shown that the last three tests are very similar in their eliminating power, but that the modified t-test is sharper. Similar numerical tests are the homogeneity chi square or the most useful KolmogorovSmirnoff test. lZ3 The reliability of single analytical measurements can be characterized mainly by precision, accuracy, and comparison of both with the detection limits of the method. For practical reasons, it is not possible to repeat one single measurement as often as would be optimal for statistics. A reasonable compromise is to get four repeated values. This is the minimum number where an outlier test is still possible and an arithmetic mean is more significant than for only two or three single values. b. Lognormal Distribution Im The frequency of data for trace element concentrations in nature is usually not normal according to DeMoivre-Gauss, but often skew or logarithmic. These data can be approximated much better by a lognormal distribution than by a Gaussian normal one. With this in mind, Ahrens, for example, has considered the lognormal frequency distribution of chemical elements in minerals and rocks as the "fundamental law of geochemistry". In a
similar way, the trace element distribution in biological, medical, and environmental materials studied in the last two decades in the laboratory of one of the authors failed in most cases to achieve the "mystery of normality"128 and followed, more or less accurately, a quasi-lognormal and, therefore, skew frequency distribution.lZ3 The lognormal distribution can no longer be characterized by the arithmetic mean f as the center of gravity and by the standard deviation s or the relative variation coefficient V, as its dispersion around the mean. In this attempt then, remarkably large errors for the mean value and its dispersion are sometimes obtained.lZ3 The lognormal distributed data can be concentrated (or reduced) into the geometric mean $ instead of E, the geometric standard deviation s,, the skewness and kurtosis (g, and g, according to Fisher). The element concentrations in nature, of course, are not always exactly in a lognormal distribution. In this case, distribution-freeor rank order statistics128 recommend the emperical median Y as mean and the range R, the 80% interdecile range I,,% and the confidence intervals for e.g., 95 or 99% statistical probability, as measures for the dispersion around the mean. In case of the Gaussian normal distribution, the median Y becomes exactly equal to the arithmetic mean E. Therefore, no mistake can be made if the median is always preferred in such cases where the type of distribution is not known or only quasi-lognormal. Many elementary statistical tests are based only on Gaussian normal distributions. They can also be used, however, in cases of lognormal distributions, if not the single values xi, are inserted but rather their logarithms, log xi. For this reason, the outlier tests according to Fisher, Nalimov, Dixon, Gmbb, etc. can be applied for log xi values. The statistical treatment especially of air dust data has been discussed in more detail in Reference 123, where examples and references are also given.
3. Data ConcentrationlReduction Statistical data concentration can be performed for every experimental set of analytical data which is homogeneous and free of trends. The most comprehensive program of this kind for air dust data is the one published by Sansoni et al. in 1981. I z 3 According to this program, the experimental values are arranged in an ascending order; from the value with the rank number n/2 the median X is obtained. The type of distribution can be tested graphically by drawing Hazens straight lines in probability coordinates of normal and lognormal distribution. More precise is the use of the numerical goodness-of-fit test by Kolmogorov-Smirnoff and Cramer-van Mieses. Outliers are eliminated by t-, Nalimovs-, Gmbbs-, and Dixon-tests. Central mean values for characterizing the "center of gravity" of the data collective are the arithmetic, geometric, or harmonic mean, and the median. Dispersion around the mean is given by the standard deviation for single and mean value, relative variation coefficient, geometrical standard deviation, range and/or 80% interdecile range. Again, confidence levels for 95 or 99% statistical probability are calculated for X, X,, and Y. Depending on the degree of approximation either to the Gaussian normal or to the lognormal distribution, the corresponding statistical operations and values have to be taken when discussing results of air or air dust analysis. Since in the case of environmental element distributions, the "normal" case is more the lognormal than the Gaussian-normal distribution, an additional outlier test for the logarithmic of the experimental values xi is optimal and the whole procedure of data concentration is repeated after elimination of these logarithmic outliers. Further topics of data processing, not mentioned here, are data transformation, removal of noise by data filtering (digital and Kalman), data reconstruction, and curve fitting.124.127 F. DATA EVALUATION'Z8 Data evaluation includes interpretation of the data obtained, drawing conclusions by
540
Activation Analysis
significance tests, prediction of variables, and inference from the sample directly measured to the whole population to be estimated. It has to be investigated carefully whether the numerous conditions inherent in statistical tests are fulfilled and to what degree. Since the most common tests are only for Gaussian normal distributions, one should consult in the case of air and air dust distribution-free tests. Whereas the well known t-test concerns two arithmetic mean values x of two comparable, but Gaussian normal distributed data collectives, for a non-Gaussian distribution the MannWhitney test in the case of two independent samples and the Wilcoxen, or Kruscal-Wallis test in the case of two related random samples should be considered. In the case of comparing variances around the mean, instead of the Gaussian F-Test, for more than two matched groups the Friedman test can be preferred. It is an alternative to the ordinary two-way variance analysis. 128 The degree of similarity of two rank-orders of data can be investigated by regression and correlation analysis. In the case of Gaussian normal distribution, the linear correlation coefficient is sufficient; for distribution-free data collectives, the Spearman rank-order correlation coefficient or Kendals T coefficient are to be preferred.12* Inference from random samples of air to the total population of data for the area of air or the time interval to be estimated has to consider the representativeness of random sampling with regard to the mean composition of the total air volume or air dust to be investigated.
1. Precision and Accuracy The random errors also in NAA are given as precision, systematic errors as accuracy. Precision includes repeatability as within-run and reproducibility as a between-run precision. Both can be measured as absolute standard deviation of the arithmetic mean or its relative variation coefficient in rel-%. Accuracy is a measure of the approximation of the element concentration determined to the "true" concentration value. It can be expressed by the difference between the true concentration and the experimental one in relative percent. A better expression for the definitions given would be imprecision as well as inaccuracy. Repeatability can be obtained by repeating the analysis in one laboratory by the same operator in the same run as often as possible. In case of air particulate matter, however, in most cases the amount of the sample is very limited. Therefore, it is better, in case of solution methods, to dissolve the whole or almost whole amount of solid sample and to take portions of its diluted solution. As a "magic" number: three is the minimum of a significant arithmetic mean, four is the minimum for outlier tests. Reproducibility between different runs, also with different operators and in different laboratories is some indicator of how completely the details of the procedure are laid down, how carefully the operators work and how clean the different laboratories are, etc. In the case of metal concentrations per volume air, however, all differences between the operators or laboratories are involved in addition. Reliable accuracy data especially in the case of solid air particulate matter are difficult to obtain, because in almost no practical case are the "true" element contents of air dust samples with an enormously different element composition known. The concept of comparison with certified SRMs involves (1) the matrix, (2) the element composition to be determined, as well as (3) the anion composition of the sample to be determined and the SRM-standard, theoretically, being almost identical. With respect to the extremely large dispersion of qualitative and quantitative element composition of air particulate matter it becomes clear, that accuracies obtained often have a poor degree of reliability and, first of all, that much more certified air dust SRMs are absolutely necessary.
G . DATA PRESENTATION The data obtained are to be presented either as tables or as graphs. In the case of a large amount of data, which is usually the case, graphs are strongly recommended. Contour maps
Volume I1
541
resembling those representing evaluation levels (topographic maps) are often drawn to illustrate the distribution of pollutants across a certain locality (isopleth maps). Element concentrations in air or element concentrations in air dust can be presented as a function of, e.g., Wind direction (wind rose) Wind speed Wet deposition (mm) Air temperature Air humidity Air pressure Inversion layers Geographical position within the totality of air volume Distance from a real or potential emittend It is worth making efforts to combine data presentation by graphs with the programs for data evaluation and data processing. Single programs for each are available commercially in large numbers, but not the combinations. A convenient way to present a large number of data on air dust analysis is in the form of a regular or a cumulative frequency distribution. As mentioned before, the latter usually exhibits a positive skewness. A graphical test for lognormality is to plot the data on logarithmprobability graph paper. Its probability axis (horizontal) is transformed in such way that the cumulative frequency distribution of a lognormally distributed variable will be linear. Single values below the first and above the last 5% of all data can be neglected. The approximation of the plot to a straight line shows the degree of approximation to the lognormal data distribution. From the straight lines obtained the median 2,the geometric mean ( j i g ) and the geometric standard deviation (s,) can be evaluated. Y and E, correspond to the ordinate value of the data xi for Nl2 in the ascending order. There are numerous computer programs for statistical data evaluation and graphical data presentation. Commercial programs used in the laboratory of the authors for graphical data presentation are e.g., Microsoft Chart, Boeing Graph 3 D (Boeing Comp.), and Open Access I1 (Software Products International). Other statistical implications on atmospheric environmental samples are discussed extensively in many other reviews and book^.'-'^.'^
V. RELATIVE AND MONOSTANDARD METHODS Calculations of the element content from the measured gamma spectra can be achieved by two different methods, where either a multielement or a monoelement standard are used.
A. RELATIVE METHOD (MULTIELEMENT STANDARD METHOD) Since the high resolution Ge(Li) detector allows the simultaneous determinations of a large number of elements in one sample, it becomes a problem to irradiate a separate standard for each of these elements. Usually, however, a mixed standard may be prepared by evaporating a solution containing all the elements to be determined, if possible in a polyethylene vial or quartz tube similar to that used for packaging the air dust.13' Frequently, the specially prepared multielement standards or so-called standard reference materials (SRMs) are used for INAA by the relative methods. In the case of AA of air particulate matter, standard rocks, soil, fly ash, river sediments, and of course standard urban particulate material might be used in many cases, as they have rather similar matrix and contents of trace elements as many types of air dust. A complete compilation of working values and sample description for 170 international reference samples of mainly silicatic
542
Activation Analysis
TABLE 3 Determination of Elements by Epithermal Neutron Activation Analysis Using the Monostandard Method in Bowens Kale and Air DusP4 Air dust (ppm)
Bowens kale (ppm)
Element
Monostandard method (a)
Adopted values (b)
Difference (rel. %) (x)
Monostandard method (a)
Relative method (b)
Difference (rel. %) (x)
Note: Air dust collected 1975 on glass fiber filters, air conditioning installation, Department of Radiation Protection, GSF at Neuherberg, 10 km north of central Munich, mechanically removed from the filter material.
rocks and minerals has been given by Govindaraj~,'~~ while the new NBS-SRMs Catalog (1986-87) also provides many helpful data. Data for the the NBS urban particulate SRM (No. 1648) is given in Table 6, and data for a Japanese standard dust sample (from Yokohama) in Table 7. The use of SRMs in analysis necessitates a knowledge of their absolute or "true" elemental contents. Within an international complicated certification system, such materials are analyzed for various elements and the best available values are defined. The latter are termed "recommended, certified, best, proposed, guaranteed, consensus, mean", or "attested values". The International Working Group for "Geochemical Standards" proposed the name "working values" in the Geostandard Newsletters published by the group biannually. Valuable relevant information on environmental materials was also included in References 180 and 181. The number of air particulate SRMs so far available is very limited (only the two mentioned above) so it is hoped that new samples with different element content patterns will be available in the near future.
B. MONOSTANDARD METHOD (MONOELEMENT STANDARD METHOD) The theoretical aspects of the monostandard, also called single comparator or monoelement standard, method have recently been reviewed in References 120 and 133. Table 3 gives the result of epithermal NAA for some elements in Bowens kale powder and in a special air dust sample collected from north of Munich using the monostandard method, whereby cobalt was the single ~omparator.'~~ Belot and Marini used rubidium as an internal standard for the activation analysis of 20 elements in atmospheric pollutants using the whole reactor neutron spectrum.55The processing of the measured gamma spectra was done automatically using a computer program. The monostandard multielemental and pure thermal NAA of air dust, geological, and biological material using iron and sodium as single comparators has been reported recently. '35 To test the method, the values of the effective cross-sections of 23 elements were evaluated
Volume I1
.
543
-
in a reactor site with an almost pure thermal neutron flux of 9 10% cmP2 s-'. The crosssection values obtained were mostly found to agree well with the literature values of tinermal neutron cross-sections. The results of analysis by activation at the same site agree fairly well with the relative method and for an SRM with certified values (Table 4).
VI. USE OF ACTIVATION ANALYSIS FOR ATMOSPHERIC SAMPLES IN VARIOUS LOCALITIES In 1961, Friend et a1.67 were among the first to report on the use of NAA for the determination of trace elements in aerosols. The multielemental nature and specificity of activation analysis enabled the assay of aerosols, usually having a complex nature and highly variable composition. The "High Altitude Sampling Program", initiated by the Atomic Support Agency (DASA), permitted the direct measurement of pollutants in the stratosphere. Parkinston and Grantz6in 1963 utilized INAA for the analysis of aerosols and the characterization of their trace element contents. In that study the generally adopted Whatman4' filter paper for the collection of airborne particulates was used. The distribution of halogens in the atmospheric air has received much attention and their analysis by neutron activation techniques has been reported by many author^.^^.^^.'^^ Noted was a correlation between the ratio of the three halogens, chlorine, bromine, and iodine, in the air. Winchester et a1.'09.136explained the increase of bromine level in the atmosphere by elapse of time from 1963 to 1965 as a consequence of automobile exhaust. LinnigeP concluded that the combustion of leaded gasolines associated with the decomposition of particulates of lead halide is responsible for the parallel growth of air pollution with both halogens and lead. Duce and Winchester analyzed particulate and gaseous halogens in the atmosphere by NAA and evaluated their residence time.137 Gordon and Larson13' presented a study on the NAA of aerosol particulates for bromine, sodium, and manganese and were able to successfully correlate the variation of the concentration level of these elements with wind directions. An extensive INAA of aerosols from 22 air dust sampling stations in the Chicago metropolitan area was carried out by Brar, who analyzed six trace elements ~imultaneously.~~ From concentration correlations, for example by drawing lines on the map of the investigated area and connecting points with nearly equal concentrations of a given element, the origin of pollution could be recognized. Keane and Fisherz7also used INAA for the analysis of aerosol particulates collected by many sampling stations in the U.K. over a period of 1 year at the rate of a sample per week. Using neutron activation followed by radiochemical separation, Lee and J e r v i ~ analyzed '~~ 13 trace elements in airborne particulates. Tuttle et al.30 presented a comparative air pollution investigation using TNAA of a heavily industrialized area (Cincinnati, Ohio) and a nonindustrialized community (Columbia, MO). For the samples collected in Columbia, the concentrations of Al, Cr, Ca, C1, and V were comparable to those observed for the Cincinnati samples. A noteworthy result was the fact that only the latter samples contained As, Cu, Mg, and Sn. Dams et al.31described the use of INAA for the determination of 33 elements in air particulates and tested their approach on samples collected from and near the northwest Indiana industrial area. From the study, it appeared that the distributions of different elements over an industrial area and their interrelation may give some strong indication as to which elements have major sources. The elements may be assembled into groups and their distribution yields important information leading to the tracing of their sources and understanding their behavior in the atmosphere. Alternatively, a very close correlation has been observed between ambient aerosol composition and elemental ratios calculated from an emission inventory for northwest Indiana. An interesting conclusion of that investigation is the pos-
TABLE 4 Results of Monostandard and Relative Thermal NAAlJ5 Coal Fly Ash Mono Element As Ba Br Ca(%) Ce Co Cr Cs Eu Fe(%) Hf K La Lu Na(%) Rb Sb Sc Sm
Th
u Yb
Air Dust' Rel
Mono
Rel
Plant Material Mono
t
367 18 23 5.9 29 1.3 40
14 32 3.8 5.0 (23) Note: Comparison of element contents t (ppm, except Ca, Fe and Na in %) and precisions VK, (rel. - %) a Because of limited amount of sample, only one value (a local sample from Benghazi).
Rel
Volume 11
545
sibility of accurately estimating aerosol composition for several elements from an emission inventory of a given area and the measured concentrations of a few elements. The use of radioactivation analysis for the determinationof trace elements in air pollutants in the Keiyo industrial area, East Tokyo (Chiba Prefecture) was presented by Bando et al. in 1970.46The authors determined Al, Mn, and V by the induced short-lived nuclides and Sc, Zn, Cr, Sb, Fe, and Co by measuring the long-lived isotopes formed. For the latter elements, the nondestructive determination and the destructive determinationinvolving chemical separation were compared. It was also found that some refractory elements, such as Al, V, Cr, and Sc, requiring high temperature for excitation in atomic absorption spectrometry, are easily determined by the activation method. Wilkniss and L a r ~ o nused ~ ~ activation analysis for the determination of the elemental composition and origin of particulates collected in the marine atmosphere. The samples were obtained by aircraft flying at low altitudes, 50 miles off the eastern coast of the U.S., on a ship during an Atlantic crossing from the Caribbean to the Mediterranean and at a shore station on the island of Hawaii. The implication for pollution studies is that by determining elemental ratios such as F/Cl, NdC1, NaIK, CdS, and MnICI, one can determine whether an aerosol is of natural origin (the ocean, or volcanic activity) or of anthropogenic origin. Samples taken along the Atlantic coast of the U.S. show the influence of polluted continental air masses in near-shore regions; an influx of African dust was found in the middle of the Atlantic and "pure" marine aerosols were noted for Hawaii. The authors used photon and proton activation in addition to NAA. compared the neutron activation method with X-ray fluorescence Harnmerle et spectrometry (XRF)for the elemental analysis of atmospheric aerosols and found that the two methods agree with each other for the elements which are known to be easy analyzable by XRF. Lead, which is difficult to analyze by neutron activation, can be determined by charged particle activation analysis.140The detection limits of Pb were estimated to be 0.01 ppm for proton and neutron activation and 0.1 and 0.2 ppm for 3He and 4He activation, respectively. Parizek141 discussed interrelations between inorganic and organic compounds present in the environment and in the organism with particular attention to the evaluation of possible hazards. used ~ ~NAA for the study of air pollution of Guildford, Surrey in Hassan and S p y r o ~ the U.K. Airborne particulates collected on cellulose filters at ten different sites in the Guildford area during the summer of 1971 were analyzed together with samples collected at two stations by the local Public Health Department over the years 1967 to 1971. The sites selected for this investigation varied as regards the traffic, presence or absence of railway lines, industrial works of different types, sewage works, as well as housing density. Pillay and Thomas'42carried out an investigation of the potentials of NAA for the routine analysis of 19 trace elements present in atmospheric pollutants. The analyses were complemented by chemical separation and XRF. It has been found that neutron activation techniques can compete well with other analytical methods. In the analysis of elements, such as Al, V, Cr, I, Br, Mn, Cu, and Ag in airborne particulates, NAA can probably exceed in sensitivity many other analytical techniques. In pollution monitoring and pollution abatement programs, where reliability is essential, NAA could play an important role. Although the determination of lead in air pollutants by high-flux pulsed-neutron activation is practical, it would be difficult for this method to compete with other methods, such as atomic absorption and anodic stripping voltammetry from the cost point of view. Selenium could only be analyzed by an application of a radiochemical separation step and a NaI(T1) detector with much better efficiency than the high resolution Ge(Li) detector. In spite of the fact that the latter authors determined nickel in air dust through the (n,p) reaction on 58Ni,Das et al. claim that the Compton spectrum
546
Activation Analysis
of "Co is a serious disadvantage of the method and suggest the analysis of nickel using the s6Ni isotope, whereby an extraction-ion exchange separation procedure was a p ~ 1 i e d . I ~ ~ It has been postulated that the pollution of the marine atmosphere is steadily increasing. This is indicated by increased lead concentrations in polar ice samples and ocean surface waters, by the observance of pesticides transported with wind-blown dust over the Atlantic and Indian Oceans, and by a general increase in ambient aerosol concentrations probably of anthropogenic origin.36 The possibility of atmospheric contamination of Mexico City by dust has been investigated utilizing a Triga Mark I11 reactor.93Cawse and Peirsons9 determined by INAA and XRF the concentrations of about 30 trace elements in samples of airborne dust, rain water, and deposition at a single rural site in northwest England collected over a period of nearly 2 years. Such concentrations were used to produce two parameters, washout factor W, relating to the vertical atmospheric distribution of a trace element, and "dry deposition velocity" V, that relates to particle size. A general increase was noticed in winter for the concentration of the major elements Cl, Na, Al, Fe, Ba, and Zn. A correlation was established of concentration and wind direction for a limited number of elements. The concentration of elements in samples from dry deposition follow those in air. The authors classified detectable elements into: maritime (Na and Cl), soil-derived, and artificial or industrial, having both W and V, large, low W and large V, and both W and V, low, respectively. Finally the results were compared with those from six other stations in the U.K. Vogg and H%rteP2 determined airborne dust elemental concentrations for a group of elements at the Karlsruhe Nuclear Research Center, West Germany, and close to the highway between Karlsruhe and Bruchsal. Increased values close to the highway were noticed only for Br (factor of six). A parallel increase was noticed for Pb (determined by atomic absorption). This was, however, expected due to the addition of Br and Pb compounds to gasoline. Bogens6 determined the concentration of 18 trace elements in dust from Heidelberg, West Germany, using INAA, and compared his values with those reported for Paris, East Chicago, and Niles (U.S .). Consideringthe concentrations of different elements in the aerosol relative to that of sodium (arising mainly from the ocean), the author distinguished three groups of elements, related to the ocean (Na and Cl), earth's crust (La, Fe, Sc, Mn, Cr, Ce, and Sm), and to anthropogenic production (Cd, Ag, Sn, Sb, Hg, Co, and Br) as the main sources. For Paris, the elements Hg, C1, Br, Ce, Sb, and Na occur with significantly higher concentrations than for Heidelberg. For East Chicago, the elements with higher concentrations are Hg, Cr, Ce, Fe, Mn, La. A similar picture holds for the comparison with Niles, except for Hg. The analysis by activation of trace elements in airborne particulates collected from These studies inJapanese cities has been extensively reported in the literature.S2~8L.'44~145 volved a multielement analysis of size-separated airborne dust particles, the analysis of particulates emitted from jet aircraft engines, comparison of trace element contents in airborne particulate samples collected in various areas, combination of INAA with energy-dispersive X-ray fluorescence for dust analysis, and photon activation analysis. The results of millipore filter blanks, compared with those of other authors for various filters, are given in Table 5. Some authors dealt with the activation analysis of air particles for one element or a limited number of elements that are usually difficult to analyze using the conventional nondestructive method. Thus Foti et a1.la presented a method for the analysis of picograrn amounts of technetium in environmental samples by NAA. Moyers et al. analyzed gaseous brand particulates for bromine, lead, and vanadium in polluted a t m ~ s p h e r e The . ~ ~ analysis of rhenium in flue dust by NAA14' and silicon in natural and pollution aerosols (by 14 MeV NAA),'07 the use of NAA as a diagnostic tool for detecting lung disease initiated by hard metal dust,lL3the determination of gaseous bromine and iodine,g0the analysis of silicon,
Volume 11
547
TABLE 5 Elemental Composition of Filter Materials (ng/cm2)'
Metal
Polystyrene3' Cellulose esteP1." Cellulose paper3' (Milliporem 0.45 pm) (Whatman No. 41) (Delbag)
Glass fiber"
Organic Silver membrane"' membrane"'
rubidium, and yttrium,95mercury,I4*silver,50uranium,'49 and sulfur'50 are some such examples. The chemical composition of coal and fly ash and its comparison with natural aerosol composition has been reported by Belgian and Czechoslovakian scientist^.".'^' The first group obtained results which were in impressive agreement with the NBS data and with the results obtained by other methods at various laboratories, except in the case of mercury, where the value was about 100% higher than the NBS value. The discrepancy for this element is a usual difficulty in activation analysis, however, due to its loss during storage or during irradiation of samples (lower values are detected) or standards (higher values are detected). The second group used INAA for studying the atmospheric pollution in a heavily polluted industrial area with coal-fired process-heat plant and steel mills. They used the Anders ratio matching method for studying the influence of the elemental composition of emissions or the composition of aerosols. H e y d ~ r n 'presented ~ a system for the continuous quality control of analytical results from NAA of air filter samples based on the analysis of precision, which tests the agreement between observed and calculated precision. Jervis et al. demonstrated that multielement composition of aerosols and their particlesize distribution can be used to deduce some of the more prominent likely sources of inorganic components of air poll~tion.'~This is possible because elements associated with small particles (<1 pm) tend to come from high temperature sources, while large particles (>10 pm) as said before, arise probably from wind action on soil, deposited dust and fugitive emission from dust-producing operations. These conclusions were supported by investigating
548
Activation Analysis
the size dependence of some interelement ratios, such as ScIAl, VIA1, and MdAl. In the case of several elements, competing sources could also be distinguished quantitatively by interelement ratios. In order to assess the relative hazards that such airborne components could pose to human populations, analyses were canied out of local dustfall and soil contamination in addition to many of the more significant elements in scalp hair. Hair samples of a total of 243 rural, urban and exposed persons were compared. The results indicated that some toxic elements were considerably higher for exposed groups than the upper limit of the normal concentration range in control groups. Moreover, hair has been found to be advantageous compared to blood as a monitor of toxic metal intake because it can reveal an earlier ingestion which may not be indicated by a current blood concentration measurement. Sansoni et al. used INAA for the determination of Al, Br, C1, Co, Cr, Cs, Fe, Mn, Na, Sb, Sc, Ta, and Zn in air dust samples collected daily continuously over the year 1975 at Neuherberg (10 km north of the center of Munich). Some correlations with environmental parameters were evaluated. IsZ The authors also used short-lived nuclides here. Concentrations of some 36 elements were determined mainly by INAA in air particulate samples collected monthly at four nonurban sites in the U.K. over the year 1979 aiming at recording the deposition inventory to the ground.59The method was also used for multielemental analysis of atmospheric particulate material collected at the south pole around the beginning of 1975153 and at Chacalataya, BolivialS4downtown C a r a c a ~ , and ' ~ ~ in various areas of Hong K ~ n g . ~ l Other studies involved the investigation of the variation in environmental pollution through proton-induced X-ray emission,I5" use of INAA for ambient air samples at 250 sites in the U.S.,Is7 and for establishing a new size distribution pattern to identify the main air pollution source.Is8 The AA method was also used for the investigation of the possible sources of certain elements. Other trends in the field of surveillance of air pollution involve the investigation of the continental, marine, and anthropogenic contribution to the composition of aerosols, particularly in industrial regions. Other studies continue the use of instrumental nuclear activation methods for the investigation of particles from major air pollution sources, interpretation of aerosol trace elements, particle size distribution, investigation of the elemental composition of aerosols, estimation of the levels of the hazardous trace elements and their dependence on the concentration of major pollutants, as well as the dependence of trace element concentrations on meteorological parameters. The 14-MeV NAA of a Milanese air dust sample was reported quite recently by Bahal and Pepelnik,161while INAA was used by de Bruin and Wolterbeek to identify sources of heavy metals in the Dutch atmo~phere.'"~ Burgess evaluated four types of membrane filters with respect to their trace element contamination and resistance to damage during neutron irradiation; best were Teflon filters backed with polyethylene or p01ypropylene.l"~ The use of 14-MeV NAA for determination of Si in atmospheric aerosols from the vicinity of Rabat, Morocco, was reported by Chapuris and M ~ u a d i l i . 'Doi~hinov'"~ ~ presented a new application of the dependence of maximal air pollutant concentrations on mean time of sampling using NAA of 16 pollutants deposited on the facades of two churches in Bulgaria during the 197511976 and 197911980 periods. El Hossadi et a1.64combined INAA and flameless atomic absorption spectrophotometry for the comparison of the air dust in Benghazi and that of the highly industrialized Munich, Prague, and Sendai. Suspended matter in the air of Caracas, on the other hand, was analyzed by a combined NAA and XRF technique.lS5Trace elements in aerosols from a coastal region of Yokohama, Japan were determined by INAA with short-lived isotopes.'66 Other Japanese authors used both NAA and atomic absorption spectrometry, for the assay of two series of dust samples from Niigata.68The first series was for the period with studded tires (February and March), while the second was for the period without such tires (October). 1593'60
Volume I1
549
Heaton and Rahn analyzed aerosols, rain, and snow for trace elements by INAA in Hertelendi and Csonger used NAA studies on order to deduce in-cloud oxidation of precipitations to estimate the contamination resulting from a hypothetical nuclear war.'68 Ketelsen and K n ~ e c h e ldealt ' ~ ~ with the multielement analysis of aerosols by NAA and XRF. The author used radiochemical separation for the NAA of Na and Br. The analysis of aerosol samples from Czechoslovakia by INAA using long-term activation was reported by O b ~ s n i k , while ' ~ ~ combined INANXRF analyses of atmospheric particulate samples for receptor modeling were conducted by Olmez and Gordon.'" Possible sources of trace elements at various sites in New York state were investigated by INAA of summer aerosols.'72 An internal standard (gold) was used for INAA of airborne particulates in Taiwan.17' Pushkin and Gilbert in the USSR studied the limits of INAA of 48 elements for both Ge and Ge(Li) detectors;174their presentation is important in demonstrating the potentials of these techniques. Rambock investigated atmospheric deposition in Norway by analyzing of the moss Hylocomium splendens by flame atomic absorption and NAA,175 while Santroch concluded that NAA together with atomic absorption and XRF are specially suitable for aerosol a n a 1 y ~ i s . The l ~ ~ analysis of trace elements in airborne particulates of varying localities of South Africa was reported by Vleggaar et a1.'77The latter authors used NAA and other methods. Voigt and Lieser presented an interesting critical comparison of the various methods of analysis including NAA for the assay of trace elements in airborne dust. 17'
VII. LEVEL OF TOXIC AND OTHER ELEMENTS IN THE
ATMOSPHERE In this last section, the level of toxic and other trace elements in the air particulate matter and air of various cities or localities of the world as analyzed by the activation method are presented in Tables 6 to 9. Tables 6 and 7 give the data expressed in ppm (pglg) of air particulate matter, while in Tables 8 and 9 the data are given in pg m-3 of the atmospheric air. Of course the latter presentation is more useful for description of the pollution status. Many of the studies included have already been discussed in more or less detail. With regard to these data, it reveals the variation of element contents by the factors already mentioned. The given compilation would also be useful when comparing the levels in a given locality with the corresponding levels after a period of time e.g., every 5 or 10 years. Both methods of presentation were involved in recent work by Krivan and Egger,la9 who determined 54 elements in the air of Ulm by INAA, graphite furnace atomic absorption and microtitration. Ulrn is an example of an industrial city of medium size in the Federal Republic of Germany. The authors compared the concentrations of As, Br, Cd, Co, Cr, Cu, Fe, Mn, Ni, Pb, Sb (ng m-') in the air of their city (1984) with that of the south pole (purest region), Deuselbach, Marion Island, and Sutherland (unpolluted regions), Heidelberg, Karlsruhe, and Mannheim (medium-size cities), Chicago, Cleveland, Hamburg, Johannesburg, Munich, and Toronto (large industrial cities). In addition to the above 12 elements (except Fe), the contents of Hg, S, and Se were compared for Ulm, Deuselbach, Hamburg, Karlsruhe, Mannheim, and Munich. It was noticed, that the Br, Cu, and Pb contents in the air of Ulrn are very similar to those of Karlsruhe and Mannheim, but obviously lower than that of Hamburg and Munich, and higher than in Deuselbach. The levels of the given elements could be related to the volume of the traffic in the respective cities. Recent work involves the evaluation of multielement standards for instrumental methods and evaluation of INAA for environmental studies in parti~ular."~It was in genera1179,'80 shown that in atmospheric aerosols with an appropriate irradiation-counting scheme in routine, the large majority of elements of interest with >8% (about 25 elements) can be determined purely instrumentally. Shortcomings in this procedure are the lack of information
.
TABLE 6 Element Contents (ppm) in Air Particulate Matter of Some European Cities Determined by Activation Analysis and in SRM 1648 Milanu.s3 Element
M u n i ~ h ~K @a~r l. s~r ~ h e ~Mannl~eirn~~ ~ Deu~elbach~~ Ghentn Contents
Prague"
Londona
Urban particulate (SRM 1648)
TABLE 7 Element Contents in Air Particulate Matter of Some Cities in the World Determined by Activation Analysis (ppm) City or locality Elemenl Ag Al As
Ba Br Ca Cd Ce C1 Co Cr Cs Cu Eu Fe
Hg I K La
Mg Mn Na
New Yorke (North Atlantic)'
,
Halifax48
Canada12
Yokohama8' (standard sample)
Sendais' ppm
Content
range
Christchurche
Kingstone
Benghazia (range)
"
Values for North Atlantic are given in brackets.
554
Activation Analysis
I I I I
I I I I
The values for marine North Atlantic air are given in brackets.
TABLE 9 Concentration of Different Elements in the Air of Various Cities in the World Determined by Activation Analysis ( C L*~ m-3) City or locality CambridgeU Ghentl5 Heidelb~rg~~ Pari# Element
Teheran Wintee Summers
Ankado2 Winter Summer Niigataa OsakaPS Hong Kong6' Santiagow Caracas1" Contents
"
Single values are taken from Reference 95 for Ankara.
558
Activation Analysis
about the chemical state of the elements, impossibility or difficulty of determination of some important elements (about six), and necessity of applying special techniques for some other elements.lE1Some authors used instrumental analysis for air dust through activation by photons and photo neutron^'^^ and multielement analysis of single dust grains of various sizes from polar ice by INAA, laser and electron microprobe methods.lS3The intercomparison of the multielement analytical methods, including NAA with thermal and 14-MeV neutron for environmental samples, was conducted by Michaelis et al.lE4The data of such comparisons originated from parallel analyses in addition to interlaboratory tests. The samples included, in addition to air dust, particulate matter suspended in water, filtrates of river waters, sediments, mussel tissue and annual rings of spruce wood. de Bruin et al. used trace element concentration patterns obtained by INAA to recognize and identify components of mixtures of materials, mainly of environmental interest.lS5They used Target Transformation Factor Analysis (TTFA) to trace element concentration patterns, to identify sources of heavy metal air pollution. The authors studied air particulate matter and epiphytic lichens used as biological accumulators and claimed that INAA is the method of choice to provide the necessary element concentration data for TTFA. Their results illustrated the possibilities of multivariate statistical procedures for the interpretation of element concentration patterns. Long-range transport of trace elements to southern Norway during the year 1985 was studied by INAA from air filters,lS6while foliar contamination and uptake from aerial sources at Stuttgart has been investigated by the same method in addition to XRF.IE7The NAA method was also used for the determination of 33 elements in the aerosols adhering to 1-year-old spruce needles.'88 The sampling area was 150 km2 and centered around the city of Winterthur (Switzerland); from the interiors of forests, forest edges, single trees in the city, and tree stands at the edge of a highway. Great differences in composition were noticed between the material deposited on needles and that collected on filters, which was attributed to differences in the sampling time collection efficiencies and to leaching of elements from surface of needles by rain.
ACKNOWLEDGMENTS One of us (A. Alian) would like to thank the Alexander von Humboldt Foundation for invitations to the Federal Republic of Germany in summer and winter 1987188 and the authorities of the Kernforschungsanlage Jiilich GmbH (KFA) for the facilities provided in writing this chapter. Both authors also thank the staff of the Central Library at the KFA, especially its former director Dr. W. Manz, for their efforts, Mrs. Wiebecke for text processing, Mrs. Carter-Sigglow for translation service, and Mrs. R. Kurth and Mrs. A. Sansoni for corrections.
REFERENCES 1.
Alian, A. and Sansoni, B., A review on activation analysis of air particulate matter, J. Radiounal. Nucl. Chem., 89, 191, 1985.
Dams, R., Application of multielementd NAA in environmental research, in Instrumentelle Multielernent Analyse, Sansoni, B . , Ed., VCH Verlagsgesellschaft, Weinheim, West Germany, 1985, 55. 3. Obrusnik, I., Analysis of atmospheric aerosols by neutron activation, Chem. Lisfy, 8, 1 , 1986. 4. Fox, D. L., Air pollution, Anal. Chem.. 59, 280R, 1987. 5. Strahler, A. N. and Strahler, A. H., Introduction to Environmental Science, Hamilton Publishing Company, Santa Barbara, CA, John Wiley & Sons, New York, 1974. 6. Stevens, R. K. and Herget, W. F., Analytical Methods Applied to Air Pollution Measurement, Ann ArbOr 2.
Science Publishers, Ann Arbor, MI, 1974. 7. Stern, C., Ed., Air Pollution, 3rd ed., Monitoring and Surveillance of Air Pollution, Academic Press, New York. 1976.
Volume 11
559
8. Perry, R. and Young, R. J., Eds., Handbook of Air Pollution Analysis, John Wiley & Sons, New York, 1977. 9. M a l i , H., Ed., Analysis of Airborne Particles by Physical Methods, CRC Press, Boca Raton, FL, 1978. 10. Oikawa, K., Trace Analysis of Atmospheric Samples, Halsted Press Book, John Wiley & Sons, New York, 1977. 11. N. N., Sources and Effects of Ionizing Radiation, United Nations Scientific Committee on the Effects of Atomic Radiation 1977, Report to the General Assembly with Annexes, United Nations, New York, 1977, 72. 12. Ahuja, S., Cohen, E., Kneip, T. J., Lampert, T. L., and Zweig, G., Eds., Chemical Analysis of the Environment and Other Modern Techniques, Plenum Press, New York, 1973; Eisenbud, Environmental Radioactivity, 2nd ed., Academic Press, New York, 1973. 13. Drugov, Y. S., Bekov, A. B., Dyakova, G . A., and Tulchinskli, V. M., Methods for Analysis of Air Pollutants, Khimiya, Moscow, 1984, 384. 14. Suglmae, A., Air suspended particulates, Bunseki Kagaku, 10, 758, 1984. 15. Fuchs, M. A., Methods of determining aerosol concentration, Aerosol Sci. Technol., 5, 123, 1986. 16. Fletcher, R. A., A review of personal portable monitors and samplers for airborne particles, J . Air Pollut. Control Assoc., 34, 1014, 1984. 17. Wang, X., Design and calibration of impactors, Huanjlink Hunrue, 3, 1, 1984. 18. Sanchez, M., Losada del Barrio, J., Munoz Camacho, E., and Paz Castro, M., Measurement of air pollution, 4. Determination of particles, Ing Quim, 18, 115, 1986. 19. Sansoni, B. and Iyengar, V., Sampling and sample preparation methods for the analysis of trace elements in biological materials, Jiil-Spez-13 (ISSN 0343-7639). May 1978. 20. Klockow, D., Niessner, R., Jablonski, B., Denzinger, H., and Roenicke, G., Critical review of sampling techniques and determination methods for atmospheric strong acid, in Pollutants and Their Ecotoxicological Significance, Niirnberg, H . W . , Ed., Wiley, Chichester, U.K., 1985, 11; Klockow, D., Hartkamp, H., Lahmann, E., Laubereau, P. G., Niesner, R., Puxbaum, H., Ronicke, G., Sansoni, B., Seifert, B., and Vierle, O., Z. Anal. Chem., 326, 5 , 1987. 21. Johansson, Th. B., Van Grieben, R. E., and Winchester, J. W., Aerosol sampling by means of the cascade impactors, in Proc. 2nd Int. Conf. Nucl. Methods Environmental Pollution, International Atomic Energy Agency, Vienna, 1976, 125. 22. Merritt, R. I., Trace element content of precipitation in a remote area, Proc. Symp. Measurement, Detection and Control of Environmental Pollutants (Proc. SMDCEP), International Atomic Energy Agency, Vienna, 1976, 75. 23. Akselsson, R., Johansson, G., Malmkvits, K., Krismark, J., and Johansson, Th. B., Elemental abundance variation with particle size in aerosols from welding operations, 2nd Int. Conf. Nucl. Methods Environmental Research, Missouri, 1974, 395. 24. Spyrou, N. M., Maheswaran, P., Nagy, K., and Ozek, F., Neutron activation techniques in the detection and measurement of environmental Pollutants, Proc. SMDCEP (see reference 22), 151; Spyrou, N. M. and Kerr, S. A., Cyclic activation: the measurement of short-lived isotopes in the analysis of biological and environmental samples, J. Radiwnal. Chem., 48, 169, 1979. 25. Cohen, A. L., Dependence of Hi-Vol measurements on airflow rate, Environ. Sci. Technol., 7, 60, 1973. 26. Parkinston, N. F. and Grant, L. G., Activation analysis of particulate air contaminant, Nature, 197, 479, 1963. 27. Keane, J. R. and F i h e r , E. M. R., Analysis of trace elements in air-borne particulates by NAA and gamma-ray spectrometry, Atmos. Environ., 6, 603, 1968. 28. Spumy, K., Staub-Reinheit, Luft, 25, 5, 1968. 29. Spumy, K. and F i r , J., Staub-Reinheit, J . Staub, 30, 249, 1970. 30. Tuttle, R. F., Vogt, J. R., and Parkinson, T. F., Neutron activation analysis of trace elements in airborne particles, Proc. Symp. Nucl. Techniques in Environmental Pollution (Proc. SNTEP), International Atomic Energy Agency, Vienna 1971, 119. 31. Dams, R., Robbins, J. A., Rahn, K. A., and Winchester, J. W., Quantitative relationships among trace elements over industrialized N.W. Indiana, Proc. SNTEP, International Atomic Energy Agency, Vienna, 1971, 139; Anal. Chem., 6, 441, 1972. 32. Vogg, H. and Hiirtel, R., Spurenelementbestimmung in Luftstaubproben mittels Neutronenaktivierung, 2. Anal. Chem.. 267, 257, 1973; Meeting of the Gesellschaft Deutscher Chemiker on Trace Elements, Erlangen, 2. April 1973; J . Radioanal. Chem., 37, 857, 1977; Staub-Reinheit, Luft, 41, 53, 1981. 33. Zoller, W. H. and Gordon, G. E., INAA of atmospheric pollutants utilizing Ge(Li) y-ray detectors, Anal. Chem.. 42, 257, 1970. 34. Hwang, J. Y., Trace metals in atmospheric particulates and atomic absorption spectrometry,Anal. Chem., 44, 14, 20A, 1972. 35. Delany, A. C., Pollock, W., and SheMlovsky, J., Properties of cellulose paper filters, J. Geophys. Res., 78, 27, 1973, and 79, 36, 1974.
560
Activation Analysis
36. Wilkniss, P. E. and Larsen, R. E., Use of activation analysis to determine the chemical composition and origin of particulates collected in the marine atmosphere, Proc. SNTEP, International Atomic Energy Agency, Vienna, 1971, 159. 37. Aras, N. K., Zdler, W. H., Gordon, G. E., and Lutz, G. J., IPAA of atmospheric particulate material, Anal. Chem., 45, 1481, 1973. 38. Schwegler, H., Emissionsmessungen von Kraftfahneugabgasen in Bayern, in Schrifrenreihe des Vereins fir Wasser-. Boden- und Lujihygiene, Meinck, F., Ed., Gustav-Fischer-Verlag, Stuttgart, 1974, 4. 39. Mott, W. E. aad Orange, J. M., Precision of AA with 14-MeV neutrons, Anal. Chem., 37, 1338, 1965. 40. Jensen, B. and Nelson, J. W., Novel aerosol sampling apparatus for elemental analysis, J. Radioanal. Chem., 26, 356, 1975. indois,G., An automatic filter changer for collection of short-period HiVol 41. Rah, K., Beke, G., and W aerosol sampler, Atmos. Environ., 8, 635, 1974. 42. Maenhaut, W. a d ZsHer, W. H., Determination of the chemical composition of the south pole by INAA, J . Radioanal. Chem., 37, 637, 1977. 43. Dams, R., Biilit, J., Bleck, C., Demuynck, M., and Janssens, M., Complete chemical analysis of airborne particulates, Afmos. Environ., 9, 1099, 1975. 44. Schutyser, P., Govaerts, A., Dams, R., and Hoste, J., NAA of platinum metals in airborne particulate matter, Radioanal. Ckem.. 37, 651, 1977. 45. Salmon, L., Atkins, D. H. F., Fisckr, D. V., and Law, V., Retrospective analysis of the content of U.K. air particulate material 1957-1974, Sci. Total Environ., 9, 161, 1978; Radioanal. Chem., 37, 867, 1977. 46. Banelo, S., Yam-, Y., and Murakami, Y., Radioactivation analysis for the determination of trace elements in air pollutants, Proc. SNTEP,Inkrnationd Atomic Energy Agency, Vienna, 1971, 169. D. J., Pml Pprkhrsea, T. F., NAA of automobile exhaust pollutants, 47. W e s , T. W., Furr, A. K., A*, J . Radioanal. Ckem., 37, 881, 1977. 48. Hapke, B. K., The determination of 26 elements in street dust samples from London, New York and other three small urban cities, Atmos. Environ., 20, 605, 1986. 49. Ferfpsen, J. E., Forbes, E. A., Schroede, R. J., PML Ryan, D. E., The elemental composition and sources of house dust aid street dust, Note, Sci. Total Environ., 50, 217, 1986; see also 52, 239, 1986. 50. A W i , A., Cesaap, A., and Ternmi, M., Determination of silver traces in air by NAA, J. Radioanal. Chem., 34, 185, 1976. 51. A I h , A. and Sessoai, B., Monostandard epithennal NAA of soils and rocks, Trans. Am. Nucl. Soc., 32, 203, 1979. Studies on airborne dust particles by NAA, Kyoto Furitsu Daigaku GakujutsuHokoku, 52. Aoki, A. and I*, Nokagu, 25, 31, 1974; 23, 55, 1972; 26, 53, 1975. 53. Atkias, D. H. F., F i r , E. M. R., and Sahon, L., AERE-R-6724, Oct. 1972. 54. Bate, L., L i i r g , S., and Andrew, A., Elemental analysis of water and air solids by NAA, J. Radioanal. Chem., 32, 125, 1976. 55. Belot, Y. and M d , T., Analysis par activation neutronique des polluants atmosph6riques solides avec une technique de standard interne, J. Radioanal. Chem., 19, 3 19, 1974. 56. Bogen, J., Trace elements in atmospheric aerosol in the Heidelberg area, measured by INAA, Atmos. Environ., 7, 1117, 1973. 57. Brar, S. S. and Nelson, D. M., Thermal NAA of airborne particulate matter in Chicago metropolitan area, The 1968 Int. Conf. Modem Trends in Activation Analysis (IC. MT,AA), Vol. 1.43, 1968; Trans. Am. Nucl. Soc., 12, 2,485, 1969; J. Geophys. Res., 75, 15, 2939, 1970. 58. Buat-Menard, P., Lamb&, C. E., Arnold, M., and Chesselet, R., Multielemeut NAA measurements towards the geochemistry of p;uticulate matter exchange between continent-atmosphere-ocean,J. Radioanal. Chem., 55, 445, 1980. 59. Cawse, P. A. and Pelrseg, D. H., Survey of atmospheric trace elements in U.K., AERE-R-7134 (1972); AERE-R 8869 (1977); AERE-R 9886 (1985). 60. Cercasov, V., Method of simultnneous determination of A1 and Si in atmospheric aerosols by 14 MeV NAA, J. Radioarurl. Chem., 52, 399, 1979; Investigation of the atmospheric particulates deposited on leaves using INAA, Afmos. Enviroa., 19, 681, 1985. 61. Chuaag, L. S. aad K w q , L. S., Nondestructive rnulti-element determination of air particulates in Hong Kong, J. Radioanal. Chem., 49, 103, 1979. 62. Dams, R. J., Temmemm, G., Ped VPnhoerne, M., Nuclear Activation Technology in L i e Sciences, Roc. Symp. Bled, International Atomic Energy Agency, Vienna, 1972, 233. 63. Desaedeleer, G., R e m u , C., and Apers, D., Applicability of proton AA to describe the occurrence of Pb along a freeway in a rural area, Anal. Chem., 48, 572, 1976; J. Radioanal. Chem., 32, 117, 1976. 64. El-Hessadi, A., A h , A., All, S. S., Fareoq, R., H d , A., and Wed,T., The analysis of air dust . samples from Benghazi for trace elements using NAA and flameless atomic absorption,3. R a d i o a ~ lNucl. Chem., 81, 359, 1984.
Volume 11
561
65. Fiscker, J., Ringer, H., and SPnsoni, B., Jahresberichte des Inst. fiir Strahlenschutz (ISS), GSF-Bericht, 1971, 149; 1972, 240; 1973, 121, 140, and 145. 66. Flugger, H., Palmyron, F., Kemp, K., RISO-338, ISBN 87550038 A, March 1976, 70, INIS Atomindex 7, 1976, RN 270078. 67. Friend, J. P., The high altitude sampling program, DASA-1300, 1961, 5. 68. Fukuzaki, N., Yanaka, T., and Urushiyama, Y., Effects of studded tires on roadside airborne dust pollution in Niigata, Japan, Atmos. Environ., 20, 377, 1986. 69. Gladney, E. S. and Sedlacek, W. A., Comparative determination of Br and I in 3 air sampling media via instrumental thermal and epithermal NAA, J. Radioanal. Chem.. 78, 213, 1983. 70. Gordon, C. M. and &Her, W. H., 19th Annu. Meet. Am. Chem. Soc., Chicago, IL, U.S., June 10, 1973, Trans. Am. Chem. Soc., 16, 42, 1973. 71. Haddad, E. and Zikovsky, L., Determination of Al, As, Co, Cr, Cs, Fe, Mn, Sb, Sc, W and Zn in the workroom air by INAA, J. Radioanal. Nucl. Chem.. 93, 371, 1985. 72. Hamilton, E. P. and Chatt, A., Determination of trace elements in atmospheric wet precipitation by INAA, J. Radioanal. Chem.. 71, 29, 1982. 73. Hammerle, R. H., March, R. H., Rengan, K., Giauque, R. D., and Jaklevic, J. M., Test of X-ray fluorescence spectrometry as a method for analysis of the elemental composition of atmospheric aerosols, Anal. Chem., 45, 139, 1973. 74. Hassan, 0. and Spyrou, N. M., Air pollution study of Guildford, Survey using NAA, Nucl. Activation Technol. in Life Sciences, Bled, Yugoslavia, 10 - 14 April 1972, International Atomic Energy Agency, Vienna, 1972, 263. 75. Heindrycks, R. and Dams, R., Evaluation of three procedures for NAA of elements in atmospheric aerosols using short-lived isotopes, Radiochem. Radioanal. Len., 16, 209, 1974. 76. Heydorn, K., Continuous quality control of analytical results from NAA of air filter samples based on the analysis of precision, Roc. SMDCEP, IAEA, Vienna, 1976, 61. 77. Janssens, M., Desmet, B., D m , R., and Hoste, J., Determination of U, Sb, In, Brand Co in atmospheric aerosols using epithermal NAA and a low-energy photon detector, J. Radioanal. Chem., 26, 305, 1975. 78. Jervis, R. E., Pacija, J. J., and Chattopadhyay, A., Characterization of urban aerosols and their hazard assessment, by size sampling combined with inter-element ratios, Proc. SMDCEP, International Atomic Energy Agency, Vienna, 1976, 125. 79. Jervis, R., Tiefenbach, B., and Chattopadhyay, A., Scakp hair as a monitor of population exposure to environmental pollutants, J. Radioanal. Chem.. 37, 75 1, 1977. 80. Johnson, D. L., Davis, B. L., Dzubay, T. G., Hassan, H., Courtney, W. J., Taklevic, J. M., Thompson, A. C., and Hopke, B. K., Chemical and physical analysis of Houston aerosol for interlaboratory comparison of source apportionment procedures, Atmos. Environ., 18, 1539, 1984. 81. Kate, T., Sato, N., and Suzuki, N., Nondestructive multieiement photon-activation analysis of environmental materials, Talanta, 23, 517, 1976. 82. Khandekar, R. N., Kalkar, D. N., a d Vohra, K. G., Bromine to lead ratios in suspended air particulate matter in Greater Bombay, Atmos. Environ., 16, 621, 1982. 83. Kurinov, A. D., Roschektaev, B. M., Shevaldin, 0. A., and Shekel, E. S., Determination of elementaq composition of atmospheric aerosols by INAA, Zh. Anal. Khim., 35, 1773, 1980. 84. Kuykendall, W. E., Jr., Fite, L. E., and Wainardi, R. E., INAA of air filter samples, J . Radioanal. Chem.. 19, 351, 1974. 85. Lee, M., Rouse, J., Spicer, B., a d Chaudhri, M., Environmental and ecological studies using photon activation analysis, J . Radioanal. Chem., 37, 889, 1977. 86. LiniRger, R., Duce, R., Winchester, J., and Matsea, W., Analysis of C1, Br, I, and Pb in aerosols from Cambridge, Massachusetts, J. Geophys. Res., 71, 2457, 1966. 87. Loucks, 8. H., W i e s t e r , W., Matsen, W. R., a d T i m y , M., The halogen composition of aerosol particles over Lake Michigan, Proc. 1968 Int. Conf. Modem Trends in AA, NBS Special Publication, National Bureau of Standards, Washington, D.C., 36, 1968. D. H., INAA of effluents from coal-fired power 88. Lyon, W. S., Bottm, N. E., Emery, J. F., and Wi, plants, Proc. 2nd I R ~Conf. . Nuclear Methods in Environmental Research, Missouri, 1974, 376. 89. Moattar, F., RPhimi, H., and AbeBiai, M., Determination of some toxic trace elements in airborne particulate matter using NAA, Radiochem. Rdioanal. Len., 50, 269, 1982. 90. Moyers, J. L. and Duce, 8. A., The collection and ddermination of atmospheric gaseous Br and I, A d . Chim. Acta. 69, 117, 1974. 91. Meyers, J. L., Zoller, W. H., Duce, R. A., nad Hdlarann, G. L., Gaseous Br and particulate Pb, V , and Br in a polluted atmosphere, Environ. Sci. Technol., 6, 68, 1972. 92. Nnkaeishi, T. and Ssnsoai, B., Low energy photon spectrometry in nondestructive AA: Zn in air dust, AED-Conf-75, 638-005, INIS Atomindex 7, 1976, RN 257136. d Agniku, C., Determination of particulate air pollutants 93. Navarette, M., Gavez, L., Tmntikaatzen, E., a in Mexico City using activation analysis, Radiochem. Radioanal. Lett., 19, 163, 1974.
94. Obrusnik, I., Starkova, B., and Blazek, J., INAA of fly ash, aerosols and hairs, J. Radioanal. Chem., 54, 311, 1979, and 31, 495, 1976; Proc. SMDCEP, International Atomic Energy Agency, Vienna, 1976, 113. 95. Oelmez, I., Trace elements in the atmosphere determined by nuclear AA and their interpretation, J. Radioanal. Chem., 37.67 1, 1977; Anal. Chem., 46,7935,1974; Oelmez, I . and Gordon, G. E., Combined INAAIXRF analyses of atmospheric particulate samples for receptor modeling, Trans. Am. Nucl. Soc., 49, 145, 1985. %. Owlya, A., Kasral, M., and Massoumi, R., Nondestructive NAA of atmosphere pollutants, J. Radioanal. Chem., 34, 381, 1976. 97. Phelan, J. M., Finnegnn, D. L., Ballantine, D. S., Zoller, W. H., Hart, M. A., and Moyers, J. L., Airborne aerosol measurements in the quiescent plume of Mount St. Helens, Geophys. Res. Len., 9, 1093, 1982. 98. Prendez, M., Oritz, J. L., Cortes, E., and Cassorla, V., Elemental composition of airborne particulate matter from Santiago City, Chile, 1976, J. Air Pollut. Control Assoc., 34, 54, 1984. 99. Ragaini, R. C., Ralston, H. R., Garvis, D., and Kaifer, R., INAA Techniques, UCRL-51850, 1975, 46, NSA, 32, 1975, No. 21827. 100. Renfro, W. B. and Jester, W. A., Collection and AA of airborne gunshot residues, Trans. Am. Nucl. SOC.,15, 718, 1972. 101. Ronneau, C. and Deseadeleer, G., Immissions, en millieu rural de polluants emis par des zones industrielles CloignCes, Proc. SMDCEP, International Atomic Energy Agency, Vienna, 1976, 165. 102. Sabucu, M., Erten, H. N., and Aras, N. K., Trace elements in the atmosphere of Ankara, J. Radioanal. Nucl. Chem.. 100, 15, 1986. 103. Schramel, P., Samsahl, K., and Pavlu, J., Determination of 12 selected microelements in air particles by NAA, J. Radioanal. Chem., 19, 329, 1974. 104. Shani, G., Haccoun, A., and Kushelevsky, A., Aerosol and air pollution study by NAA, J. Radioanal. Chem.. 76, 249, 1983; Aerosol and air pollution size distribution, Atmos. Environ., 18, 2223, 1984. 105. Shum, Y. S. and Lovelland, W. D., RLO-22277'7-27, 1974, 27; NSA 31, 1975, 1994. 106. Van der Shot, H. A. and Das, H. A., Determination of Hg in air by NAA, Anal. Chim. Acta, 70, 439, 1973. 107. Van Grieken, R. and D m , R., Determination of Si in natural and pollution aerosols by 14-MeV NAA, Anal. Chim. Acta, 63, 369, 1973. 108. Wesolowski, J. J., Appel, B. R., and Alcwer, A., Report No. 138, Air and Industrial Hygiene Laboratory, Department of Public Health, Berkeley, CA, 1973. 109. Winchester, J. W., Application of NAA to the investigation of natural and pollution aerosols, J. Radioanal. Chem., 19, 31 1, 1974, and references therein; Winchester, J. W. and Duce, R. A., Natunvissenschaften, 54, 110, 1967. 110. Yang, S., Qian, Q., and Yang, Y., Determination of composition in size of airborne particulate matter by INAA, 7th Int. Conf. MTAA, Part 2. Applications, Denmark, 1986, 1105. 111. Ziousky, L. and BadMo, M., I n d i i t study of air pollution by NAA of snow, 7th Int. Conf. MTAA, Part 2. Applications, Denmark, 1986, 1119. 112. ZoUer, W. H., Arm, N. K., Gladney, E. S., and Lutz, G. J., Int. Conf. Photonuclear Reactions and Applications, Pacific Grove, California, USA, 26 March 1973, 1007; CONF-730301-ps; NSA 28, 1973, 29576; Atmos. Environ., 10, 1015, 1976. 113. De Solte, D., GUbels, D., and Hoste, R., NAA, Wiley Interscience, London, 1972. 114. Bowen, H. J. and Gibbons, D., Radioactivation Analysis, Clarendon Press, Oxford, 1963. 115. Bartboment, D., Buissiers, P., and Laverlochere, J., Production and use of Short-lived Radioisotopes from Reactors, 11, International Atomic Energy Agency, Vienna, 1963, 79. E., A routine procedure for multielement analysis of atmospheric particulates 116. Kronoborg, D. and Stein-, by INAA, Radiochem. Radioanal. Lett., 21, 379, 1975. 117. Ralston, H. R. and Wilcox, G. E., A computer method of peak area determination from Ge(Li) gamma spectra, Roc. 1968 Int. Conf. MTAA, Gaithersburg, MD, 1969, 1238. 118. Leithe, W., Die Analyse der Lull und ihre Verunreinigungen in der freien Atmosphiire und am Arbeitsplatz, Wissenschaftliche Verlags-Gesellschaft mbH, Stuttgart, 1974. 119. Alian, A. and Sansoni, B., INAA of geological and pedological samples. Further investigation of epithermal NAA using monostandard method, J. Radioanal. Chem., 59, 51 1, 1980; see the references therein. 120. Alian, A. and Sansoni, B., Review on the monostandard method in multielement NAA, in Instrwnentelle Multielementanalyse, Sansoni, B., Ed., VCH-Verlagsgesellschaft, Weinheim, West Germany, 1985, 109; see references therein. 121. Lievens, F., Analysis of air dust, BLG-480, April 1973, 22, NSA 29, 1974, No. 15. 122. Grass, F. and Westphal, G., Multielementanalysen durch Neutronenaktivierung von kunlebigen Kernzustiinden, Nucl. Instrum. Methods, 140, 97, 1977. 123. Sansoni, B., Iyer, R. K., and Kurth, R., Concentration of analytical data as part of data processing in trace element analysis, Fresenius 2.Anal. Chern., 306, 212, 1981.
Volume I1
563
124. Pikpers, F. W. and Kateman, G., Quality Control in Analytical Chemistry, John Wiley & Sons, New York, 1981. 125. Hays, W. L., Statistics for the Social Sciences, Holt, Rinehart & Winston, London, 1973. 126. Sachs, L., Angewandte Statistik, Planung und Auswertung, Methoden undModelle, Springer-Verlag,Berlin, 1974. 127. Massart, D. L., Dikstra, A., and Kaufman, L., Evaluation and Optimization of Laboratory Methods and Analytical Procedures, Elsevier, Amsterdam, 1978. 128. Bradley, J. V., Distribution-Free Statistical Tests, Prentice-Hall, Englewood Cliffs, N.J., 1968. 129. Barnett, V., Outliers in Statistical Data, John Wiley & Sons, Chichester, U.K., 1978. 130. Kowalski, B. R., Ed., Chemometrics, Mathematics and Statistics in Chemistry, D. Reidel, Dordrecht, Holland, 1984. 131. Alian, A. and Sansoni, B., Determination of trace elements in biological materials, water and air dust by some newer techniques of NAA, Proc. Semin. Trace Analysis (FRG and Egypt), Cairo, 1977, 12. 132. Govindaraju, K., 1984 Compilation of working values and sample description for 176 International Reference samples of mainly silicate rocks and minerals, Geochemical Standard Letters, Vol. VIII, 3, 1984; see also Seward, R. W., Ed., NBS Standard Reference Material Catalog 1986-87, NBS Special Publication 260, U.S.National Bureau of Standards, Washington, D.C., 1986. 133. Kim, J., NAA by the monostandard method, J. Radioanal. Chem., 63, 121, 1981, and references therein. 134. Alian, A., Nakanishi, T., and Sansoni, B., Epithermal NAA using the monostandard method -extention to other elements, biological and environmentalsamples, AED-Conf-75-638-015, KFA Jiilich GmbH (FRG), Book of Abstracts, 1976, 29; INIS Atomindex, 7, 1976, RN 257089. 135. Alian, A., Djingova, R. G., Kriiner, B., and Sansoni, B., The monostandard method in thermal NAA of geological, biological and environmental materials, Z. Anal. Chem., 319, 47, 1984; see also JUL-1822, January 1983 (ISSN 0366-0885). 136. Winchester, J. W., Atmospheric aerosol chemistry of S: nuclear accelerator methods in energy-related research, 3rd Int. Conf. Nucl. Methods in Environmental and Energy Research, University of Missouri, October 10 to 13, 1977; Trans. Am. Nucl. Soc., 18, 326, 1965. 137. Duce, R. A. and Winchester, J. W., Determination of I, Br, and C1 in atmospheric samples by NAA, Radiochim. Acta, 4, 100, 1965; J . Geophys. Res., 68, 3943, 1963, and 70, 1775, 1965. 138. Gordon, C. M. and Larson, R. E., Activation analysis of aerosols, J. Geophys. Res., 69, 2881, 1964. 139. Lee, J. and Jervis, R. E., Detection of pollutants in airborne particulates by activation analysis, Trans. Am. Nucl. Soc., 11, 50, 1968. 140. Parsa, B. and Markovitz, S. S., Determination of Pb in atmospheric air and in A1 by 'He-induced nuclear reactions, Anal. Chem.. 46, 186, 1974. 141. Parizek, J., Proc. Symp. Nucl. Act. Techniques in the Life Sciences, International Atomic Energy Agency, Vienna, 1972, 117. 142. Pillay, K. K. S., Activation analysis and dendrochronology for estimating pollution histories, J. Radioanal. Chem.. 32, 151, 1976. 143. Das, H. A., Evendijk, J. E., and Dejong, J. R. M., The determination of Ni in air dust by NAA, J. Radioanal. Chem., 13, 413, 1973. 144. Mamuro, T., Proc. Japanese Conf. Radioisotopes (Aug. 1974) 11, 125; INIS Atomindex 7, 1976, RN 239502; Annual Rep. Rad. Centre Osaka Prefecture (Mar. 1974). 14, 1; INIS Atomindex 7, 1976, RN 243862; RN 243863; RN 254764., (see references therein). 145. Orishima, H., Koga, T., Kawai, H., Kitsurama, Y., and Tsuruta, T., Hoken Butsuri, 8, 153, 1973 (in Japanese); NSA 29, 1974, 9797. 146. Foti, S., Delicchi, E., and Akamian, V., Determination of picogram amounts of WTc by NAA, Anal. Chim. Acta. 60, 26, 1972. 147. Govaerts, A., Gijbels, R., and Hoste, J., The determination of Re in flue dust by NAA, Anal. Chim. Acta, 62, 79, 1972. 148. Zmijewska, W., Activation analysis of Hg in environmental samples, J . Radioanal. Chem.. 35,389, 1977. 149. Dams, R., Rahn, K. A., R o b b i , J. A., Niong, G. D., and Winchester, J. W., Multielement analysis of air pollution particldatesby nondestructive neutron activation, Proc. 2nd Int. Clean Aii Congress, Englund, H. M., Ed., Academic Press, New York, 1971, 509. 150. Shani, G. and Hacoum, A., Nuclear methods used to compare air pollution in a city and pollution-free area, Proc. SMDCEP, International Atomic Energy Agency, Vienna, 1976, 89. 151. Block, C., Dams, R., and Hoste, J., Chemical composition of coal and fly ash, Proc. SMDCEP, International Atomic Energy Agency, Vienna, 1976, 101. 152. Sansoni, B., Alian, A., Iyer, R. K., and Petri, H., INAA of air dust near Munich and environmental data evaluation problems, Trans. Am. Nucl. Soc., 32, 1979, 179; 25th Annu. Meet. Am. Nucl. Soc., June 3 to 7, 1979, Atlanta, GA. 153. Maenhaut, W., Zoller, W. H., Duce, R. A., and Hoffman, R. A., Concentration and size distribution of particulate trace elements in the south polar atmosphere, J . Geophys. Res., 84, 2421, 1979.
564
Activation Analysis
154. Adams, F., Van Crean, M., Van Espen, P., and Andrenzzi, D., The elemental composition of atmospheric aerosol particles at Chacaltaya, Bolivia, Armos. Environ., 14, 879, 1980. 155. Escalona, L. and Sanhueza, E., Elemental analysis of the total suspended matter in the air in downtown Caracas, Armos. Environ., 15, 61, 1981. 156. Giiboy, W. B., Maison, P. I., and Tout, R. E., The variation in environmental pollution, J. Radioanal. Chem., 48, 327, 1979. 157. Lambert, J. P. F. and Wilshire, F. W., NAA for simultaneous determination of trace elements in ambient air collected on glass-fiber filters, Anal. Chem., 51, 1346, 1979. 158. Matsuo, Y., Hashimoto, Y., Solt, J., and Kemeny, T., Proc. IMRKO Cong. Int. Measurement Confederation, May 1979, Moscow, U.S.S.R., 1979, 557. 159. Weber, G., Activation analysis with short-lived nuclides in aerosol physics, J. Radioanal. Chem., 61, 335, 1981. 160. Kut, D. and Savikaya, Y., Determination of Se in atmospheric particulate material of Ankara and its possible sources, J. Radioanal. Chem., 62, 161, 1981. 161. Bahal, B. M. and Pepelnik, R., Multielement analysis of a Milanese air-dust sample by 14 MeV NAA, J . Radioanal. Nucl. Chem., 97, 359, 1986. 162. de Bruin, M. and Wolterbeek, H. T., Identification of sources of heavy metals in the Dutch atmosphere using air filter analysis, in Nuclear Methods in Environmental and Energy Research, Proc. of 5th Int. Conf., Vogt, Ed., 1984, 266. 163. Burgers, D. D., Evaluation of membrane filters for INAA for airborne particulates, J. Radioanal. Chem., 74, 253, 1982. 164. Chapuis, A. and Mouadili, A., Determination of atmospheric Si by NAA, J. Rech. Atmos., 16, 261. 1982. 165. Doichinov, S. L., New application of dependence between mean times of sampling and maximal air pollutant concentrations, Dokl. Bolg. Akad. Nauk, 35, 1681, 1982; C.R. Acad. Bulg. Sci., 36, 97, 1983. 166. Fujimura, M. and Hashimoto, Y., Particle size distribution and behavior of sulfate aerosols in a coastal region, Taiki Osen Gakkaishi, 14, 16, 1979. 167. Heaton, R. and Rahn, K. A., In-cloud oxidation of SO, as deduced from trace elements in aerosol and precipitation, Heterogeneous Processes in Source-Dominated Atmosphere, Proceedings, Novakov, Ed., 1986, 77 (NTIS. PC A06IMF AOI; 1). 168. Hertelendi, E. and Csonger, E., Contamination effects of nuclear weapon tests in the atmosphere, Fit. Sz., 34, 339, 1984. 169. Ketelsen, P. and Knoechel, A., Analysis of micro-amounts of aerosol dusts sorted according to size by means of XFA, with totally reflecting sample carrier as well as by NAA, Abstr. 2nd Colloquium Anal. Chem. Res. and Application, Karlsruhe, West Germany, 1982, 26. 170. Obrusnik, I., Analysis of aerosol samples by INAA method using long-term activation, Radioaktiv. Zivotn. Prosr., 6, 351, 1983. 171. Olmez, I. and Gordon, G. E., Combined INAAIXRF analyses of atmospheric particulate samples for receptor modeling, Trans. Am. Nucl. Soc., 49, 145, 1985. 172. Parekh, P. P. and Husain, L., Trace element concentrations in summer aerosols at rural sites in New York State and their possible sources, Amtos. Environ., 15, 1717, 1981. 173. Pung, T. C., Chou, C. C., Tsai, H. T., and WH,S. C., Internal-standard method for multielement NAA of airborne particulates in Taiwan, Ho Tzu KO Hsueh, 17, 19, 1980. 174. Pushkin, S. G. and Gilbert, Eh. N., Multi-element AA of atmospheric aerosols with X-ray and yspectrometric recording of radionuclides being formed, IN. Sib. Otd. Akad. Nauk SSSR, Ser. Khim. Nauk, 11, 57, 1984. 175. Rambaek, J. P., Atmospheric deposition of heavy metals studied by analysis of moss samples using NAA and atomic absorption spectrometry, in Nuclear Methods in Environmental and Energy Research, Vogt, 1. R., Ed., 175, 1980; Steimes, E., J. Radioanal. Chem., 58, 387, 1980. 176. Santroch, J., Analysis of trace elements in aerosols, Radioaktiv. Zivotn. Prost, 3, 45, 1980. 177. Vleggaar, C. M., Van As, D., Watkins, J. L., Mingay, P. W., Wells, R. B., Briggs, A. B., and Louw, C. W., Trace elements in airborne particulates in South Africa, Atomic Energy Board, South Africa (0612000), PEL-274; DE 81700252, Oct. 1980. 178. Voigt, R. and Lieser, K. H., Determination of trace elements in airborne dust by means of NAA, Semin. Radionuclide Technology, Abstracts, Karlsmhe, West Germany, Mav 1981, 24.
180. Suschny, O., Multi-element standards, lnstrumentelle Multielementanalyse. Sansoni, B., Ed., VCH-Verlagsgesellschaft mbH., Weinheim, West Germany, 1985, 491. 181. Dams, R., Application of multi-elemental neutron activation analysis in environmental research, in Instrumentelle Multielementanalyse, Sansoni, B., Ed., VCH-Verlagsgesellscaft mbH., Weinheim, West Germany, 1985, 577.
Volume N
565
182. Schmitt, B. F. and Segebade, C., Instrumentelle Analyse von Luftstaub durch Aktiviemng mit Photonen und Photoneutronen, in lnstrumentelle Multielemenmnalyse, Sansoni, B . , Ed., VCH-Verlagsgesellschaft mbH., Weinheim, West Germany, 1985, 594. 183. Tiel, K., Peters, J., Schriider, W., Multi-element analysis of single dust grains in the pg-mass range, in Instrurnentelle Multielementanalyse, Sansoni, B . , Ed., VCH-Verlagsgesellschaft mbH., Weinheim, West Germany, 1985, 598. 184. Michaelis, W., Fanger, H.-U., Niedergesiiss, R., and Schwenke, H., Intercomparison of the multielement analytical methods TXRF,NAA and ICP with regard to trace element determinations in environmental samples, in Instrumentelle Multielementanalyse, Sansoni, B . , Ed., VCH-Verlagsgesellschaft mbH., Weinheim, West Germany, 1985, 693. 185. de Bruin, M., von Wijk, P. M., van Assema, R., and de Roos, C., The use of multi-element concentration data sets obtained by INAA in the identification of sources of environmental pollutants, J . Radioanal. Nucl. Chem., 112, 199, 1987. 186. Amundsen, C. E., Hanssen, J. E., Rambaek, J. P., Semb, A., and Steinnes, E., Long-range transport of trace elements to Southern Norway studied by INAA of air filters, J. Radioanal. Nucl. Chem., 114, 5, 1987. 187. Cercasov, V. and Schreiber, H., Foliar contamination and uptake from aerial sources investigated by INAA and XRFA, J. Radioanal. Nucl. Chern., 114, 21, 1987. 188. Wyttenbach, A., Bajo, S., and Tobler, L., Aerosols deposited on spruce needles, J. Radioanal. Nucl. Chem., 114, 137, 1987. 189. Krivan, V. and Egger, K. P., Multielementanalyse von Schwebstauben der Stadt Ulm und Vergleich der Luftbelastung mit anderen Regionen, Fresenius Z. Anal. Chem., 325, 41, 1986. 190. Sansoni, B., Einfiihrung in die Instrumentelle Multielementanalyse, in Instrurnentelle Multielementanalyse, VCH-Verlagsgesellschaft mbH., Weinheim, West Germany, 1985.
Volume 11
567
Chapter 14
ACTIVATION ANALYSIS IN AGRICULTURE AND BOTANY Eiliv Steinnes
TABLE OF CONTENTS Introduction .....................................................................568 Some General Trends in the Development of Neutron Activation Analysis ........................................................................568 Soil Analysis ....................................................................569 A. Bulk Soils ...............................................................570 B. Soil Solution ............................................................570 C. Soil Extracts .............................................................570 D. Polluted Soils ............................................................571 Plant Analysis ..................................................................572 A. Vascular Plants .......................................................... 572 B. Nonvascular Plants ......................................................572 Miscellaneous Applications .....................................................573 A. Fertilizer Analysis .......................................................573 B. Radioecological Studies .................................................573 C. Analytical Reference Materials ..........................................573 Future Developments
........................................................... 573
References ..............................................................................574
568
Activation Analysis
I. INTRODUCTION The first applications of activation analysis to the determination of trace elements in plants and soils date more than 30 years back.'s2 The first review by Bowen of the literature in this area appeared in 1967 and documented a considerable activity in the field of plant analysis while applications on soils were more ~ c a r c eAs . ~ apparent from the 1983 review by Salmon and Cawse, however, activation analysis is now also a well-established technique in soil a n a l y ~ i sIt. ~must still be admitted that activation analysis has never been generally recognized as one of the major tools in studies related to agriculture and botany. That may be illustrated by two fairly recent textbooks on nuclear techniques in agriculture where the treatment of activation analysis is rather superficial and far from being ~ p - t o - d a t e . ~ . ~ The present chapter is intended to be a survey of the major developments and trends in this field, and no attempt is made to cover the literature completely. For a more general treatment of the basics of activation analysis, the reader is referred to other parts of this volume. The two main sections are on soils and plant materials, respectively. No distinction is made between samples of agricultural crops and naturally growing plants, or between natural and agricultural soils, since the analytical aspects are very similar. Although other activation sources have been used to some extent, irradiation with thermal neutrons in a nuclear reactor is by far the activation technique most commonly employed in this area, and unless otherwise stated, the applications referred to in the subsequent test are based on reactor neutron activation analysis. An indication of the applicability of activation methods to the study of different elements in soils and plants as apparent from the literature may be obtained from Table 1.
11. SOME GENERAL TRENDS IN THE DEVELOPMENT OF NEUTRON ACTIVATION ANALYSIS When nuclear reactors became available in a number of countries in the period around 1960, applications of neutron activation analysis (NAA) grew very fast. As indicated in Table 2, this new technique showed detection limits for a major number of elements that were far superior to those obtainable by other techniques available at that time. In order to carry out the determinations, fairly time-consuming radiochemical separationswere necessary in most cases. Once this work was done, however, results of good accuracy could be readily obtained. In many areas, including the analysis of soils and plant tissue, this facilitated for the first time, the determination of the correct concentration levels of a great number of trace elements. Subsequently other analytical techniques improved their sensitivity to an extent that made them comparable to NAA. In particular atomic absorption spectrometry (AAS) by flame and later on by graphite furnace developed to such an extent that many determinations where NAA was previously required, could be done simpler, cheaper, and with satisfactory sensitivity and accuracy by AAS. In spite of this, NAA was increasingly taken into use during the late 1960s and early 1970s due to the advent of Ge(Li) detectors that made the purely instmmental neutron activation analysis (INAA) a versatile and competitive multielement technique. Although in most cases far inferior to the radiochemical NAA sensitivity-wise, the much simpler-procedure and far higher capacity promoted the use of this technique. By combination of 1 t short and 1 long irradiation, about 25 elements in soils and 15 to 20 elements in ~ l a ntissues
on mosses or lichens where INAA appeared to make a significant contribution. In recent years, the rate of NAA applications in agriculture and botany seems to have
Volume 11
569
TABLE 1
Applications of Activation Analysis on Soil and Plant Material as Apparent from the Literature Element
Soil
Plant
Element
Soil
Plant
H
N
N
F
F
Li Be B N 0 F Na
N N
N N N
Fe Co Ni Cu
F S
F S
L
L
I
F
N N
N
Zn
F
N
Cs Ba
F F
N
Ga Ge As Se Br Rb Sr Y Zr Nb Mo Ru Rh Pd Ag Cd
L S
R.E.
F
Hf Ta W Re 0s Ir
F L S
N
Mg Al Si P S Cl
L L S S S
L
S F L L S S N F
K Ca
F F
F F
Sc Ti
F L L F F
F
v Cr Mn
F
L F F F
Note: F = frequently, L
=
N F F F F L S L S S N N N S S
S N F F F F L N S N S N N N L L
Element
Soil
Plant
In Sn Sb Te
N
N
S F N
N
Pt Au Hg TI Pb Bi Th
u
N
N N N S F N S S F
F N F F F
F L L S N N N N L F N N N F
F
less frequently, S = seldomly, N = never or very seldomly.
TABLE 2 "Interference-Free" Detection Limits by Thermal Neutron Activation Analysis Nanogram range
Elements
> 100
H,Li,Be,B,C,N,O,F,S
10-100
Mg, Si, Ca, Ti, Fe, Pb
1-10
K, Cr, Ge, Zr, Nb, Sn, Nd, TI, Bi Al, P, V , Ni, Zn, Se, Rb, Sr, Y, Mo, Ru, Rh, Ag, Cd,Te, Cs, Ba, Ce, Pr, Gd, Er, Hf, Os,
0.1-1
Pt 0.014.1 10.01
Na, CI, Sc, Co, Cu, Ga, As, Br, Pd, Sb, I, La, Tb, Tm, Yb, Ta, W, Re, Au, Hg, Th, U Mn, In, Sm, Eu, Dy, Ho, Lu,Ir
Note: Conditions: Neutron flux: 2 x 10% c m 2 s - ' . Irradiation time: 7 d or 3 half-lives of the induced radionuclide, whichever is shorter.
declined somewhat. This may partly be due to the advent of other multielement techniques, such as plasma emission spectrometry (ICP-ES) and very recently mass spectrometry with a plasma source (ICP-MS), but perhaps a more likely reason is the close-down of a great number of research reactors in many countries.
111. SOIL ANALYSIS Even though a soil may often represent a complex matrix rendering the analytical determination a rather difficult task, the greatest problems are likely to be associated with
570
Activation Analysis
the sampling process and the further handling of the soil sample. Sampling requires care and skill because of the inhomogeneous nature of the soil. A field sample usually weighs at least 500 g and must be dried, sieved, blended, and resampled in order to obtain a 0.1 to 1 g sample for activation. All these operations can involve contamination, in particular from the tools used. Mor?over, the total amount of an element in a soil may not be well correlated with the plant-available fraction or the more general bioavailability of the element because it is present in different chemical forms in the soil. It is, therefore, often desirable to extract the soil solution or prepare some other kind of soil extract, a process which may add further to the uncertainty of the final result. Regardless of this, activation analysis can offer the solution to many problems in soil science, and its possibilities are still far from being fully exploited.
A. BULK SOILS Neutron activation analysis has played a very significant role in trace element studies in the earth sciences. Although the analytical problems related to the analysis of mineral soils are very much the same as for other geological materials, the progress of NAA in soil analysis has been far less. While radiochemical NAA has been extensively used in rock analysis, the applications on soils are remarkably few. Most reports seem to be on "difficult" ~.~ and halogens." Only in a elements, such as arsenic,',' a n t i m ~ n y ~, ~e l e n i u m ,mercury,'O very few cases, the simultaneous determination of several elements is reported, such as Co, Cu, Mo, Ni, and Zn.12 Sometimes radiochemical separations have been used in connection with INAA procedures to include elements such as Mo, W, Sr, Cu, Zn, and Gal3 or Cu, Ga, Se, and Sr.I4 The purely instrumental NAA was first applied on soils using NaI(T1) detector^.'^-'^ Combination of a short and a long irradiation normally allows Na, Al, Sc, Mn, Fe, Co, La, and Sm, and occasionally a few other elements to be determined in this manner. The introduction of Ge(Li) detector^'^^'^^'^-^^ strongly enhanced the capability of INAA to soils. As indicated in Table 3, at least 25 elements can be determined routinely based on 1 short and 1 long irradiation, and frequently many more elements may be included. The application of INAA to soils is thoroughly described in the paper by Salmon and Cawse4 including a useful display of y-ray spectra typically observed from neutron activated soils at different decay times. For some elements, conditions for determination in geological material by INAA can be improved by irradiating only with the epithermal part of the reactor spectrum, absorbing Applications of epithermal NAA to soils the thermal neutrons, e.g., with cadmium have been reported by a few author^.'^,^^.^^ Another aspect of this technique is the reduction of matrix activity in soil samples to be processed radi~chemically.~~ Elements showing improved conditions for determination by epithermal activation are listed in Table 3. Instrumental photon activation analysis can also be advantageously used for the simultaneous determination of more than 20 elements in soil^.^^,^^ Some of the major elements in soil can be determined by 14-MeV NAA.27
B. SOIL SOLUTION The soil solution is most commonly separated from the moist soil by centrifugation or obtained in the field, e.g., by the use of lysimeters. Apart from investigations reported quite long time ago28-30mainly aiming at determination of macrocomponents, NAA has hardly been used to investigate soil solutions. Some data shown by Salmon and C a w ~ ehowever, ,~ indicate that INAA has a considerable potential also in this case.
C. SOIL EXTRACTS For estimation of plant-available trace elements in soil, a variety of extractants have been proposed. Among those more commonly used, 0.1 M HNO,, 0.5 M acetic acid, or
571
Volume 11 TABLE 3
Feasibility of Instrumental Activation Analysis with Thermal Neutrons for Elemental Determinations in Mineral Soils Element A
B
C
D
E Element A
B
C
D
E Element A
B
C
D
E
Note: A, Determined satisfactorily in all or most soils; B, determined satisfactorily in many soils; C, determined satisfactorily in more occasional cases, D, not possible to determine; E, improved conditions by epithermal activation.
mixtures of acetic acid/ammonium acetate are most convenient for NAA because the matrix elements do not produce any interfering radioactivity. Determinations of, e.g., Sr and Ba,31 in soil extracts by radiochemical NAA have been reported. By INAA using Ge(Li) detectors, 20 elements or more may be determined in certain soil extract^.^.^*.^^ Randle and H~trtmann~~ isolated humus fractions from soils employing conventional extraction techniques and analyzed the purified and dried samples for 16 elements by INAA. In all the above examples, extractions were carried out prior to activation. Kline et a1. ,35 however, measured the rate of exchange between TU in activated soils and dilute solutions of copper sulfate. Results based on postirradiation extractions appear to be somewhat questionable because the induced radioisotopes may behave different from their stable counterparts due to the Szilard-Chalmers e f f e ~ t . ~ D. POLLUTED SOILS INAA has been used in many cases to study soil pollutants airborne from local sources, e.g., As, Sb, Au, and Co from gold refining operation^,^^ As and Sb from a copper ~melter,~' and Br in roadside soils.38Norwegian studies of soils39and peat bog profiles4' indicated that long-range atmospheric transport is a dominant source of some trace elements in natural surface soils in the southern part of the country, including As, Sb, and Se determined by radiochemical NAA. More recently, INAA was used to determine 20 elements in similar
572
Activation Analysis
peat sample^.^' Amounts of Ag, As, Cd, Cu, Hg, and Zn detected in surface soils by various investigators using INAA may have been supplied in part from air pollution. Another area where INAA can be advantageously used is for the analysis of sewage sludge and soils to which it has been ~ u p p l i e d , ~and ' . ~ ~soils irrigated with waste water.27
IV. PLANT ANALYSIS A. VASCULAR PLANTS Some of the very early trace element work using radiochemical NAA was done in this field. Following the pioneer work of Smales and Pate,' Bowen developed methods for a range of elements, such as Sr and Ba,3' Ga and Mo," C1, Br, and I,45W,46 Cr,47and Sb, Cd, Ce, Ir, and Ag.48 Other workers published papers on U,49 Mo,~OA U , ~Hg,52 ] halog e n ~ ,and ~ ~rare - ~earth ~ element^.^^.^^ Fourcy and NeuburgeP reported methodology for the determination of a great number of elements in plant material. Travesi and Lee59developed a scheme for the simultaneous determination of Ba, Sr, As, Sb, Fe, Cu, Zn, and Cd. INAA with a NaI(T1) detector has not been extensively used on plant tissue due to the fact that only a few elements can normally be dete~mined.~~@-'.~~ These are Na, C1, K, Mn, Zn, and Br. In addition, P may be determined by counting of bremsstrahlung6' and Co using a well-type dete~tor.~' The introduction of Ge(Li) detectors increased the number of elements to between 15 and 20, somewhat depending on the ample,^'.^^-^^ and greatly extended the potentialities of INAA in plant analysis. For example, Koyama et a1.68in a study of potential accumulator plants for certain trace elements analyzed more than 2000 samples by INAA. Also in the case of plant material, epithermal activation may improve the determination of some elements, such as SF9 and C1, Br, I.70Jones et aL7' determined Si by reactor fast neutrons, irradiating the sample in a boron nitride capsule and employing the 29Si(n,p)29A1 reaction. 14-MeV neutrons have been found useful for the determination of N in plant seeds72 and F in plants subject to air pollution.73 Photon activation analysis was applied to the determination of Pb74 and 175in plant material, while Lee et al.76 used proton activation analysis to compare ashed roots of healthy and diseased trees. Carpenter77used the nuclear track technique for the determination of B and U in neutron activated plant samples. The potential of INAA for multielement analysis of plants as well as soils have facilitated several studies of trace element soil-plant relationship^,^^,^^@,^^ including uptake by food grown on fields fertilized with sewage sludge.79 The great sensitivity of NAA facilities the determination of 'trace elements in fractions of plant tissues. Hijfner et aLEOmeasured the content of Cu, K, Mn, and Zn in parts of individual seeds of ten species of grass, while Takeo and Shibuyasl determined the distribution of Cu, Mn, Br, Na, and K in different cell fractions from the tea plant. Fawcett et studied Co, Fe, Sc, Na, and Rb in pollen and sporopollenin. NAA has also been applied to the analysis of higher plants in studies related to air pollution, such as investigation of aerosols retained on trace elements in plants growing on soils of different acidity,84and trace elements in healthy and diseased trees.85 Another area of application related to pollutants is the determination of elements associated with pesticide residue^.^^-^^ Organochlorine and organobromine compounds are separated from inorganic forms of the elements by extraction with a nonpolar organic solvent which is subsequently reduced to a small volume and irradiated.87
B. NONVASCULAR PLANTS NAA has found several applications to trace element determinations in higher f ~ n g i . ~Liu ~ et , ~al.92 ~ -determined ~ ~ 17 elements in two species of fungus which cause wheat bunt disease. Mosses and lichens, receiving nutrients predominantly from the atmosphere, have been
Volume 11
573
frequently employed as indicators of air pollution in recent years. INAA was used for the which has been determination of 24 elements in the epigeic moss Hylocomium ~plendens,~' extensively used in Scandinavia for deposition measurements. Epiphytic lichens have become even more popular in this respect, and INAA has been used both in investigations related ~ ~ . ~ ~ to de Bruin,97 however, uptake to point sources94and in regional s t u d i e ~ .According from the substrate may limit the applicability of lichens to monitor air pollution.
V. MISCELLANEOUS APPLICATIONS A. FERTILIZER ANALYSIS Activation analysis has played a minor role in the analysis of fertilizers. 14-MeV neutrons can be used for rapid determination of the major components N, P, K, Ca, Mg, C1, and Si.98,99The fact that none of these major components form excessive amounts of radioactivity on thermal neutron activation should also make activation analysis with reactor neutrons on attractive technique for fertilizer analysis, e.g., with respect to trace elements in raw materials and final products. However, except for the work by Schnier and SchnugIoowho reported a study of trace element patterns in 29 different rock phosphates, no applications seem to have been reported. B. RADIOECOLOGICAL STUDIES In studies related to environmental radioactivity, e.g., in soil-plant systems, the specific activity of the radionuclides is important in determining their behavior. In several cases, NAA is a convenient technique for the determination of the stable naturally occumng isotope corresponding to a radioactive contaminant. This approach was employed by Fourcy et a1. lo' in the case of about 15 different elements. The case of Iz9Iis a special one because this long-lived radionuclide (t,,, = 1.6 x lo7 year) can be determined with high sensitivity by NAA.'02,'03The analysis may be camed out by separating iodine from the sample by volatilization prior to activation and then determine lZ7Iand 1291by means of the induced radioactivity of '281and I3OI, respectively. C. ANALYTICAL REFERENCE MATERIALS Reference materials are extremely important in trace element analysis both in general quality control work and in the development of new analytical methods. Activation analysis has played and is still playing a very significant role in the certification of reference materials, where it is important to be able to compare methods based on different physical principles in order to ensure the accuracy of the results. Bowen's kale104~'05 was for a long time the only reference material generally available for trace element determination in vegetable tissue, and has been analyzed in most of the investigations of plant material referenced in this chapter. More recently, a variety of botanical reference material have become available. '" The feasibility of NAA is the certification of biological standard reference materials as illustrated by the comprehensive paper by Guzzi et al." As far as soils are concerned, the reference material Soil-7 from the International Atomic Energy Agencylo8 met a longfelt want, but more materials are necessary in order to match different categories of soils.
VI. FUTURE DEVELOPMENTS As already pointed out, the applications of activation analysis in agriculture and botany have been less extensive than in many other areas, and they seem to have declined in recent years. One reason for that may be the fact that other trace element analytical techniques, such as AAS, ICP-ES, and recently ICP-MS have undergone extensive development whereas NAA is basically the same as 15 years ago. Another and perhaps more important reason is
574
Activation Analysis
that performing activation analysis requires special nuclear competence that is normally not available in agricultural or botanical research laboratories. A great number of workers may not even know that the technique exists. This often means that activation analysis is not considered for a particular problem even if it would have given the best answer. The declining number of activation analysis laboratories in many countries works in the same direction. Activation analysis has several inherent properties which should still make it a valuable tool - and in many cases the only possible means - for trace element investigations in botany and agriculture. INAA allows a great number of elements to be studied simultaneously in most matrices concerned with a reasonably good accuracy, and among those elements there are several that are still not attainable by other routine multielement techniques at the existing concentration levels. It is still necessary in most cases to employ radiochemical separations to attain the theoretical sensivity of activation analysis, but after solid state detectors became available, the separation may often be done much simpler than before when a high radionuclidic purity of the final sample was required. Thus the present author definitely sees a future of activation analysis in botany and agriculture -given the following conditions: Workers in activation analysis should provide relevant and balanced information about this technique to colleagues in agriculture and botany. Dealing with multielement problems, one should not try to cover all needs by activation analysis only, but employ the combination of analytical techniques giving the best total answer. Ultra-trace element analysis is in most cases very difficult whatever technique is used if truly correct data are to be obtained. Thus it may often pay off to invest the extra work necessary for a radiochemical separation procedure rather than selecting a simpler technique, nuclear or non-nuclear, that does not provide a satisfactory answer.
REFERENCES 1.
Smales, A. A. and Pate, B. D., The determination of sub-microgram quantitiesof arsenic by radioactivation.
2.
Part 111. The determination of arsenic in biological material, Analyst, 77, 188, 1952. Mahlman, H. A. and Leddicotte, G . W., Determination of microgram and submicrogram quantities of
uranium by neutron activation analysis, Anal. Chem., 27, 823, 1955. 3. Bowen, H. J. M., Activation analysis in botany and agriculture, in Nuclear Activation Techniques in the Life Sciences, International Atomic Energy Agency, Vienna, 1967, 287. 4. Salmon, L. and Cawse, P. A., Instrumental neutron activation analysis, in Soil Analysis, Smith, K . A , , Ed., Marcel Dekker, New York, 1983, 299. 5. L'Annunziata, M. F. and Legg, J. O., Eds., Isotopes and Radiation in Agricultural Sciences, Vol. 1.. Academic Press, London, 1984, 13. 6. Vow, P. B., Introduction to Nuclear Techniques in Agronomy and Plant Biology, Pergamon Press, Oxford, 1980, 177. 7. Ohno, S. and Yatazawa, M., Simultaneous determination of arsenic and antimony in soil by neutron activation analysis, Radioisotopes (Tokyo), 19, 565, 1970. 8. Lag, J. and Steinnes, E., Regional distribution of selenium and arsenic in Norwegian forest soils, Geoderma, 20, 3, 1978. 9. Lag, J. and Steinnes, E., Soil selenium in relation to precipitation, Ambio, 3, 237, 1974. 10. h g , J. and Steinnes, E., Regional distribution of mercury in humus layers of Norwegian forest soils, Acra Agric. Scand., 28, 393, 1978. 11. Lag, J. and Steinnes, E., Regional distribution of halogens in Norwegian forest soils, Geoderma, 16, 317, 1976. 12. Yamada, Y., The determination of micronutrient elements in soil by radioactivation analysis, Radioisotopes (Tokyo), 13, 32, 1964.
Volume 11
575
13. Buenafama, H. D., Neutron activation analysis of soils, J . Radioanal. Chem., 18, 11, 1973. 14. Koons, R. D. and Helmke, P. A., Neutron activation analysis of standard soils, Soils Sci. Soc. Am. J . , 42, 237, 1978. 15. Thoresen, P., Activation analysis of rocks and soils in Noway, Acta Chem. Scand., 18, 1054, 1964. 16. Khera, A. K. and Steinnes, E., Rapid determination of aluminium, manganese and sodium in soils by neutron activation analysis, Agrochimica, 8, 524, 1969. 17. Kline, J. R. and Brar, S. S., Instrumental analysis of neutron irradiated soils, Soil Sci. Soc. Am. Proc., 33, 234, 1969. 18. Brunelle, R. L., Hoffman, C. M., Snow, K. B., and Pro, M. J., Neutron activation and atomic absorption analyses of chemical elements in soil, J. AOAC. 52, 91 1, 1969. 19. Salmon, L. and Creevy, M. G., An on-line computer system for instrumental activation analysis of air, water and soil, in Nuclear Techniques in Environmental Pollution, International Atomic Energy Agency, Vienna, 1971. 20. Murrman, R. P., Winters, R. W., and Martin, T. G., Determination of trace elements in soils and clay minerals by resonance neutron activation analysis, Soil Sci. Soc. Am. Proc., 35, 647, 1971. 21. Naidenov, M. and Travesi, A., Nondestructive neutron activation analysis of Bulgarian soils, Soil Sci.. 124, 152, 1977. 22. Van der Klugt, N., Poelstra, P., and Zwemmer, E., Multi-element analysis of soils by computerized instrumental neutron activation analysis, J . Radioanal. Chem., 35, 109, 1977. 23. Brunfelt, A. 0. and Steinnes, E., Instrumental activation analysis of silicate rocks with epithermal neutrons, Anal. Chim. Acta, 48, 13, 1969. 24. Alian, A. and Sansoni, B., Instrumental activation analysis of geological and pedological samples. Further investigation of epithemal neutron activation analysis using monostandard method, J . Radioanal. Chem., 59, 511, 1980. 25. Steimes, E., Determination of cadmium in soils by neutron activation analysis, Talanta, 24, 121, 1977. 26. Chattopadhyay, A. and Jervis, R. E., Multielement determination in market-garden soils by instrumental photon activation analysis, Anal. Chem., 46, 1630, 1974. 27. Fusban, H. U., Segebade, C., and Schmitt, B. F., Instrumental multielement activation analysis of soil samples, J . Radioanal. Chem., 67, 101, 1981. 28. Zmijewska, W. and Minczewski, J., Determination of some macrocomponents of soil solution by neutron activation analysis, in Plant Nutrient Supply and Movement, International Atomic Energy Agency, Vienna, 1965, 110. 29. Cho, C. M. and Axmann, H., Determination of micro-quantities of several elements in soil solution by isotope dilution and activation analysis, in Plant Nutrient Supply and Movement, International Atomic Energy Agency, Vienna, 1965, 125. 30. Khera, A. K. and Steinnes, E., Determination of aluminium, manganese and sodium in soil solutions by neutron activation analysis, Geoderma, 5, 251, 1971. 31. Bowen, H. J. M. and Dymond, J. A., Strontium and barium in plants and soils, Proc. R. Soc., B 144, 355, 1955. 32. McKown, D., Kay, M., Gray, D., Abu-Samra, A., Eichor, M., and Vogt, J., Multi-element surveys of bioenvironmental samples using neutron activation analysis, in Nuclear Methods in Environmental Research, Vogt, J . R . , Parkinson, T. F., and Carter, R. L., Eds., University of Missouri, Columbia, 1971, 150. 33. Nadkarni, R. A., Elemental availability to plants from soil solutions studied by neutron activation analysis, Radiochem. Radioanal. Lett.,26, 139, 1976. 34. Randle, K. and Hartmann, E. H., Extraction and neutron activation analysis of humic substances, J . Radioanal. Nucl. Chem. Articles. 90, 309, 1985. 35. Kline, J. R. and Rust, R. H., Fractimation of copper in neutron activated soils, Soil Sci.Soc.Am. Proc.. 30, 188, 1966. 36. O'Toole, J. J., Clark, R. G., Malaby, K. L., and Trauger, D. L., Environmental trace element survey at a heavy metal refining site, in Nuclear Methods in Environmental Research, Vogt, J . R., Parkinson, T. F., and Carter, R. L., Eds., University of Missouri, Columbia, 1971, 172. 37. Crecelius, E. A., Johnson, C. J., and Hofer, G. C., Contamination of soils near a copper smelter by arsenic, antimony and lead, Water, Air, Soil Pollut., 3, 337, 1974. 38. Oakes, T. W., Furr, A. K., Adair, D. J., and Parkinson, T. F., Neutron activation analysis of automobile exhaust pollutants, J. Radioanal. Chem., 37, 881, 1977. 39. Allen, R. 0 . and Steinnes, E., Contribution from long-range atmospheric transport to the heavy metal pollution of surface soil, in Ecological Impact of Acid Precipitation. DrablL, D . and Tollan, A , , Eds., SNSF Project, 0slo-As, 1980, 102. 40. Hvatum, 0 . 0.,B~lviken,B., and Steinnes, E., Heavy metals in Norwegian ombrotrophic bogs, Ecol. Bull. (Stockholm), 35, 351, 1983.
576
Activation Analysis
41. Njhtad, 0. Nzumann, R., and Steiines, E., Variations in atmospheric trace element deposition studies by INAA of peat cores from ombrotrophic bogs, J . Radioanal. Nucl. Chem. Articles, 114, 69, 1987. 42. Weaver, J. N., Hanson, A., McGaughey, J., and Steinkruger, J., Determination of heavy metals in municipal sewage plant sludges by neutron activation analysis, Water. Air, Soil Pollut., 3, 327, 1974. 43. Dams, R., Buysse, A. M., and Helsen, M., Instrumental neutron activation analysis of sewage sludge and compost, J. Radioanal. Chem., 68, 219, 1982. 44. Bowen, H. J. M., The determination of gallium and molybdenum in biological material by activation analysis, Inr. J . Appl. Radiat. Isot., 5, 227, 1959. 45. Bowen, H. J. M., The determination of chlorine, bromine and iodine in biological material by activation analysis, Biochem. J . , 73, 389, 1959. 46. Bowen, H. J. M., The determination of tungsten in biological material by activation analysis, Biochem. J . , 77, 79, 1960. 47. Bowen, H. J. M., The determination of chromium in biological material by radioactivation, Analyst, 89, 658, 1964. 48. Bowen, H. J. M., The determination of antimony, cadmium, cerium, iridium and silver in biological material by radioactivation, Analyst, 92, 118, 1967. 49. Decat, D., Van Zanten, B., and Leliaert, G., Determination of trace quantities of uranium by neutron activation analysis, Anal. Chem., 35, 845, 1963. 50. van Zanten, B., Deeat, D., and Leliaert, G., Activation analysis of molybdenum in plant material, Talanta, 9, 213, 1962. 51. Beardsley, D. A., Briscoe, G. B., Ruzicka, J., and WiUiams, M., Substoichiometric determination of traces of gold by neutron-activation analysis, Talanta, 12, 829, 1965. 52. Kim, C. K. and Sivennan, J., Determination of mercury in wheat and tobacco leaf by neutron activation analysis using mercury-197 and a single exchange separation, Anal. Chem., 37, 1616, 1965. 53. Kusaka, Y. and Tsuji, H., Systematic radioactivation analysis of trace elements in rice plants. Determination of halogen elements, Radioisotopes (Tokyo), 17, 108, 1968. 54. Ohno, S., Determination of iodine and bromine in biological material by neutron-activation analysis, Analyst. 96, 423,' 1971. 55. Johansen, 0. and Steinnes, E., A neutron activation method for the determination of iodine in plant material, Analyst, 101, 455, 1976. 56. Laul, J. C., Lepel, E. A., Weimer, W. C., and Wogman, N. A., Precise trace rare earth analysis by radiochemical neutron activation, J. Radioanal. Chem., 69, 181, 1982. 57. Tjioe, P. S., Vokers, K. J., Kroon, J. J., and De Goeij, J. J. M., Distribution patterns of rare-earth elements in biological materials evaluated by radiochemical neutron activation analysis, J. Radioana1. Chem., 80, 129, 1983. 58. Fourcy, A. and Neuburger, M., Contribution de I'analyse par activation a 1'6tude fine de la composition minerale des matiers vtgttales, Bull. Soc. Chim. France, No 11, 4682, 1968. 59. Travesi, A. and Lee, Y. Y., Identification and determination of trace elements in rice seeds by neutron activation analysis, in Nuclear Activation Techniques in the Life Sciences, International Atomic Energy Agency, Vienna, 1967, 301. 60. Young, H. E. and Guinn, V. P., Chemical elements in complete mature trees of seven species in Maine, Tappi J., 49, 190, 1966. 61. Steinnes, E., Instrumental activation analysis of vegetable tissue, Talanta, 14, 753, 1967. 62. Johansen, 0. and Steinnes, E., Routine determination of traces of cobalt in soil and plant tissue by instrumental neutron activation analysis, Acta Agric. Scand., 22, 103, 1972. 63. Haller, W. A., FUby, R., Rancitelli, L. A., and Cooper, J. A., The instrumental determination of fifteen elements in plant tissue by neutron activation analysis, in Modern Trends in Activation Analysis, De Voe, J . R., Ed., U.S. NBS Spec. Publ. 312, Vol. I, U.S.National Bureau of Standards, Washington, D.C., 1968, 177. 64. Nadkarni, R. A. and Ehmann, W. D., Determination of trace elements in biological standard kale by neutron activation analysis, J. Radioanal. Chem., 3, 175, 1969. 65. Horovitz, C. T., Schock, H. H., and Horovitz-Kisiiova, L. A., The content of scandium, thorium, silver, and other trace elements in different plant species, Plant Soil, 40, 397, 1974. 66. Kanias, G. D. and Philianos, S. M., Neutron activation analysis study of distribution of certain elements between plant and soil, J . Radioanal. Chem., 52, 389, 1979. 67. Teherani, D. K., Trace element analysis in rice, J . Radioanal. Nucl. Chem. Lett., 117, 133, 1987. 68. Koyama, M., Shirakawa, M., Takade, J., Katayama, Y., and Matsubara, T., Trace elements in land plants: concentration ranges and accumulators of rare earths, Ba, Ra, Mn, Re, Co and heavy halogens, J . Radioanal. Nucl. Chem. Articles, 112, 489, 1987. 69. Gladney, E. S., Wangen, L. E., and Aguilar, R. D., Comparison of three techniques for rapid determination of strontium in soils and vegetation, Anal. Lett., 10, 1083, 1977.
Volume 11
577
70. Wyttenbach, A., Bajo, S., and Tobler, L., Aerosols deposited on spruce needles, J. Radioanal. Nucl. Chem. Articles, 114, 137, 1987. 71. Jones, J. D., Kaufmann, P. B., and Rigot, W. L., Method for determination of silicon in plant materials by neutron activation analysis, J. Radioanal. Chem., 50, 261, 1979. 72. Kosta, L., Ravnik, V., and Dumanovic, J., Determination of nitrogen in plant seeds by fast neutron activation analysis, in New Approaches to Breeding for Improved Plant Protein, International Atomic Energy Agency, Vienna, 1969, 161. 73. Fourcy, A., Fer, A., Garrec, J. P., and Neuberger, M., Mise en evidence de la retention des elements polluants par les vegetaux au moyen de I'analyse par activation neutronique, in Nuclear Techniques in Environmental Pollution, International Atomic Energy Agency, Viema, 1971, 507. 74. Lutz, G. J., Determination of lead in environmental samples by photon activation analysis, in Nuclear Methods in Environmental Research, Vogt, J . R., Parkinson, T. F., and Carter, R. L., Ed., University of Missouri, Columbia, 1971, 144. 75. Williams, D. R. and Hislop, J. S., The non destructive determination of iodine in soils and biological materials by high energy gamma-photon activation, J. Radioanal. Chem., 39, 359, 1977. 76. Lee, M. M., Chandri, A., Rouse, J. L., and Spicer, B. M., Environmental and ecological studies using proton activation analysis, J. Radioanal. Chem., 37, 889, 1977. 77. Carpenter, B. S., The use of the nuclear track technique for boron and uranium analyses in botanical material, Trans. Am. Nucl. Soc., 14, 130, 1971. 78. Yuita, K., Application of radioisotope on the dynamics of halogen elements in the soil-plant system, Radioisotopes (Tokyo), 26, 647, 1977. 79. McIntyre, D. R., Silver, W. J., and Griggs, K. S., Trace element uptake by field-grown food plants fertilized with wastewater sewage sludge, Compost Sci., 18, 22, 1977. 80. Hofner, W., Schaumloffel, E., and Volker, K., Mikronhtoffgehalte von Bliiten und Sanenteilen einiger Gramineen, Planta, 57, 608, 1961. 81. Takeo, T. and Shibuga, M., Determination of trace elements in tea plant by neutron activation analysis, Radioisotopes (Tokyo), 20, 25, 1971. 82. Fawcett, P., Green, D., and Shaw, G., The determination of trace elements in pollen and sporopollenin using neutron activation analysis, Radiochem. Radioanal. Len., 8, 37, 1971. 83. Cerasov, V., Investigation of the atmospheric particulates deposited on leaves using instrumental neutron activation analysis, Atmos. Environ., 19, 68 1, 1985. 84. Caplan, J., Uhersli, E., Naeumann, R., and Steinnes, E., A neutron activation study of trace element contents in plants growing on soils of different acidity, J. Radioanal. Nucl. Chem. Articles, 114, 13, 1987. 85. Krivan, V. and Schaldach, G., Role of nutrients and other element in the occurrence of disease of the forest trees, presented at 1st Status Colloquium of the European Research Center Project for Air Pollution Abatement Measures, Karlsmhe, West Germany, March 5, 1985. 86. Castro, C. E. and Schmitt, R. A., Direct elemental analysis of citrus crops by instrumental neutron activation. A rapid method for total bromide, chloride, manganese, sodium, and potassium residues, J. Agric. Food Chem., 10, 236, 1962. 87. Gunther, F. A. and Spencer, R. E., Apparent organobromine compounds in higher plants by neutronactivation analysis, Bull. Environ. Contam. Toxicol., 1, 121, 1966. 88. Sues, A. and Stiirk, H., The application of activation analysis for the control of bromide accumulation in vegetable, J. Radioanal. Chem., 37, 905, 1977. 89. Stegnar, P., Kosta, L., Byrne, A. R., and Ravnik, V., The accumulation of mercury by, and the occurrence of methyl mercury in some fungi, Chemosphere. 2, 57, 1973. 90. Byme, A. R., Ravnik, V., and Kosta, L., Trace element concentrations in higher fungi, Sci. Total Environ., 6, 65, 1976. 91. Allen, R. 0. and Steinnes, E., Concentrations of some potentially toxic metals and other trace elements in wild mushrooms from Norway, Chemosphere, 4, 371, 1978. 92. Liu, Y. G . , Trione, E. J., Laul, J. C., and Schmitt, R. A., Instrumental neutron activation analysis of wheat bunt spores, J. Radioanal. Chem., 69, 427, 1982. 93. Steinnes, E., Atmospheric deposition of heavy metals in Norway studied by the analysis of moss samples using neutron activation analysis and atomic absorption spectrometry, J . Radioanal. Chem., 58, 387, 1980. 94. Olmez, I., Gulovali, M. C., and Gordon, G . E,. Trace element concentrations in lichens near a coalfired power plant, Atmos. Environ., 19, 1663, 1985. 95. Puckett, K. J. and Finegan, E. J., An analysis of the element content of lichens from the Northwest Territories, Canada, Can. J. Bot., 58, 2073, 1980. 96. Pakarinen, P., Regional concentration levels of vanadium, aluminium and bromine in mosses and lichens, Chemosphere, 12, 1477, 1983. 97. de Bruin, M., Epiphytic lichens as indicators for heavy metal air pollution: What do they reflect?, in Proc. Int. Conf. Heavy Metals in the Environment, Vol. 1, Lekkas, T. D., Ed., CEP Consultants, Athens, 1985, 359.
578
Activation Analysis
98. Bodart, F. and Decominck, G., Elemental analysis of fertilizers by fast neutron activation, J. Radioanal. Chem., 38,241, 1977. 99. Srapenyants, R. A. and Saveliev, I. B., Multielement neutron-activation analysis of plants and fertilizers, J . Radioanal. Chem., 38, 247, 1977. 100. Schnier, C. and Schnug, E., Advantages and possibilities of the instrumental neutron activation analysis (INAA) method for investigations of trace and minor elements in soils, plants, and fertilizers, presented at XIII Congr. Int. Soc. Soil Science, Hamburg, August 13 to 20, 1986, 471. 101. Fourcy, A., Neuburger, M., G a m , C., Fer, A., and Gamec, J. P., Activation analysis in plant biology. Radioecological applications using simple or automated radiochemical separation techniques, in Modern Trends in Activation Analysis, De Voe, J. R., Ed., U.S.NBS Spec. Publ. 3 12, Vol. I, National Bureau of Standards, Washington, D.C., 1%9, 160. 102. Price, K. R., Cadwell, L. L., Schreekhise, R. G., and Brauer, F. P., Iodine-129 in forage and deer on the Hanford site and other Pacific Northwest locations, Report PNL-3357, Batelle Pacific Northwest Labs., Richland, WA, February 1981. 103. Muramatsu, Y., Uchida, S., Sumiya, M., and Ohmomo, Y., Iodine separation procedure for the determination of l r l and '"1 in soil by neutron activation analysis, J. Radiounul. Nucl. Chem., Lett., 94, 329, 1985. 104. Bowen, H. J. M., Comparative elemental analyses of a standard plant material, Analyst, 92, 124, 1967. 105. Bowen, H. J. M., Problems in the elementary analysis of standard biological materials, J. Radioanal. Chem., 19, 215, 1974. 106. Pam, R. M., Muramatsu, Y., and Clements, S. A., Survey and evaluationof available biological reference materials for trace element analysis, Fresenius Z. Anal. Chem., 326, 601, 1987. 107. Guzzi, G., Pietra, R., and Sabboni, E., Determination of 25 elements in biological standard reference materials by neutron activation analysis, J. Radioanal. Chem., 34, 35, 1976. 108. Pszonicki, L., Hanna, A. N., and Suscbny, O., Report on intercomparison IAEAISoil-7 of the determination of trace elements in soil, Report IAEA-RL-112, International Atomic Energy Agency, Vienna, May 1984.
Volume 11
579
Chapter 15
ACTIVATION ANALYSIS OF SEMICONDUCTOR MATERIALS Zeev B. Alfassi and M. H. Yang
TABLE OF CONTENTS I.
Introduction.. ...................................................................580
11.
Silicon ..........................................................................580 A. Thermal Neutron Activation.. .......................................... .580 Activation Analysis with Other Bombarding Particles B. Delayed Radiation.. .....................................................583 Activation Analysis with Other Bombarding Particles C. Prompt Radiation. .......................................................586
111.
Gallium Arsenide ...............................................................588
IV.
Germanium .....................................................................59 1
v.
Other Semiconductors.. .........................................................593
References. .............................................................................594
580
Activation Analysis
I. INTRODUCTION An important determinant of the behavior of semiconductor devices is the concentration of impurity elements either added deliberately (doping of boron, phosphorus, arsenic, etc.) or present due to the incomplete purification of the semiconductor base material or contamination during the device manufacturing. Small quantities of metal can degrade the lifetime of charge carriers in the active device regions of silicon integrated circuit. Some impurities show electrical activities at concentration below 1 ppb The detection and the quantitative measurement of elemental concentration of semiconductor materials and devices are very essential to the development of these devices and to the quality control of their production. Usually the semiconductor devices are very small, very thin films, so it is not only a problem of the low concentration, but it is a problem of the measurement of very small samples. The electrical properties of a semiconductor device are influenced not only by the concentration of the impurities in the bulk material but also by the spatial distribution of each impurity which calls also for determination of very small samples. This chapter deals only with the determination of impurities in the bulk material, i.e., the average contamination, disregarding the distribution of these contaminants. The variation of the concentration of the trace elements as a function of the distance from the surface, depth profiling, is treated in the next chapter. The depth profiling studies are done only for dopant elements, i.e., elements which are in relatively high concentrations, above ppm, and only for silicon.
11. SILICON Silicon is the most important material for semiconductors and its uses are more than all the other semiconductor materials together. Consequently more papers were published on activation analysis of impurities in silicon. We divide the studies of silicon contamination into two parts: use of thermal neutron activation and other activation methods.
A. THERMAL NEUTRONS ACTIVATION Silicon has three naturally stable isotopes 28Si(92.21%), 29Si(4.70%), and 30Si(3.09%). Thus only 30Si is producing a radionuclide by the usual (n,y) reaction of thermal neutrons. 31Siproduced by 30Si(n,y) 3'Si reaction has a 2.62-h half-life and very little y rays, intensity of only 0.07% (1.26 MeV). Considering the low abundance, the relatively low cross-section (0.28 b) and mainly the low intensity of the y ray, 31Sido not present a large problem in instrumental analysis by y ray spectrometry. However, due to the presence of fast and epithermal neutrons in the reactor the main activity induced in silicon is due to 28A1,29Al, and Z7Mgformed by the reactions 28Si(n,p) 28A1,29Si(n,P) 29Al and 30Si (n,a) 27Mg. AS the half-lives of these radionuclides are short (2.3 m, 6.6 m, and 9.5 m, respectively) instrumental activation analysis are possible for radionuclides with half lives longer than 1 to 2 h. In any case, the activity induced in nuclides with shorter half-lives are not sufficient to measure the required purity for electronic grade semiconductors, due to the small amount of radioactive atoms which can be formed until reaching saturation. In most NAA studies, people waited also for the decay of 31Si. Before the development of high resolution y spectrometers, Ge(Li) and HPGe detectors, the use of NaI(T1) detectors for y spectrometry necessitate the use of radiochemical separ a t i ~ n .In ~ -the ~ last 15 to 20 years, most works are done with the high resolution of Ge(Li) or HPGe and the analyses are purely nondestructive5-" except removal of the surface after the irradiation in order to get rid of the contamination of the surface during the handling and the irradiation. Due to the very low level of contaminants in silicon, special care should be taken in handling the silicon and in packaging it for irradiation. Usually very pure water
Volume 11
581
(sub-boiling water) are used and the quartz vessels are washed with vapors of fuming nitric acid."-l6 As there is no background from the Si matrix after about a day or two and since the concentrations of the trace elements are low, the ways to increase the sensitivity (decrease the lower limit of detection) are to irradiate larger samples with larger total number of neutrons (higher flux, longer irradiation times, or both). In the HFR reactor at Petten, Netherlands, a special irradiation facility was constructed for irradiation of silicon samples of Philips, in which silicon wafers of up to 15 cm diameter can be irradiated with 4 x 10¹³ thermal n s-I and the irradiation is done for 72 to 96 h.ILThey also used large Ge(Li) detectors (100 to 150 cc) and counted for 8 to 16 h. Thus they got the lowest detection limits. Table 1 summarizes some of the limits of detection given in the literature for Si matrix. For some elements, e.g., C1 and Mn, shorter irradiation were used, between 0.5 to 2.0 h. Special correction has to be done in the case of determination of Na due to the reaction 28Si(n,pa) 24Naas was shown by Niese18 by irradiating very pure Si in a reactor core with and without cadmium cover to absorb the thermal neutrons. The contribution of the "Si (n,pa) 24Nareaction to 24Nain a silicon matrix depends on the spectrum of the neutrons in the reactor core as very high energy is required for this reaction and the Q value exceeds that of 14-MeV neutron generator." Niese foundt8 that the contribution of the 28Si (n,pa) 24Nais equal to 0.7 ppb. For the HFR reactor at Petten, Netherlands, the contribution is 0.5512or 0.6ppb.lLRevel et al.9 found this contribution of 28Si(n,ap) 24Nato be less of 0.4 ppb. Haas et a1.19 warned against the common use of wrapping the sample for irradiation in A1 foil as they showed that there are recoil of 24Nafrom the A1 wrapping to the sample, due to the high recoil energy from the 27Al(n,a) 24Nareaction. In many other uses it is not important, but due to the very low concentration of Na in pure Si, this contribution might be a considerable one. INAA of silicon matrix were done for several purposes. A few of them are
-
1.
2. 3. 4.
5. 6.
-
Impurity and dope concentrations in silicon rods and wafers Contaminations from handling by mechanical equipment Contaminations introduced during epitaxial growth Contaminations from the furnace during high and medium temperature treatments Gettering of metals Spatial distribution
It was found for exampleI5that the surface is contaminated with gold, copper, and sodium in the range 4 to 500 ppm of a monolayer. Copper and sodium are added to the surface from oxidation furnaces. Several important elements cannot be determined in this method, including mainly the light elements H, Li, Be, B, C, N, 0, and F as they do not form radioisotopes or they are too short lived. Phosphorus cannot be determined in that way due to the lack of y emission from the only produced 32P, however 32PP rays can be determined destructively by the extraction of the phosphomolybdic complex in the presence of hold-back carriers of Ta and Au.~OThe chemical yield of the extraction was found to be 83.8 ? 4% and the decontamination factors were 79 to 6500 for the different elements studied. The limit of detection was found to be 3 10-"g. TheyZodid their study for phosphorus-doped silicon and Alfassi and Yang2I showed that for this case, there is no need for chemical separation and 10 to 20 d of cooling are sufficient to ensure that the only P emitter is 32P(eith accuracy of 1 to 2%, which is much better than the reproducibility of the extraction yield). The limit of detection should be about the same, as both methods use liquid scintillation counting for the measurement of the p activity, although Alfassi and Yang used a discriminator which reduce the detection limit by a factor of two.
.
582
Activation Analysis
TABLE 1 Limit of Detection of Trace Element in Si by Instrumental Neutron Activation Analysis (ppbw) Element Na Mg
Ref. 12 0.5
Al
C1 K Ca Sc Ti
0.15 10 0.00003 3
v
cr Mn Fe Co Ni
cu Zn Ga Ge As
Se Br Rb Sr Y
Zr Nb Mo Ru Pd Ag
Cd In Sn Sb Te I Cs Ba La Ce F'I Nd
Sm Eu Gd Tb
DY Ho Er
Tm Yb Lu Hf Ta W
0.002 15 0.3 0.0005 0.15 <0.56 0.015 0.0015 1 c0.033 0.002 <0.0024 0.01 0.15 200 0.15 1.5 0.006 0.0015 0.06 0.003 0.015 0.004 0.2
Ref. 17 0.1 3000 500 5 100 2000 0.003 1000 10 1 0.1 50 0.1 2000 0.5 1.o
0.02 0.02
500
0.01
0.01
0.05 10 0.01
0.01 0.05
20 0.05 0.02
Ref. 9 and Ref. 20 0.3
Ref. 7 0.1
1 > I
Volume I1
583
TABLE 1 (Continued) Limit of Detection of Trace Element in Si by Instrumental
Neutron Activation Analysis (ppbw) Element
Note:
Ref. 12
Ref. 17
Ref. 9 and Ref. 20
Ref. 7
Reference 12 irradiated wafers of 15 cm diameter and 0.5 mm thickness (20.6 g) with flux of 4 x 10¹³n . ern-'. s-I for 72 to 96 h and counted for 8 to 6 h; Reference 17 irradiated samples of 100 mg for up to 6 h at 5 x 10" n . cm-Z s-l; References 9 and 20 used I-g Si and irradiated for 72 h at 2.3 x lOI4 n cm-2 s-'; Reference 7 irradiated 5 to 10-g samples for 11 d at 2 X 10¹³n . ~ m - s-I. ~ .
-
'OBoron has a high neutron capture cross-section l0B (n,a) 7Li, however, 7Li is not radioactive and consequently B cannot be determined by delayed y spectrometry. Yet B can be determined either by the prompt a emission or also by prompt y emission since 94% of the 7Li are formed in the 497-deV excited state and this excitation energy is emitted promptly as y ray of 477.8 keV within 10-13s. Thurber and CarpenterZ2 determined B in Si by measuring the prompt a with the nuclear track technique. They sandwiched a square specimen (7.5 x 7.5 mm2) of thickness of 0.3 rnrn between two pieces of cellulose acetate butyrate '. plastic and irradiated for 1 s to 10 min with a thermal flux of 1.3 X lOI3n ~ m - ~ s - After irradiation, the plastic detectors were chemically etched with NaOH and the a tracks were counted. They found that boron in the range of 0.02 p p m 4 . 2 % could be determined. Another method to measure the a particle is to mount the sample in a vaccum chamber together with a surface barrier detector for counting the a particles as is done in the neutron depth profiling technique (see Chapter 16 in this ~ o l u m e ) .Riley ~ ~ . ~and ~ LindstromZ5used the prompt gamma to measure the boron concentration in borosilicate glasses. They also measured boron in silicon in the concentration range of 6 ppm--0.2%. l7
.
B. ACTIVATION ANALYSIS WITH OTHER BOMBARDING PARTICLES DELAYED RADIATION A1 cannot be determined by thermal neutrons due to the higher contribution to 28A1from the "Si (n,p) 28A1than from the 27Al (n,y) reaction. Revel et al.9 measured A1 by means of fast neutrons produced from 10-MeV deuterons and counting the 24Naproduced from 27Al( n p ) 24Nareaction. They obtain in this method a detection limit of 20 ppb compared to 2 ppm obtained with the highly thermalized neutron flux of heavy water box in the reactor. Carbon, oxygen, and nitrogen in silicon were determined in several laboratories by charged-particle activation analysis (CPAA). All the charged particles reaction with C, N, and 0 will lead to only p -emitter radioisotopes. Since any charged particle bombardment of silicon gives a high activity of O ' P which is also a positron emitter, it is preferable to use longer-lived P+ emitter, due to the short half-life of 30P (2.5 min). Besides, the use of longer-lived radioisotopes leads to better sensitivity. The first reason is the cause of Nozaki ~ ~prefer - ~ ~ to measure carbon by the I2C (He,a) llC reaction rather than and c o - ~ o r k e rto +
584
Activation Analysis
with the 12C (d,n) 13N reaction inspite of the higher cross-section of the second reaction. The longer half-life of "C (20.4 rnin) makes possible the separation of "C while there are difficulties in separating nitrogen (13N, tl12 = 10.0 min) within a short time. The same determined product and the same interferences are for 3He and a irradiations although the degree of interference is different. The energy required for the a reactions is always higher than that of the 3He reactions by about 20.6 MeV. A(,He,x) B reaction A(a,xn) B reaction
+
Q = MA M,, - M, - MB Q=MA+Ma-M,Mn - MB
and the difference in the Q values is given by M,, + Mn - Ma = 20.6 MeV. Thus the use of ,He reaction for CPAA has the advantage over a activation that even lower energy accelerators can be used and also that less amount of heat is liberated in the sample, enabling the use of higher fluxes. Nozaki and c o - w o r k e r ~used ~ ~ ,He with 10 MeV to measure carbon by the I2C (3He,a) llC reaction, protons of 12 MeV to measure N by the 14N (p,al'C) reaction, and 3He with 15 MeV to measure oxygen through the 160(,He,p) 18F.The incident particles energies were selected considering the excitation functions of the adopted reactions, the ranges of the charged particles and the excitation functions of the interfering reactions, e.g., ,He bombardment of Si itself gives "C for energies above 22 MeV and 18F for energies above 24 MeV. "C and 18F are separated from the Si matrix by chemical treatment and the P+ activity are measured either with a NaI(T1) well-type detector or for low concentrations with a pair of bismuth germanate scintillation detectors. "C was separated by dissolving the Si in NaOH solution containing carbonate carrier following by KMnO, oxidation under microwave oven heating and collecting the "CO, gas in a MeOHH20 (1:l by volume) solution containing LiOH. 18Fis precipitated as KBF, from aqueous solution. The detection limits found were 20, 10, and 5 ppb for carbon, nitrogen, and oxygen, respectively. In previous publication^,^'.^^ the same group used the same conditions for nitrogen and oxygen, however, for carbon they use also 15 MeV ,He same as for determination of oxygen so one irradiation can be used for both C and 0 determination. The lowering of the energy was done to reduce the interference from the 1 6 0 (3He,2a) llC reaction. Boron interferes with the determination of both carbon and nitrogen due to the reactions O ' B (,He,n) "C (exothermic) and "B (p,n) "C (Q = 3.1 MeV), and beryllium interfere with the determination of carbon due to the exothermic reaction 9Be (3He,n) "C. However, due to the usually low concentration of Be and B compared to the concentration of C, these interferences can be neglected. In case of high boron concentration, carbon must be deterdeuterium reaction cannot mined by the deuteron irradiation 12C (d,n) 13N, since boron lead to formation of nitrogen. 13N is extracted as I3NH3and the P+ activity is measured. The determination of oxygen by 1 6 0 (3He,p) 18Fsuffers from interferences from fluorine and from sodium, 19F (,He,a) 18F and 23Na(,He,2a) 18F. The concentration of F is much smaller than that of oxygen and can be neglected and the contribution from Na can be substracted as sodium concentration is known from NAA, and its sensitivity in 3He reaction is lower than that of 160. The interference from fluorine is much higher in the case of a bombardment. In previous ~ o r k s , *the ~ -carbon ~ ~ and oxygen were determined without chemical separation by measuring the P+ activity as a function of time and analyzing the decay curve with half-lives of 2.5 min(30P),20.5 min(llC), and 110 min(I8F). This method suffers from longer measurement times and interference from any P+ emitter that is formed from any of the impurities. Cross et al.29used 13.9 MeV as the common energy of ,He for the deter-
+
Volume 11
585
mination of C and 0 . Similarly Nozaki et aL30 measured oxygen by the 160(3He,p) 18Fin silicon nitride films without chemical separation. They give the long half-life, 110 min, which enable measurement without separation, as the reason to use this reaction rather than the '60 ( p p ) I3N reaction. They found that 3 h after end of bombardment, the half-life of the decay curve agreed with the half-life of I8F. Schweikert and Rook31 studied the concentration of oxygen in silicon by CPAA, using three different nuclear reactions all leading to 18F from either 1 6 0 or ''0 by using the "0 (p,n) "F, 1 6 0 (a,pn) I8F and the 1 6 0 (3He,p) 18F reactions. The detection limits found for these three reactions were 60, 50, and 5 ppb, respectively. Martin and H a a found ~ ~ ~that in the determination of carbon in silicon by the I2C (d,n) I3N reaction, there are yields of excessively high results due to carbon injected into the sample from the accelerator. If the injected carbon is removed by etching of defined surface layers of the activated sample, the amount of I3N gives a true measurement for the C concentration. They were able to measure 0.2 ppm carbon at a variance of individual values of 10% without chemical separation of the I3N. Hoste and Vande~asteele~~ summarized the determination of B, C, N, and 0 in metals and semiconductors by CPAA, however, they deals mainly with metals and the only data relating to semiconductors is determination of oxygen in silicon by the 160(3He,p) 18F reaction, without chemical separation, where six experiments give an average of 42.2 & 6.7 ppb. The best bombarding particles for determination of oxygen in silicon as well as other semiconductors and metals are tritons since the reaction 1 6 0 (t,n) I8F had high cross-section and there is no nuclear interference below 4.0 MeV,34however, very few accelerators can handle tritons irradiations. Valladon and D e b r ~ used n ~ ~3.5-MeV tritons to study the oxygen concentration in thin films of silicon. At this energy, the range of the tritons are 63.7 p.m. 10 pm surface deep were etched and removed after irradiation to overcome the problem of surface contamination during handling and irradiation. The background of 30Pwere left to decay (2.5 min). 3'Si formed also does not disturb with the P+ analysis, at least down to 20 ppb which was the lowest concentration measured. Birattari et a1.35studied the determination of arsenic in a Si matrix by proton activation analysis. They dealt only with As-doped Si and assumed the presence of only these elements (Si and As). They found that the y activity (at about 360 keV where 73Sehas its line) induced in Si as a function of the protons energy has a sharp rise above 30 MeV as can be expected from the Q values of the reactions of protons with Si leading to the medium-lived 24Naand 7Be and so they decided to use 30 MeV as the bombarding energy. It should be pointed out that the activity of the Si matrix will be much lower if the bombarding energy will be even a little lower than 30 MeV, e.g., using 24-MeV protons reduces the activity by more than an order of magnitude. However, the threshold energy for the 75As(p,3n) 73Seis 22.1 MeV and lowering the proton energy will reduce considerably the 73Sesignal. Using the known excitation function for this reaction and their results for the activity induced in Si as a function of time after the end of bombardment, they found that the optimal conditions for instrumental analysis are 30-MeV protons and cooling time of 20 h. The detection limit for 5 mC irradiation was found to be 80 ppb. If lower concentrations have to be measured, they used 35-MeV protons and separate radiochemically the Se and obtained detection limit of 0.4 ppb. As the excitation function for the 75As(p,pn) 74Asreaction is not known, they could not calculate the optimal energy with the highest signal to background ratio and they use the 30 MeV similar to that for 73Se.Due to the longer half-life of 74As(17.7 d) compared to 73Se,the decay of 74Asis smaller and also longer measurement time can be applied, and mainly due to the fact that the background for the 596-keV y line of 74Asis much smaller than that of the 361-keV of 73Se(which lies in the Compton of the 511 annihilation) the
5
Activation Analysis
limit of detection for instrumental measurement of 74As is considerably lower, 10 ppb. Although the excitation function of 75As(p,pn) 74Asis not known, their choice of 30 MeV seems wrong. As the threshold energy for this reaction is 10.3 MeV (and only 8.1 MeV for the (p,d) reaction), it can be expected that the maximum cross-section will be for about 25 MeV and the range 25 to 30 MeV cannot increase the formation of 74Asby more than a factor of two while the noise for this range is increasing by almost an order of magnitude. Thus it can be expected that lower energy will lead to higher detection limit. The flux of the protons were measured with a Faraday cup to an accuracy of better than 1%. Fedoroff et al.36simultaneously determined nitrogen and carbon by photon activation. They irradiated silicon samples with the photons emitted from 15-pA 30-MeV electrons which are slowed down in a tungsten target. The silicon samples are dissolved in molten KOH and all the nitrogen including gases, NH, and N, are converted to N, by copper oxide on porous alumina at 900°C. The same column of copper oxide also oxidize volatile carbon species to CO,. The "CO, is absorbed b y 3 12 M KOH solution and the I3N, by titanium sponge (I2C (7,n) "C and I4N (y,n) 13N) and the "CO, and the 13N2are counted by two NaI detectors coupled to a coincidence unit and to a multichannel analyzer. The detection limits found were 0.01 pg carbon and 0.1 pg nitrogen. For 0.5-g Si sample which they usually used, it means 0.2 ppm N and 0.02 ppm C. Nitrogen can interfere with the determination of carbon by the 14N(y,t) llC reaction and it was found that 1 pg N lead to a "C activity equivalent to 0.02 kg C.
C. ACTIVATION ANALYSIS WITH OTHER BOMBARDING PARTICLES PROMPT RADIATION Hydrogen content of thin film si1icon:hydrogen alloy was determined by Pollock37with five different techniques, one of which was nuclear activation, the 15N(H,a) IZC,measuring the prompt a emission (see the following chapter of this book on depth profiling by this method). The integral content of hydrogen is determined by the integral a count by the surface barrier detector. From the five methods used (the other four were SIMS, IR spectroscopy, nuclear elastic scattering, and RBS), the nuclear activation technique appears to be the most consistent one. The concentration of boron in Si:H films were measured by Chevallier and BeyePs using the "B (p,a) 'Be nuclear reaction, counting the prompt a particles. They used 670-keV protons bombarding the film. This energy ensures the penetration of the total film thickness -0.5 pm by the protons. The a particles were detected at an angle of 145" to the incoming beam. The solid state detector was covered with 6-pm thick Mylar@ absorber to stop backscattered protons in order to decrease the background level. Light element concentration in silicon can be measured by nuclear reaction leading to prompt emission of p, d, or a. However, in many cases, the same particle is emitted from different elements and simultaneous determination can be done only if the used reactions are characterized by high and different Q values in order to give rise to well-resolved peak. A case like this can be found in Figure 1, taken from Reference 39, showing the spectrum of protons formed by the reactions I2C (d,p) I3C, 14N(d,p) 15N,1 6 0 (d,p) I7O, and 28Si(d,p) 29S. Berti and D r i g ~ ,studied ~ the simultaneous determination of nitrogen and oxygen adsorbed on the surface of a silicon speciment. At energies lower than 2 MeV, the only available reactions for the analysis of 1 6 0 and I4N are deuteron-induced and they produced both protons and alpha particles. 160microanalysis is usually performed by means of the 1 6 0 (d,p) 170 reaction at a deuteron energy of about 900 keV. However, when 14N is also present in the sample, the PI peak cannot be used due to the interference from the P6 peak from the 14N (d,p) 15Nreaction. Consequently, the only reactions which can be used in the presence of nitrogen for oxygen determination are 1 6 0 (d,p) I7O and '60 (d,a) 14N. The low energy of the alpha particles produced in the last reaction, 2.5 MeV, prevents the use of an
C hannets FIGURE 1. Proton spectrum from a virgin silicon sample recorded at 0.6-MeV deuteron energy. The oxygen surface contamination amounts to 5 x loL5'60/cm2. Arrows indicate the energies at which the corresponding products are expected to appear whereas the element symbol followed by the order of the product stands for the identification of the peak. (Integrated charge 400 PC.) (From B e d , M. and Drigo, A. V., Nucl. Instrum. Methods, 201, 473, 1982. With permission.)
588
Activation Analysis
TABLE 2
Nuclear Properties of the Nuclides Produced by Reactor Neutrons Irradiation of GaAs
Nuclear reaction
Half-life of the produced radionuclide
Cross section (b) x isotopic abundance
75As(n,y) 16As
26.3 h
7sAs(n,p) 75Ge 75As(n,a) 72Ga
82.8 min 14.1 h
7sAs(n,2n) 74As
17.8 d
@Ga(n,y) 70Ga 71Ga(n,2n) 70Ga 71Ga(n,y) 72Ga
21.1 min
1.01 2.2 x 10⁻⁴
@Ga(n,p) 69mZn @Ga(n,a) 66Cu "Ga (n,2n) 68Ga
13.9 h 5.1 min 68.2 min
3.0 x 4.0 x lo-4 1.2 x lo-4
4.3 2 x lo-3 1.2 x lo-'
3 x lo-4
Main y lies (energy in keV, intensity in %) 559(44.6),657(6.4) 1216(3.7) 265(12) 834(100),2201(27.3) 63O(25.5) 598(59.5),51l(59) 635(15) 175(0.2),1039(0.5)
.
,
439(100) 1039(9) 511(176),1077(3.2)
absorber to stop the backscattered deuterons and hence the best way to evaluate the nearsurface oxygen content is to use the 160(d,p,) I7O although its cross-section is lower than that for the PI as can be seen in Figure 1. As can be seen in Figure 1 which gives the spectra of Si 0 and by arrows the expected places of the nitrogen peak, due to the Si background, the best reaction for I4N measurement is the 14N (d,p5) 15N reaction. Berti and D r i g ~ ~ ~ measured also the excitation function of these reactions and showed that the cross-sections are far from being constant over the energy range used (550 to 650 keV) and hence the calibration by a standard should also include a correction to account for the different thicknesses of the target and of the standard. Trocellier et aL40 used irradiation with 1.45-MeV deuteron beam to determine simultaneously carbon and oxygen by the I2C (d,p) I3C and 1 6 0 (d,p) "0. The deuteron energy was chosen to be 1.45 MeV as a compromise between carbon and oxygen determination; lower incident energy will allow more sensitive determination of oxygen. The beam have a cross-section of 5 x 5 ( ~ m and~the deuteron current is 0.4 to 0.8 n.4, the spectra of the protons are detected by a ring surface barrier detector covered with 25-pm aluminum absorber to stop the backscattered deuterons. It should be pointed out that carbon can also be determined by lower energies as can be seen in Figure 1 in which Berti and Drigo obtained the peak of carbon even at 0.6 MeV. The used energy should be optimized to the C/O ratio in the sample. Ligeon et al.41determined the concentration of phosphorus in silicon using the 31P(p,cx) 28Sireaction with the measurement of prompt cx particles.
+
111. GALLIUM ARSENIDE LindstromI7 listed in a table the activities induced in various semiconductors by thermal neutron irradiation. However, this table is very erroneous for the real irradiation of GaAs in nuclear reactors. This table shows that the longest half-life is 26 h of 76Asand consequently after 15 to 20 d of cooling it can be expected to have very little activity of the matrix. However, most of the nuclear reactors also have epithermal and fast neutrons which lead to the formation also of 74As(17.7 d) by the 75As(n,2n) 74Asreaction and thus very long cooling is required (at least half a year) to reduce the matrix activity considerably. Table 2
Volume 11
589
summarizes the radioactive nuclides produced in GaAs matrix by reactor's neutron irradiation together with their nuclear properties. In spite of the low cross-section for formation of 74As, due to the long irradiation time and the long decay time used, its activity dominates the activity of the matrix in most NAA s t u d i e ~ .Szabo5 ~ ~ . ~ wrote ~ that due to the high matrix activities produced in GaAs crystals on irradiation with reactor neutrons, nondestructive gamma spectrometry can be used only for the analysis of impurities with either very shortlived activities (few minutes, e.g., as Al) or activities with very long half-lives of over a month (Cr, Zn, Se, Te, Fe, Co, Hg). However, for these long-lived radionuclides, the long decay time of about half a year is usually prohibitive. Thus the neutron activation analysis of trace elements in GaAs must be a destructive analysis. However, Wolfstirn4" made an instrumental neutron activation analysis by measuring only doping elements, i.e., relatively high concentration in the order of ppm and mainly for long-lived radionuclides, he continued his measurements up to 130 d. Si and P were measured by their P activity, Cr, Ge, Au, Zn, and In were measured by their y activity. Green et a1.45analyzed by activation analysis the concentrations of Si, Zn, and Mg in gallium arsenide. Each element determined was isolated in a radiochemically pure form and then measured. Artyukhin and co-worked6 removed the Ga and As and then separate groups of elements and measured them together. However, as these measurements were done with NaI (Tl) this separation to groups was necessary, while with Ge(Li) or HPGe, these elements can be determined together. Artyukhin et al.46 removed the As by distillation of AsBr,, dissolving the GaAs in concentrated HCI plus addition of bromine dropwise and then evaporating to dryness. However, in this distillation, most of Sn, Se, and Sb was also volatilized together with part of Te and Mo. The Ga was removed by extraction with chlorex (P,P1 dichlorodiethyl ether). The removal of Ga is necessary only if some elements with only short-lived radioisotope has to be determined. MaenhauP2 and Liu et aL4, irradiated the GaAs for 10 d and let the activity to decay for 20 d in which all the Ga activities decay completely. This method is much better than the separation of just few elements as was done for Se and Te by Rausch and Salam~n.~' As Artyukhin et al.46found that some of the elements are volatilized together with AsBr,, M a e n h a ~ and t ~ ~Liu et aL4, used evaporation of AsCI, to remove the As. In order to ascertain that Sn and Sb will not volatilize, M a e n h ~ u t ~ ~ 1 mg Sb carrier together with 10 IA.~ of all added before the distillation 1 mg Sn carrier the other studied elements. Liu et a1.43did not add any carriers. Using radiotracers, Maenhaut of the arsenic was left after the AsCI, distillation while found that less than 1.3 x 96, 97, and 100% were left for Sn, Sb, and Te, respectively. Liu et a1.43extended this recovery study and found that Ba, Co, Cr, In, Ni, Sb, Te, and Zn are recovered with yield between 98 and 100% after the removal of AsCI,. Table 3 gives the limits of detection for various elements in gallium arsenide samples as measured by M a e n h a ~ and t ~ ~Liu et a1.43 It should be noted that while Maenhaut was able to measure the contamination by some elements of its GaAs samples, due to the improvement in GaAs fabrication and purification techniques, Liu et al. could find only contamination by Cr for some of the samples. The use of larger samples (they used only 0. lg) with larger fluxes will lead to lower detection limits, if necessary. The values given in Table 3 are the lowest found for several GaAs sample, however, each sample has other detection limits, either due to incomplete removal of As, or background from some doping elements as most of these GaAs were doped with one element. Martin et al.48measured the concentration of chromium in GaAs, but there are not details on the irradiation and counting condition. Their limit of detection for Cr is 57 ppb, much larger than was found by Maenhout and Liu et al. Kudo and S u z ~ kmeasured i~~ the concentration of several elements in GaAs (Mn, Ni, Cu, Zn, Ag, Cd, and Au) by the method of substoichoiometric radioactivation analysis (see Chapter 9 in Volume I). Cu, Zn, Ag, and Cd were substoichiometrically separated as dithizone complex, Au by Rhodamine-B, Ni by sodium diethyldithio carbamate, and man-
+
TABLE 3 Detection Limits Found for Trace Elements in a GaAs Matrix (ppb) Element
Ref. 42
Ref. 43
Both references irradiated 0.1-g GaAs samples for 10 d at fluxes of 2 1013 n ~ r n - s-' ~ (Reference 42) or 5 loE2n ~ r n - s-I ~ (Reference 43) and were cooled for 20 d. Reference 42 counted for 1000 min while Reference 43 counted for 2000 s or less.
.
.
.
.
ganese by tetraphenyl arsonium chloride. However, it seems in most cases more advantageous to remove the As and measure together all these elements. Oxygen and carbon content of GaAs were determined by CPAA, oxygen by the 1 6 0 (t,n) 18Fr e a ~ t i o nor~ the ~ , ~16 ~0(3He,p) 16Pand 6 carbon by the 12C(d,n) 13Nr e a c t i ~ n . ~ ~ . ' ~ . ~ ~ Carbon in GaAs was studied by two groups, one in France and one in Japan, both using the 12C (d,n) 13N reaction followed by a chemical separation of 13N and its measurement. Fukushima et a1.26used 12-MeV deuteron while Misdaq et a1." used deuterons of 8 MeV. Fukushima et a1.26 fused the irradiated gallium arsenide together with copper by radiofrequency heating and found that all 13N, was volatilized and after passing through heated CuO column and an Ascarite column, the 13Nwas trapped by molecular sieve 5A column cooled to liquid nitrogen temperature. No detection limit for C in GaAs was given by this group. The French group used for 13Nseparation the method developed by Fedoroff et al. for Si,36 which it is principally the same, except that it involves elimination of fine particles by washing of the gases in 2 N H,SO, and the N, is trapped not by molecular sieve at liquid nitrogen temperature but rather in a Ti sponge at 900°C. For irradiation of 20 min with 3 pA of 8-MeV deuterons, a detection limit of 0.5 ppb when counting with a Ge(Li) detector or 0.2 ppb when using two NaI detectors in coincidence was found. The same group studied also the possibility of using instrumental CPAA for measuring carbon in GaAs.*O In that case, the deuteron energy should be lower in order to cause no activation of the GaAs matrix. It was found that the intensity induced in As is increasing strongly above 2.6 MeV, so they used 3.0-MeV deuteron irradiation and the etching of a layer of 10 Fm thickness from the surface in order to remove handling and irradiation contamination reduced this energy to 2.6 MeV. For 10 min irradiation at 1.5 FA, they found detection limit of 25 ppb. Instrumental CPAA of GaAs with 3 MeV tritons (2.6 to 2.8 MeV after etching) leads to overall accuracy of better than 10% at the level of 30 ppb and the detection limit is 6
Volume 11
591
p ~ b , ~in O the determination of oxygen by instrumental CPAA. Similar detection limit (5 ppb) was found by Fukushima et a1.26for determination of oxygen with 12 MeV 3He ions using the 160(3He,n) 18Freaction including 18F separation. Thus it is preferable to use the instrumental analysis with tritons. However, very few accelerators are equipped to handle triton beams.
IV. GERMANIUM The main activity induced in Ge irradiated by reactor neutrons and long lived enough after few hours are 71Ge,77Ge,7 6 A ~7,7 A ~72Ga, , and 69mZndue to the reactions abundance
70Ge(n,y) "Ge
76Ge(n,y) 17Ge
12
.
77AS
74Ge(n,y) ?'Ge 82'3
X
cross-section = 0.71 b
-
75As(n,y) 76As
5.4
0.14 b
26.3 h
4.95 x l o - 5 b
72Ge(n,p) 12Ga 14.1 h , 'IGe (n,a) 68mZn 13'9
x I O - ~II
,
6.9
x lo-" b
Hoste and collaborator^^^ found also 74As, produced by the sequence 74Ge(n,y) 75Ge P75As(n,2n) 74As 17.76 d but its activity is very low. Looking at this list shows 82.8 m that only a very long delay time will allow measurement of low concentration trace elements. Adams et al.52measured the concentration of some trace elements in germanium by instrumental neutron activation analysis. They irradiated samples of 0.5 g of either pure Ge or Ga-doped germanium for 13 d at a thermal neutron flux of 1014 n cm-2 s-I and made two measurements for each sample: after 20- d cooling a count of 20 to 50 h and after 100 d of cooling another count for 100 to 130 h. In the first count with the higher background, all the interfering activity induced in germanium has y energy of less than 635 keV and all the interference above it are due to background. Their result for the detection limits of the varions elements are given in Table 4. For measurement of elements of only short-lived radioisotopes or if a faster answer than 3 months is needed, a destructive analysis must be used. The irradiated Ge sample must be dissolved and either the germanium bulk is removed (sometimes also Ga and As must be removed), or the required elements are extracted. Several works were done on separation of several elements from Ge or GeO, m a t ~ - i x .Germanium ~~-~~ can be dissolved either by acidic media, e.g., HF-HNO, 1:l mixture under slight heating to initiate the exothermic process of the d i s s o l ~ t i o nand ~ ~aqua regia with heating58.62 or by basic media as for example NaOH-KNO, melt,54or 10% hydrogen peroxide 6 M KOH.58Germanium can be removed from the dissolved irradiated mixture either by distillation of the volatile GeC14.58,62 however, some elements which also form volatile chlorides (e.g., As, Hg, Sn, Sb) are removed also and cannot be determined. Shuba and coworker^^.^^^^" removed the Ge by precipitation of the Ge as germanium oxide hydrate, xGeO, yH,O. Using radiotracer Ge, it was found that 100% of the germanium was precipitated. Veriovkin et al.65 suggested the removal of germanium together with As by solvent extraction as it is known that only Ge and As are extracted from mixed chloride-iodide media by carbon tetrachloride. However, due to the low capacity of carbon tetrachloromethane as extractant and the rather low distribution coefficients of germanium, manifold repetition of the extraction process is required, and Veriovkin and co-workers used extraction chromatography.65In this chromatographic separation, the organic phase was fixed on an inert solid carrier (silica gel hydrophobized with methyl trichlorosilane). Using germanium solution of concentration 20.07 M in 9 M HC1 + 0.3 M KI, all germanium and arsenic were removed. Purification factor of 101° and 10'
.
+
-
-
592
Activation Analysis TABLE 4 Detection Limits for Several Trace Elements in Germainium (0.5-g Sample) (in ppb) Element
INAA5'
NAA with chemical separation"
Reference 52 irradiated with a flux of tO14 for 13 d and counted 100 h; Reference 6 5 irradiated 1 d at a flux of 5 1012n c m 2 . s-'.
.
for Ge and As, respectively, were found. The recovery of other elements from this column, while Ge and As were retained on the column, was studied for 13 elements using radiotracers (Na, K, Sc, Cr, Mn, Fe, Co, Zn, Se, Rb, Sr, Mo, and Au). For 12 of these elements (all except gold), the chemical yield is about 90% while the recovery yield of gold is not constant, probably due to its partial reduction. To get rid of the 72Gaactivity, it is extracted by P, P'-dichlorodiethyl ether. Together with extraction of Ga, there is also quantitative extraction of Fe, Sb, and Au into the organic phase and consequently these elements are analyzed after 3 to 5 days of cooling. Veriovkin et a1.65irradiated 0.5-g germanium for 24 h at a neutron flux of 5 1012 n . cm-2 ' followed by 12 h of cooling. The surface was etched by concentrated nitric acid and then the sample was dissolved in HNO, + HF and Ge and As were separated. The other elements eluate is diluted to 15 to 20 rnL and counted. The detection limits are given in Table 4 together with the results of the limits of detection for the instrumental analysis. A note should be taken for the large difference in flux and in irradiation time. For two elements, there are inherent interference in their determination in Ge matrix, i.e., As and Ga, as the nuclides used for their determination 76As and 72Gaare produced
.
Volume 11
593
also from the Ge matrix itself. For the case of Ga, the interference is so strong, equal to 25 ppm and thus low concentration of Ga can be determined only by double irradiation, one with a thermal neutron absorber (Cd or B) and one without (see Volume 2, Chapter 1 of this book). For the case of 7hAsas its formation from germanium is a secondary reaction [74Ge(n,y); P--; (n,y)], its interference depends on the cross-section for 74Ge(n,y) 75m+gGe reaction a, the neutron flux 4, the irradiation time t, and the decay constants of 75Geand 76As, A1 and X, respectively. DeNeve et a1.55 showed that the interference of Ge to As determination expressed as contamination of As in Ge in ppb is given by the equation.
Valladon and D e b r ~ nstudied ~ ~ nondestructively the concentration of oxygen in germainium using the 160(t,n) I8F reaction and measuring the P+ activity of the I8F formed. The P activity was measured with a Ge(Li) detector and not NaI(T1) due to the high activity of the matrix. The Ge sample was irradiated 90 to 180 min with 400 nA of 3-MeV tritons, and after the irradiation 10 wm deep from the surface were etched to remove surface contamination. The actual irradiation energy was thus 2.7 MeV. The irradiation should not be done with higher energy tritons, since the extra activity induced in the Ge will not allow instrumental analysis. The main activity induced in Ge is that of 76Asfrom the reaction 74Ge (t,n) 76Asand the detection limit of oxygen in Ge is 25 ppb. +
V. OTHER SEMICONDUCTORS Agarwal et a1.66studied the concentration of impurities in gallium phosphide by activation analysis. As was discussed in the chapter dealing with gallium arsenide, the activity of gallium decays completely after 15 to 20 d, however, the 32Pproduced from phosphorus is long lived (14.3 d). Fortunately, phosphorus is only P emitter and thus it interferes with the measurement of the y-rays spectrum only through the bremstrahlung produced from the slowing down of the P particles. This bremstrahlung was stopped by the use of 3.5-cm thick lead sheet between the source and the detector. This P rays shielding decreased also the gamma rays from the contaminants, the decrease being very high for y energies below 0.5 MeV. The use of only lead to stop the P particles and bremstrahlung neglects the fact the bremstrahlung formation is larger with high Z material. A better technique to eliminate the 2bremstrahlung from the 32Pwill be, e.g., to use 4-mm polyethylene or PlexiglassB mm or even thinner lead. They irradiated 300-mg GaP sample for 65 h with a thermal flux of 5 . 10" n cm-2 sP1,and let the sample be cooled for 20 d after which it was counted and 5 elements were determined (Ag-85 ppb, Co-17 ppb, Fe-34 ppb, Sb-Eppb, and Sc-5.4 ppb). These are not detection limits but rather concentration found by instrumental activation analysis. For elements forming radionuclides with medium half-lives, they66 developed a radiochemical separation method. Irradiated Gap was dissolved in aqua regia and carriers were added. The liquid evaporated to dryness and then the residue dissolved in 5 ml concentrated HC1, diluted to 3 N HC1 and As, Ag, Au, Cu, Hg, and Sb were precipitated with H,S. Ag, Au, and Cu were singly separated by electrolysis while As, Hg, and Sb were counted together. The other elements were separated on a column of Dowex 1 x 10 resin. The various elements were separated by varying the HCI concentration of the eluant. However, traces of ',Ga was found in all the fractions and all were let to decay, similarly to the nondestructive determination so the advantage of the radiochemical separation for this group of elements is minimal. No detection limits from these determinations are given, but the concentration of 17 elements found in several samples of Gap are reported. Misdaq et a1.51determined the concentration of impurities in InP by proton activation
+
-
.
594
Activation Analysis
rather than neutron activation due to the high activity with long half-life induced by neutrons (14"lIn t,,, = 49.5 1 d). They used 21-MeV protons and irradiated with 5 pA for 2 h. The samples were thinner than the proton range (1 mm thick compared with 1.75-mm proton range) and were cooled with liquid N,. The detection limits found for instrumental analysis are Cr(0.3 ppb), Fe(1 ppb), Cu(0.8 ppb) ,and Zn(0.5 ppb) . The same group5' also determined the oxygen content of InP using the 160(t,n) 18F reaction, separating radiochemically 18F and they obtained detection limit of 0.15 ppb oxygen in indium phosphide. Misdaq et al.51 studied also the carbon content of GaAlAs by using the 12C (d,n) 13N reaction, measuring 13N. Hung et al.67studied the concentration of trace contaminants in CuInS, semiconductor material mostly by atomic absorption spectrometry and partly by neutron activation analysis. For the atomic absorption measurement, copper is removed by electrodeposition and indium is removed from the residue by extraction of HInBr, with isopropyl ether. Ag and Hg are quantitatively removed together with the Cu by the electrodeposition and they are determined by activation analysis after letting the T u (half-life 12.7 h) to decay. Activation analysis of the other elements can be done only after removal of the Na and Br which are introduced in the process of extraction of the In. This can be done by APDC coprecipitation with Pb or by APDC-methylisopropyl ketone extraction. The detection limit for Hg is 0.1 ppm while for Ag concentration of 0.8 ppm was found.
REFERENCES 1. Yamakawa, K. A., The Effects of Impurities on the Performance of Silicon Solar Cells, Report DOEIJPL1012-57, Jet Propulsion Laboratory, U.S. Department of Energy, Pasadena, CA, 1984. 2. Morrison, G. H. and Cosgrove, J. F., Activation analysis of trace impurities in silicon using scintillation spectrometry, Anal. Chem., 27, 810, 1955. 3. Kant, A., Cali, J. P., and Thompson, H. D., Determination of impurities in silicon by neutron activation analysis, Anal. Chem., 28, 1867, 1956. 4. Heinen, K. G. and Larrabee, G., Activation analysis of silicon by convention camer separations and by computer reduction of gamma spectra, Anal. Chem., 38, 1853, 1966. 5. Szabo, E., Activation analytical methods for the grading of semiconductor crystals, J. Radioanal. Chem., 19, 23, 1974. 6. Fujingawa, K. and Kudo, K., Instrumental neutron activation analysis of semiconductor grade silicon, J . Radioanal. Chem., 52, 411, 1979. 7. Fujingawa, K. and Kudo, K., Application of instrumental neutron activation analysis in Czochralski silicon crystal growth, J. Radioanal. Chem.. 62, 195, 1981. 8. Wiehl, N., Herpers, U., and Weber, E., Study on the solid solubility of transition metals in high pruity silicon by instrumental neutron activation analysis and anticompton-spectrometry, J . Radioanal. Chem., 72, 69, 1982. 9. Revel, G., Deschamps, N., Dardenne, C., Pastol, J. L., Hanii, B., and Nguyen Dinh, H., Characterization of solar grade silicon by neutron activation analysis, J. Radioanal. Nucl. Chem., Lett., 85, 137, 1984. 10. Revel, G., Place of neutron activation amongst the other modem methods of analysis, Euroanalysis VI Conference Proceedings, 1987, Roth, E., Ed., Editions Physiques, Paris, 1988, 167. 11. Theunissen, M. J. J., Jaspers, H. J. J., Hanssen, J. M. G., and Verhejjke, M. L., Neutron activation analysis of the process of metal gettering in silicon slices, J. Radioanal. Nucl. Chem.. Articles, 113, 391, 1987. 12. Verheijke, M. L., Jaspers, H. J. J., Hanssen, J. M. G., and Theunissen, M. J. J., Application of neutron activation analysis in the field of silicon technology for the modem electronic industry, J. Radioanal. Nucl. Chem., Articles, 113, 397, 1987. 13. Haas, E. W. and Hofmann, R., The application of radioanalytical methods is semiconductor technology, Int. J. Sol. Stat. Elect., 30, 329, 1987. 14. Riotte, H. G., Herpers, U., and Weber, W., Purity control of semiconductor grade silicon by instrumental neutron activation analysis with respect to interpretation of EPR signals, Radiochem. Radioanal Len., 30, 311, 1977.
Volume 11
595
15. Keenan, J. A., Gnade, B. E., and White, J. B., Instrumental neutron activation analysis of processed silicon, J. Electrochem. Soc., 132, 2232, 1985. 16. Chu, C. C., Chen, P. Y., Yang, M. H., and Alfassi, Z. B., Determination of impurities in Si and chlorosilanes by neutron activation analysis and inductively-coupled plasma atomic emission spectrometry, Analyst, in press. 17. Lindstrom, R. M., Activation analysis of electronics materials, in Microelectronics Processing: Inorganic Materials Characferizafion, Casper, L. A , , Ed., ACS Symposium series No. 295, American Chemical Society, Washington, D.C., 1986, 294. 18. Niese, S., Neutron activation analysis of semiconductor silicon, J . Radioanal. Chem., 38, 37, 1977. 19. Haas, E. W., Hofmann, R., and Richter, F., Errors in activation analysis by nuclear recoil, J. Radioanal. Chem., 69, 219, 1982. 20. Jaskolska, H. and Rowinska, L., Determination of phosphorus in semiconductor grade silicon by neutron activation analysis, J . Radioanal. Chem., 26, 31, 1975. 21. Alfassi, Z. B. and Yang, M. H., On the determination of P depth profile in phosphorus doped silicon, J . Radioanal. Nucl. Chem. Len., 132, 99, 1989. 22. Thurber, W. R. and Carpenter, B. S., Boron determination in silicon by the nuclear track technique, J. Electrochem. Soc., 125, 654, 1978. 23. Downing, R. G., Maki, J. T., and Fleming, R. F., Analytical applications of neutron depth profiling, J . Radioanal. Nucl. Chem. Arficles, 112, 33, 1987. 24. Ziegler, J. F., Cole, G. W., and Baglin, J. E. E., Technique for determining concentration profiles of boron impurities in substrates, J . Appl. Phys., 43, 3809, 1972. 25. Riley, J. E., Jr. and Lindstrom, R. M., Determination of boron in borosilicate glasses by neutron capture prompt gamma ray activation analysis, J. Radioanal. Nucl. Chem. Articles, 109, 109, 1987. 26. Fukushima, H., Kimura, T., Hamaguchi, H., Nozaki, T., Itoh, Y., and Ohkubo, Y., Routine determination of light elements by charged-particle activation analysis, J. Radioanal. Nucl. Chem. Articles, 112, 415, 1987. 27. Nozaki, T., Yatsuruti, Y., and Akiyama, N., Charged particle activation analysis for carbon, nitrogen and oxygen in semiconductor silicon, J . Radioanal. Chem.. 4, 87, 1970. 28. Nozaki, T., Yatsurngi, Y., Akiyama, N., Endo, Y., and Makide, Y., Behaviour of light impurity elements in the production of semiconductor silicon, J . Radioanal. Chem., 19, 109, 1974. 29. Gross, C., Gaetano, G., Tucker, T. N., and Baker, J. A., Comparison of infrared and activation analysis results in detennining the oxygen and carbon content in silicon, J. Electrochem. Soc., 119, 926, 1972. 30. Nozaki, T., Iwamoto, M., Usami, K., Mukai, K., and Hiraiwa, H., Helium-3 activation analysis of oxygen in silicon nitride films on silicon wafers, J. Radioanal. Chem., 52, 449, 1979. 31. Schweikert, E. A. and Rook, H. L., Determination of oxygen in silicon in the sub-part-per-million range by charged particle activation analysis, Anal. Chem., 42, 1525, 1970; Rook, H. L. and Schweikert, E. A., Ultra trace determination of oxygen and carbon by charged particle activation analysis, Anal. Chem.. 41, 958, 1969. 32. Martin, J. and Haas, E., Deuteronenaktivierungs anlalyse von kohlenstoff in silicium, A. Anal. Chem., 259, 97, 1972; Haas, W. E. and Martin, J. A., Stomng der kohlenstoffbestimmung uber deuteronenaktivierungs analyse durch kohlenstoff aus dem beschleuniger, Radiochem. Radioanal. Lett., 7, 121, 1971. 33. Hoste, J. and Vandecasteele, C., Determination of light elements in metals and semiconductors by charged particle activation analysis, J. Radioanal. Nucl. Chem., Articles, 110, 427, 1987. 34. Valladon, M. and Debrun, J. L., Determination of oxygen in metals and semiconductors by means of the 160(t,n)1sFreaction, J . Radioanal. Chem., 39, 385, 1977. 35. Birattari, C., Bonardi, M., and Cantone, M. C., Determination of arsenic in silicon matrices by proton activation analysis, J . Radioanal. Nucl. Chem. Articles, 113, 309, 1987. 36. Fedoroff, M., Loos-Neskovic, C., Rouchaud, J. C., Samosyuk, V. N., and Chapyzhnikov, B. A., Simultaneous determination of nitrogen and carbon in silicon by photon activation, J . Radioanal. Nucl. Chem. Art., 88, 45, 1985. 37. Pollock, G. A., Hydrogen measurement on thin film silicon: hydrogen alloy films. Technique comparison, Muter. Res. Soc. Symp. Proc., 48, 379, 1985. 38. Chevallier, J. and Beyer, W., Determination of the boron concentration in a-Si:H films by nuclear reaction method, Solid State Commun., 40, 771, 1981. 39. Berti, M. and Drigo, A. V., Simultaneous nuclear microanalysis of nitrogen and oxygen on silicon, Nucl. Instrum. Methods, 201, 473, 1982. 40. Trocellier, P., Cahanel, C., Pastol, J. L., and Revel, G., Determination of carbon and oxygen in polysilicon using a nuclear microprobe, J. Radioanal. Nucl. Chem. Len., 118, 89, 1987. 41. Ligeon, E., Bruel, M., Bontemps, A., Chambert, G., and Monnier, J., Analyse du phosphore dans le silicium par reactions nucleaires, J . Radioanal. Chem., 16, 537, 1973. 42. Maenhaut, W., Determination of 17 trace elements in gallium arsenide by reactor neutron activation analysis, Anal. Chim. Acra, 75, 31, 1975.
596
Activation Analysis
43. Liu, R. S., Chen, P. Y., Alfassi, Z. B., and Yang, M. H., Determination of the concentration of doping and trace elements in gallium arsenide by neutron activation analysis, Anal. Sci., in press. 44. Wolfstirn, K. R., Survey analysis of impurities in gallium arsenide by instrumental neutron activation, J. Phys. Chem. Solids, 31, 601, 1970. 45. Green, D. E., Helsop, J. A. B., and Whitley, J. E., Analyst, 522, 1963. 46. Artyukhin, P. I., Gilbert, E. K., and Pronin, V. A., Radioactivation determination of impurities in gallium arsenide, Sov. Radiochem., (English translation of Radiokhimiya), 9, 334, 1967. 47. Rausch, H. and Salamon, A., Activation analysis of selenium and tellurium trace impurities in gallium, arsenic and gallium arsenide, Talanta, 15, 975, 1968. 48. Martin, G. M., Verheijke, M. L., Jansen, J. A. J., and Poiblaud, G., Measurement of the chromium concentration in semi-insulating GaAs using optical absorption, J. Appl. Phys., 50, 467, 1979. 49. Kudo, K. and Suzuki, N., Application of substoichiometry to radioactivation analysis. Determination of trace impurities in high purity materials, J . Radioanal. Chem., 19, 55, 1974. 50. Valladon, M., Blondiaux, G., Koemmerer, C., Hallais, J., Poiblaud, G., Huber, A., and Debrun, J. L., Contribution of activation analysis with low energy charged particles to studies on GaAs, J . Radioanal. Chem., 58, 169, 1980. 51. Misdaq, M. A., Blondiaux, G., Bordes, N., Giovagnoli, A., Valladon, M., Wei, L. C., Hage Ali, M., Maggiore, C. J., and Debrun, J. L., Recent progress in the study of semiconductors using charged particle activation, J . Radioanal. Nucl. Chem. Articles, 110, 441, 1987. 52. Adams, F., Maenhaut, W., and Hoste, J., Instrumental activation analysis of germanium, Anal. Chim. Acta., 61, 127, 1972. 53. de Neve, R., de Soete, D., and Hoste, J., Non-destructive activation analysis of trace impurities in germanium, Anal. Chim. Acta, 40, 379, 1968. 54. Hoste, J. and de Soete, D., Some applications of activation analysis for the determination of trace impurities in semiconductor materials, Z. Anal. Chem., 245, 221, 1969. 55. de Neve, R., de Soete, D., and Hoste, J., Second order interference in the neutron activation analysis of arsenic in a germanium mamx, Anal. Chim. Acta, 36, 508, 1966. 56. Ruzicka, J., Stary, J., and Zeman, A., A new principle of activation analysis separation. Substoichiometric determination of traces of silver, Talanta, 10, 905, 1963. 57. Smales, A. A. and Pate, B. D., Determination of submicrogram quantites of arsenic by radioactivation. General method and application to germanium dioxide, Anal. Chem., 24, 713, 1952. 58. Szekely, G., Determination of traces of copper in germanium by activation analysis, Anal. Chem.. 86, 1500, 1954. 59. Chen, S. G. and Tsai, H. T., An internal-monitor method for the determination of arsenic, antimony and copper in germanium by neutron activation analysis, Radiochem. Radioanal. Len., 51, 199, 1982. 60. Razumova, G. N., Shuba, I. D., and Ya Vasilev, I., Neutron activation determination of trace impurities in special purity germanium, Sov. Radiochem., 12, 116, 1968. 61. Morrison, G. H. and Cosgrove, J. F., Activation analysis of trace impurities in germanium using scintillation spectrometry, Anal. Chem., 28, 320, 1956. 62. Gijbels, R., Determination of gold in germanium by neutron activation analysis, Talanta, 20, 346, 1973. 63. Shuba, I. D., Razumova, G. N., and Bocharova, N. N., Determination of indium in germanium by neutron activation, Sov. Radiochem., 10, 496, 1967. 64. Shuba, I. D., Razumova, G. N., and Vasilev, I. Y., Separation of the major component in the analysis of high purity germanium by neutron activation, Sov. Radiochem., 10, 501, 1967. 65. Veriovkii, G. V., Gilbert, E. N., Mikkailov, V. A., and Yakhina, V. A., Neutron activation determination of impurities in germanium, J . Radioanal. Chem., 59, 361, 1980. 66. Agarwal, S., Pinte, G., and May, S., Neutron activation analysis of impurities in gallium phosphide, J . Radioanal. Chem., 38, 165, 1977. 67. Hung, C. F., Chen, P. Y., Weng, L. Y., Huang, H. L., and Yang, M. H., Analytical characterization of CuInS, semiconductor material, Talanta, 31, 259, 1984.
Volume 11
597
Chapter 16
DEPTH PROFILING OF SILICON BY NUCLEAR ACTIVATION METHODS Zeev B. Alfassi and M. H. Yang
TABLE OF CONTENTS I.
Introduction.. . . . . . . . . . . . . . . . . . . . . . . . . . . . . . . . . . . . . . . . . . . . . . . . . . . . . . . . . .. . . . . . . . . .598
11.
Delayed Destructive Method.. . . . . . . . . . . . .. . . . . . . . . . . . . . . . . . . . . . . . . . . . . . . . . . . . . .598
111.
Depth Profiling by Slowing Down of the Product
IV.
Depth Profiling with Narrow Resonances of Nuclear Reactions.. . . . . . . . . .. . . . . .603
. . . . . . . . . . . . . . . .. . . .. . . . . . .. . .601
References. . . . . . . . . . . . . . . . . . . . . . . . . . . . . . . . . . . . . . . . . . . . . . . . . . . . . . . . . . . . . . . . . . . . . . . . . . . . . .605
598
Activation Analysis
I. INTRODUCTION The electrical properties of a semiconductordevice are influenced not only by the average concentration of the dopant elements in the bulk material but also on its depth distribution. A precise knowledge of the depth profile of the concentration of the impurities, mainly of the doping element is very important for establishing mathematical-physical models which describe the behavior of trace elements as a function of production process parameters ("Process-modeling"). ' Various methods exist for measuring the concentration depth profile of various elements in semiconductors, such as electrical measurements, magnetic measurements, infrared spectroscopy, luminescence methods, secondary ion mass spectrometry (SIMS), particle-induced X-ray emission (PIXE), electron microprobe, radiotracers, Rutherford backward scattering, nuclear forward scattering, and nuclear activation. Some people may classify also Rutherford backward scatteringZand nuclear forward scattering as nuclear activation methods since they use high energy charged particles from accelerators, but since they do not involve a nuclear transformation process, we decided to disregard them in this chapter. In principle, there are three main methods for depth profiling of the concentration of trace element using nuclear transformation reactions. A destructive method in which the whole sample is activated and then divided to a number of sections of varying distances from the surface either by gradual slow dissolution or by gradual milling and grinding. (For each layer, its thickness and y or p activity of the various elements are measured.) Using a nuclear reaction of the dopant element which leads to emission of a high kinetic energy particle (ion) with a definite kinetic energy. This particle, while transversing in the semiconductor from its place of formation inside the sample to the detector of these particles positioned in front of the semiconductor sample, is losing part of its energy, depending on the distance it traveled in the semiconductor. Thus, the energy spectra measured for this particle is related to the concentration depth profile of the element which is responsible for this nuclear reaction. Using a nuclear reaction of charged particles with the measured elements which have a very peaked large resonance in the excitation function (the dependence of the cross section on the energy) and that this reaction leads to emission of a y photon or another particle (lighter than the original ion), i.e., the emission will occur practically only if the accelerated ion had exactly the energy of this resonance. If we accelerate the charged particles exactly to the resonance energy, they will react with the atoms on the surface of the semiconductor. However, if the accelerator is tuned up to higher energy, the charged particles will not react with atoms on the surface due to their too high energy. After traveling some distance in the semiconductorsample, the accelerated ions lose part of their energy and at a certain distance from the sample surface their energy will be degraded exactly to the energy of the resonance and they will react with the atoms of the measured element at this depth. Thus the activity of the emitted radiation (particles or photons) is proportional to the concentration of this element. at the specific depth. The functional dependence of the activity measured on the energy of the bombarding projectile can be transformed to the concentration depth profile of this element.
11. DELAYED DESTRUCTIVE METHOD In this method, either the whole sample is activated and the activity of each layer is measured separately (either directly or by differences) or the sample is first sectioned and
Volume 11
599
each fraction is activated and measured. Three basic techniques exist for sectioning: (1) mechanical polishing using fine abrasive powder, (2) chemical etching which uses solutions which dissolve slowly the surface of the sample, and (3) oxidation followed by etching of the oxide layer. Anodic oxidation followed by the dissolution of the film of the oxide is a frequently used technique for profile measurement. Use of organic solvents for the anodic oxidation leads to slower rate of formation of the oxide layer and thus it is more controllable and better oxide films are formed. Lan and Yang3 studied the concentration depth profile of arsenic in silicon by neutron activation analysis (NAA) and compared it to results from differential pulse cathodic stripping voltammetry (DPCSV). They studied n-type silicon wafers (1,1,1) orientation doped with arsenic by ion implantation. The gradual removal of layers was done by constant current anodization of the silicon with 3 rnAkm2 until the net forming voltage across the sample reached 100 V. Under this condition, about 50 nm thick Si was oxidized to SiO,. This layer was removed by dissolution with 0.1 M hydrofluoric acid and 5 M HCI. The thickness of the removed layer was measured both by ellipsometry and by chemical analysis of the amount of Si in the dissolved solution. The neutron activation was done on each solution separately rather than on the whole wafer before sectioning in order to use larger area wafer and to enable one to compare the NAA results with those from DPCSV using the same wafer. However, this leads to serious problems of contamination of the samples with Br probably due to its presence in one of the dissolving agents. Br was removed by distillation after oxidizing As(II1) to the nonvolatle As(V) by KMnO, which also transform Br to Br,. "Br was removed completely while about 95% of 76As was retained in the solution. The detection limit found for As concentration (12-h irradiation with neutron flux of 3 X loL2 n cm-2 S-') was about 1 ng per layer compared to 10 ng per layer obtained by DPCSV. For silicon wafer of 5-cm diameter with a layer thickness of 500 A this means loLsatoms As/cm3 (20 ppma). Larrabee and Keenan4 studied the concentration profile of several elements (Na, As Cu, Au, Sb) in a 20+m epitaxial film on a substrate doped with B or Sb and the As-concentration profile in arsenic-doped epitaxial film. They irradiated at 1.5 x 10" n . cm-' s-I for 14 h and cooled for 36 h. The sectioning into layers was done on the irradiated epitaxial silicon sample using two etching solutions (1) for etching of 8 ~ m l m i n , they used HF:HNO,:CH,COOH 2:lS:S vol/vol; (2) for slower etching of lprn/min, they used the etching mixture 1:40:1 of the same chemicals. They determined the amount of material removed by infrared interferometry spectroscopy and found that the etching rate for each etching solution composition was constant and reproducible. Due to the low volume of the Ge(Li) detectors in that time (16 cc) they used both NaI(T1) and Ge(Li) y-ray spectrometer. The less efficient Ge(Li) system was used predominantly as a pilot detector in order to identify the components of complex apectra for the computer analysis. Haas et aL5 studied the contamination and cross-contamination induced in the process of ion implantation in silicon. They removed layers of approximately 10 nm from activated wafers by anodic oxidation followed by stripping the formed oxide layer with 5% HF solution s-I for 24 to 144 h). Jahnel et aL6 studied the arsenic (irradiation at 8 x 10¹³ n concentration depth profile in SiO, and Si3N4.The SiO, and Si3N4wafers were activated ~ 24 h, irradiating the whole wafers. by neutrons with thermal flux of lot3n ~ m s-I- for After cooling for approximately 1 d and annealing at 700°C for 30 min in order to repair the radiation damages of the neutron activation and the ion implantation, the wafers were sectioned. The sectioning into layers of known thickness were done by dissolution at room temperature with 0.5% buffered HF (SiO,) and 40% HF (Si,N,). The etching rates were approximately 40 nm/min and 20 nm/min, respectively. Each layer thickness were 10 to 50 nm and the thickness were determined by ellipsometry measurements. Each layer (in 3 ml solution) where then y counted with a Ge(Li) detector connected to a multichannel analyzer.
.
.
.
Rausch et al.' studied the concentration depth profile in silicon of arsenic, antimony, and phosphorus and also obtained detection limits for Au, Cu, and Na. The semiconductor was irradiated for 24 hours at a flux of 3 X lOI3 n s-' cm-'. Uniform removal of successive superficial layers were done by controlled etching. They found that the etching rate was strongly dependent on the ratio of hydrofluoric to nitric acid, the two major components of the etchant generally used for silicon. The etching rate can be reduced and regulated by the addition of buffer acids, such as acetic and/or phosphoric acid. They use 10 rnl of solution of composition of HFIHN03/CH3COOHIH3PQ of 1: 10:6:3. The deviations in the removal rate were below 5% per sample and below 15% from sample to sample. The amounts removed were determined by weight losses of the sample or in cases where no cooling time was used by counting the 1.26-MeV gamma activity of the isotope. Arsenic, antimony, gold, and sodium were measured by their y activity and the detection limits are 5 lOI3, lOI4, lo1,, and 5 loL4atoms per cubic centimeter, respectively, (for 1-pm etching depth). Phosphorus and copper were measured by their P activity and their detection limits are 5 1015and lOI4, respectively. Since phosphorus is an important dopant of n-doped silicon and since it is commonly accepted that its measurement is difficult and with relative large error,8 it is felt that a comment on these measurements must be made concerning its very high limit of detection. The P activity was measured with a NaI detector which is not an efficient way to measure (3, although the P of phosphorus has high energy. Since the radi~-~'P is already in solution, its measurement by liquid scintillation should be more than 10 times as efficient leading to considerably lower limits of detection. The use of liquid scintillation will enable also the measurement of the thickness of the dissolved layer by measurement of the Pactivity of ,ISi, 31Sihas only 0.07% of y rays with detection efficiency of less than 5% while it has 100% P- emission with detection efficiency of easily >25%. Taking advantage that 1 to 4 h after irradiation most of the p activity is due to 3 i as it is the major element and after 10 d almost all the activity is due to 32P enable the use of two liquid scintillation countings to measure both the thickness of the dissolved layer and its phosphorus concent r a t i ~ n Bereznai .~ et a1.I0 reported on the determination by neutron activation analysis of the concentration profile of arsenic in the epitaxial layer grown on an arsenic diffused semiconducting silicon. They irradiated for 12 h at a nominal thermal flux of 2 lOI3 n cm-2 s-I. The removal of layers were done by successive etching. It is important to realize that if the activation is done not by (n,y) process as it is done for most elements but by (n,p), @,a), or (n,2n) reaction the produced radioactive nuclides obtained high kinetic energy due to recoil and their mean recoil range is larger than the usual thickness of each layer." Haas et al." measured the concentration of iron in very clean silicon slice irradiated in contact with ion-implanted slice by the two reactions 58Fe(n,y) 59Feand 54Fe(n,p) 54Mn.The first reaction leads to Fe concentration of ~ 2 . 1x atoms per square centimeter while the second reaction yields 7.1 X 10¹³ atoms per square centimeter clearly due to recoil of 54Mn. Ito and NozakiI2 studied the concentration depth profile of oxygen by activation analysis with 3He ions through the 1 6 0 (,He,p) I8F reaction in silicon wafers. The silicon wafers were etched with HF-HNO, (1:3 by volume) mixture and the length of etching time were determined approximately from NO, coloring of the etching solution. The etching was stopped by addition of water to the etching solution. The etched thickness was measured by a dial gauge or from weight differences. Usually, calculation of the concentration profiling should take into account the variation of the activation cross-section with energy, since the energy of the ,He is decreasing when ,He is going through the Si wafer. Itoh and Nozaki, instead of doing these calculations, used a set of several aluminum foils positioned on a cylindrical frame and rotated across the ,He beam. The foils thicknesses and width were selected according to the excitation function of the 1 6 0 (,He,p)18F reaction and the ,He range energy curve to activate oxygen with an equal probability along the depth of the sample.
.
.
.
.
Volume 11
601
Quite often the chemical separation of "F is indispensable since '9 emits no y rays in addition to the 51 1-keV annihilation and positron emitters are formed by 3He bombardment of many elements (this is not a problem in the case of a Si matrix, but it is quite a problem in GaAs matrices) where positron emitters 73Seand 76Sr are formed. Nozakii3 studied the separation of I8F by chemical precipitation of KBF,; the KBF, can be purified by recrystallization. If no HF is used in the dissolution, all the other positron emitters can be separated with zirconium oxide c ~ l u m n , instead '~ of separating 18Fas KBF,. Nozaki showed that for various semiconductors, as well as other matrices, the 51 1 keV (more accurately 440 to 580 keV measured with NaI and a single channel analyzer) gives the half-life of 18F. Nozaki et al.I5 used I5N enriched to determine the nitrogen concentration depth profile in silicon via the reaction I5N (a,n) 18Fseparating the IxF as KBF,. This method can be used up to depth of 130 p,m Si with detection limit of 1 ppba.
111. DEPTH PROFILING BY SLOWING DOWN OF THE PRODUCT This nondestructive method of depth profiling is based on the measurement of the energy spectra of the prompt product of the nuclear activation reaction. The product is formed with a specific kinetic energy; a measured lower energy of some of the product particles means that they lost part of their original energy while passing through the semiconductor sample from the point of their formation to the detector, positioned in front of the semiconductor sample. This prompt product of the nuclear reaction must be a charged particle and not a neutron as only charged ions have sufficiently large stopping power, dE/dx, to lead to the required depth resolution in semiconductors. The heavier the emitted ion and the larger its charge, the larger is its energy loss and hence better depth resolution will be obtained. The bombarding projectile leading to the nuclear reaction with the measured element should be a thermal neutron or y photon in order to have the same energy of the particle inducing the nuclear reaction in different depths. In order to enable the measurement of the low concentration common in the semiconductor devices the nuclear reaction should have a high crosssection of the order of at least 10 b. These high cross-sections out photon-induced reaction and even using neutrons very few elements can be determined. The method was developed in 1972 by Ziegler et a1.16 for determination of boron due to the high cross sections of the O ' B (n,cx) 7Li (a = 3837 b). This cross-section is five orders of magnitude larger than that of almost all other stable isotopes for (n,a) reaction (except 6Li). The semiconductor measured sample is placed in a vacuum chamber (pressure less than 5 torr). They needed only about 10" neutrons to detect concentration of 100 ppm boron in a 2-cm2 wafer. The 7Li is produced in both the ground state (6%) and in the 479-keV excited state (94%). The energy are distributed between the a particle and the 7Li according to their masses (1471 and 839 keV for ,He and 7Li in the reaction leading to the excited states). The thermal neutron passes through the Si wafer (170 pm thick) with negligible attenuation so that the reaction efficiency is independent on the depth. The neutron beam was collimated to produce a spot 1 cm in radius at the target chamber (neutron flux 2.3 X 10' n cmp2 s-I). The targets were mounted at a 45" angle to the neutron beam. The a particles were detected by a surface barrier detector subtending an angle of 19 msr and was specially fabricated to have low y and electrons background and to be able to measure the spectrum of the particles in the presence of 7Li although this lead to worse energy resolution for the a particles (FWHM -20 keV instead of 12 to 14). The depth of the boron is determined by the energy loss of the 1471 keV a particles, using the known specific energy loss, dE/dx, thus an energy, E, is parallel to depth given by the equation
602
Activation Analysis
Ziegler et a1. l6 measured the energy spectra of lOI5to 10161°B atoms per square centimeter and calculated a concentration resolution of 3 ppm, and depth resolution of 20 nm. Miiller et al.17 used the high flux reactor of ILL, Grenoble with collimated flux of 1.04 x lo9 n cm-Z s- l and 1.5 cm diameter, a detector with resolution of better than 16 keV for the 1471-keV peak, a counting time of 1000 min 10" O ' B atoms per square centimeter will lead to about integral counts of 110 counts. This is enough for measuring total boron concentration but not for profile determination and they estimated that for profile determination the minimum required concentration is 10'' O ' B atoms per square centimeter. They measured the concentration depth profiles of boron in silicon wafers implanted with 1012, 1013, and 1014 O ' B atoms per square centimeter, the accuracy of the depth determination is about 25 nm. It should be reminded that this is for O ' B atoms while they are only 20% of the natural boron atoms. Kvitek et a1.18 studied the boron concentration profile in Si using both the spectra of the a particles and the 7Li particles. As can be expected from the higher dE/dx the spatial resolution obtained with the 839-keV 7Li particle is better than the one obtained by using the 1431 4He line (by about 30%). However, in a later work, they explainedlg that in spite of the better resolution of the 7Li profiling, the fact that the 7Li line is located in the high background region of the measured spectra often makes the profile analysis by this method quite difficult. They offered in order to obtain better resolution to measure the a spectra with different tilting angles. It is important to suppress the fast neutron component of the flux and Cewena et a1.19 used 300-mm long monocrystalline Si filter to increase the ratio thermal to fast neutron fluxes by a factor of 5. Biersack et a1." discussed the achievable depth resolution and the main sources of uncertainties. He pointed out four main inherent uncertainties: (1) the uncertainty in the angle 0 between the point of reaction and point of detection as the particle travel distance 4, 4 = xIcos0 where x is the depth of the target atom; (2) the uncertainty in the energy resolution of the detector; (3) the uncertainty in energy loss due to energy loss straggling assuming a fixed pathlength, 4; and (4) uncertainty due to multiple angular scattering. They concluded that for (n,a) reaction, depth resolution of 5 nm is feasible while 10-nm depth resolution is feasible for (n,p) reactions. Beside B, the only element which can be determined in this way using the natural abundance is lithium with 7.4% 7Li, having a cross section of 940 b for the reaction 6Li ( n p ) T with a energy of 2055 and T energy of 2728 keV. He can be determined not for natural He but for 3He-dopedsubstrates (stable istope, natural abundance 0.0001%). Similarly Na and Be can be determined with the radioactive isotopes 22Naand 7Be, respectively. Downing et a1." gave a detailed description of the neutron depth profiling system and summarized the available data on various systems in the world. A special attention were given to minimize the contamination of the thermal neutron beams with fast neutrons and gamma rays. The amount of the gamma rays and fast neutrons was reduced by filtering of the beam through 200 mm of sapphire single crystal and 80-mm long silicon single crystal which lead to a cadmium ratio for gold of greater than lo4 and a gamma intensity of 200 mradlh. Jahnel et al. ,6 who measured As profile by destructive activation analysis, measured the B profile in the same matrices (and in extra Si) using the 1°B (n,a) 'Li reaction. In order to increase the cross-section of this reaction and thus increases the sensitivity of the measurement they used neutrons which were cooled to temperatures lower than ambient temperature (subthermal neutrons) since the cross section of this nuclear reaction increases linearly with E-'I2; E being the kinetic energy of the neutrons. Maki et a1.33proposed iterative methods for deconvolution calculations of depth . .vrofiles from measured neutron depth profiling energy spectra. These methods account for the energy broadening due to the system noise, energy straggling, multiple small angle scattering, and geometrical acceptance angles.
I
Volume 11
603
Lee et a1.22tackled the problem of sensitivity of the measurement by suggesting the use of much larger areas detector subtending much larger angle and thus collecting larger fraction of the emitted a particles. Usually the surface barrier detectors subtend a solid angle of the
order of 0.1 % or less in order to allow the assumption that the solid angle distortion function can be approximated by a Gaussian distribution. Lee et a1.22suggested the use of a large detector which will enable to shorten the measurement time by using a model for spectral distortion caused by detection with circular detectors subtending any solid angle. The neutron depth profiling (NDP) technique is quantitative, nondestructive and has few interferences in silicon-based materials. As a result, it is often used for calibration for other techniques. Other instrumental methods, such as SIMS, Fourier transform infrared spectrometry (FTIR), and Auger emission spectrometry (AES) have greater sensitivity than NDP in most application and better resolution in some matrices, but each of the other techniques is subject to highly interactive chemically and electronically induced artifacts. NDP can be used to calibrate the other methods and after calibration, the better resolution of the other method can be used.23 Rutherford backward scattering (RBS) and NDP complement each other as they both nondestructively analyze different compositions: RBS measures concentration profile of heavy atoms in matrices of light atoms while NDP is limited to some light elements. Figure 1 gives the neutron depth profiling target chamber.
IV. DEPTH PROFILING WITH NARROW RESONANCES OF NUCLEAR REACTIONS
The method is based on a reaction A(a,b)B which has a very narrow isolated resonance in the excitation function. a must be a high-energy charged particle so its specific energy loss dE/dx will be large; the larger the dE/dx the better depth resolution can be obtained. A is the element for which the concentration depth profile is measured. b might be a photon, a neutron, or even a charged particle as long as its range is larger than the range of a. If a has exactly the resonance energy E,, it will react with the atoms of A on the surface of the sample, however, if it has higher energy E, (E, > E,) it will react with atoms of A inside the sample in a distance e from the surface
as at this depth the particle a loses sufficient energy to reach the energy E,. It is easier to measure if b is y or neutrons since it is easier to resolve them from the backscattering and the detector can be located out of the vacuum chamber of the accelerating system and the sample. This method was used mainly for hydrogen depth profiling using various reactions. The main used reactions are H (I9F, cry) 1 6 0 , 24H (I5N, a y ) 12C,25and H ('Li,y) 2cr, i.e., bombarding with 19F, 15N, or 'Li ions, respectively, and measuring the emitted y, and the reaction H (llB,a) 2cr26in which the sample is bombarded with "B ions and the emitted a particles are detected. Similar reactions were used to determine the depth profiling of deuterium, D (3He,p) 4He and D (d,p) T, however, all these studies of deuterium depth profiles were done for metals and not for semiconductors. However, this method of depth profiling by activation with narrow resonance is not limited to hydrogen alone. Kido et al." used the 31P(p,y) 32Sreaction which shows narrow resonances for proton energies of 81 1.3 and 1247 keV (FWHM equal to 0.46 and 1.5 keV, respectively) for the measurement of the concentration profile of phosphorus in silicon. Armigliato et a1.28used the reactions O ' B (cr,p) I3C. (E, = 1507 keV, FWHM = 18 keV) to measure the depth profile of the boron in silicon wafers.
FIGURE 1. A diagram of the scattering chamber. The thermal neutron beam traveled a short distance in air from the beam collimation system to the entrance window. The window was made of 0.5-mrnAl, and was 38 cm from the detector to minimize the counting of background radiation generated as the beam entered the chamber. The chamber was kept at a vacuum better than 5 X ton. The beam passes through the sample and out the exit window. (From Downing, R. G., Fleming, R. F., England, J. K., and Vincent, D. H., Nucl. Instrum. Methods, 218, 47, 1983. With permission.)
Ziegler et aLZ9from 16 different laboratories summarized the measurements of hydrogen concentration depth profile by various methods which involve the use of beams of kinetic ions, the main ones are "excitation functions" (counts vs. energy of the accelerated ions) of narrow resonance nuclear reactions, scattering, and SIMS. We are concerned only with the nuclear reactions. They reported on comparative study of the various techniques using identical samples of hydrogen implanted into silicon. The different methods give the depth of the hydrogen peak with standard deviation of 8% and better agreement was found for the peak width and the total H atom concentration. Comparing the various reactions, the best resolution was obtained with the H (15N,cyy) 12Creaction, together with relatively low heat deposited in the sample, indicating that this reaction is the preferable one. This reaction is
Volume 11
-Photomultiplier
Samples
Valve
-
605
Liquid Nitrogen Coid Trap
0
Detector
Insulating Coupling
Variable Apertures
FIGURE 2. A schematic representation of the experimental apparatus used to measure hydrogen profiles. An ion beam from a nuclear accelerator bombards the samples mounted on a remotely rotatable sample wheel, and the characteristic y rays are measured with an NaI detector mounted behind the sample. (From Ziegler, J. F., Wu, C. P., Williams, P., Whilz, C. W., et al., Nucl. Instrum. Methods, 149, 19, 1978. With permission.)
the most common one in the l i t e r a t ~ r eAmsel . ~ ~ and c o - w ~ r k e r s ~theoretically ',~~ discussed the resolution of depth profiling by nuclear reactions with narrow resonances. Figure 2 gives schematic representation of a system for measurement of hydrogen depth profiling using ion beam reaction with the emission of a y-photon.
REFERENCES 1. Grasserbauer, M., Yu, M., Zolotov, A., and Morrison, G. H., General aspects of trace analytical methods. VII. Trace analysis of semiconductor materials. B. distribution analysis, Pure Appl. Chem., 57, 1153, 1985. 2. Ziegler, J. F. and Baglin, J. E. E., Determination of surface impurity concentration profiles by nuclear backscattering, J . Appl. Phys., 42, 2031, 1971. 3. Lan, C. R. and Yang, M. H., Determination of depth concentration profiles of arsenic in silicon by neutron activation analysis and differential pulse cathodic stripping voltammetry, Silicon Mnter. Res. Progr.. 1, 53, 1986. NSC, Taiwan. 4. Larrabee, G. B. and Keenan, J. A., Neutron activation analysis of epitaxial silicon, J . Electrochem. Soc., 118, 1351, 1971. 5. Haas, E. W., Glawischnig, H., Lichti, G., and Bleier, A., Activation analytical investigation of contamination and cross contamination in ion implantation, J . Electronic Muter., 7 , 525, 1978. 6. Jahnel, F., Ryssel, H., Prinke, G., Hoffmann, K., Muller, K., Biersack, J., and Henkelmann, F., Description of arsenic and boron profiles implanted in SiO,, Si,N, and Si using Pearson distribution with four moments, Nucl. Insbum. Methods, 1821183, 223, 1981. 7. Rausch, H., Bereznai, T., and Bogancs, J., Activation analysis of impurity distributions in critical layers of semiconductors, J. Radioanal. Chem., 19, 77, 1974. 8. Grasserbauer, M., Surface and interface analysis for the development of microelectronic devices, Proc. Euroanalysis, Roth, E., Ed.,Editions Physiques, Paris, 1988, 195. 9. Alfassi, Z. B. and Yang, M. H., The measurement of phosphorus depth profiling in silicon, J. Radioanal. Nucl. Chem. Lett., 132, 99, 1989. 10. Bereznai, T., DeCorte, F., and Hoste, J., Neutron activation analysis of semiconductor silicon, Radiochem. Radioanal. Lett., 17, 219, 1974. 11. Haas, E. W., Hofmann, R., and Richter, F., Errors in activation analysis by nuclear recoil, J . Radioanal. Chem., 69, 219, 1982. 12. Itoh, Y. and Nozaki, T., Oxygen depth profiling by activation with the '60 (3He,p) I8F reaction, J . Radioanal. Chem., 70, 329, 1982. 13. Nozaki, T., Chemical separation of I8F as KBF4 in oxygen analysis by the '60 ('He,p) IsF reaction, J . Radioanal. Chem., 72, 527, 1982.
606
Activation Analysis
14. Yang, J. Y., Tseng, C. L., Lo, J. M., and Yang, M. H., Determination of traces of lithium in biological, environmental and metal samples by neutron activation analysis, Fresenius Z. Anal. Chem., 321, 141, 1985. 15. Nozaki, T., Itoh, Y., Hayashi, S., and Qiu, Q., Utilization of deuterium and I5N as activable tracers in solid state sciences, J. Radioanal. Nucl. Chem. Articles, 112, 47, 1987. 16. Ziegler, J. F., Cole, G. W., and Baglin, J. E. E., Technique for determining concentration profiles of boron impurities in substrates, J. Appl. Phys., 43, 3809, 1972. 17. Muller, K., Henkelmann, R., and Borofka, H., The determination of low dose boron implanted concentration profiles in the silicon by the (n,a) reaction, Nucl. Instrum. Methods, 129, 557, 1975. 18. Kvitek, J., Hnatowicz, V., and Kotas, P., Determination of boron concentration profiles in silicon from I0B(n,a)'Li reaction product spectra, Radiochem. Radioanal. Lett., 24, 205, 1976. 19. Cerevna, J., Hnatowicz, V., Hoffmann, J., Kosina, Z., Kvitek, J., and Onheiser, P., The use of the neutron induced reaction for boron profiling in Si, Nucl. Instrum. Methods, 188, 185, 1981. 20. Biersack, J. P., F i k , D., Henkelmann, R., and Muller, K., The use of neutron induced reactions for light element profiling and lattice localization, Nucl. Instrum. Methods, 149, 93, 1978. 21. Downing, R. G., Fleming, R. F., Langland, J. K., and Vincent, D. H., Neutron depth profiling at the national bureau of standards, Nucl. Instrum. Methods, 218, 47, 1983. 22. Lee, M. C., Verghese, K., and Gardner, R. P., A model for the detector response function in neutron depth profiling, Nucl. Instrum Methods Phys. Res., B31, 567, 1988. 23. Downing, R. G., Maki, J. T., and Fleming, R. F., Analytical applications of neutron depth profiling, J . Radioanal. Nucl. Chem., Articles, 112, 33, 1987. 24. Leich, D. A. and Tombrello, T. A., A technique for measuring hydrogen concentration versus depth in solid samples, Nucl. Instrum. Methods, 108, 67, 1973. 25a. Lanford, W. A., Trautvetter, H. P., Ziegler, J. F., and Keller, J., New precision technique for measuring the concentration versus depth of hydrogen in solids, Appl. Phys. Lett., 28, 566, 1976. 25b. Lanford, W. A., use of nuclear reaction analysis to characterize the elemental composition and density of thin film amorphous silicon, Solar Cells, 2, 351, 1980. 26. Ligeon, E. and Guivarch, A., A new utilization of "B ion beams: hydrogen analysis by H (I1B,a) 2a nuclear reaction, Radiat. Eff.., 22, 101, 1974: Ligeon, E. and Guivarch, A., Hydrogen implantation in silicon between 1.5 and 60 keV, Radiat. Eff., 27, 129, 1976. 27. Kido, Y., Kakeno, M., Yamada, K., Hioki, T., and Kawamoto, J., Study of phosphorus implantation in silicon by channeling and nuclear resonance techniques, J. Appl. Phys., 53, 4812, 1982. 28. Armigliato, A., Bentini, G. G., Rufini, G., Battaglin, G., Della Mea, G., and Drigo, A. V., Analysis of boron predeposited silicon wafers by combined ion beams techniques and X-ray microanalysis, Nucl. Instrum. Methods, 149, 653, 1978. 29. Ziegler, J. F., Wu, C. P., Williams, P., W h i , C. W., Terreault, B., Scherzer, B. M. U., Schulte, R. L., Schneid, E. J., Magee, C. W., Ligeon, E., Lleeuyer, J., Lanford, W. A., Knehne, F. J., Kamykowsky, E. A., Hofer, W. O., Guivarch, B., Filleux, C. H., Dellne, V. R., Evans, C. A., Jr., Cohen, B. L., Clark, C. J., Chu, W. K., Brassard, C., Blewer, R. S., Behrisch, R., Appleton, B. R., and Allerd, D. D., Profiling hydrogen in materials using ion beams, Nucl. Instrum. Methods, 149, 19, 1978. 30. Habraken, F. H. P. M. and Kuiper, A. E. T., Growth and composition of LPCVD silicon oxinitride films, Matter. Res. Soc. Sym. Proc., 48, 395, 1985. 31. Manrel, B., Amsel, G., and Nadai, J. P., Depth profiling with narrow resonances of nuclear reactions: theory and experimental use, Nucl. Instrum. Methods, 197, 1, 1982. 32. Amsel, G. and Maurel, B., High resolution techniques for nuclear reaction narrow resonance width measurements and for shallow depth profiling, Nucl. Instrum. and Methods Phys. Res., 218, 183, 1983. 33. Maki, J. T., Fleming, R. F., and Vincent, D. H., Deconvolution of neutron depth profiling spectra, Nucl. Instrum. Methods Phys. Res., B17, 147, 1986.
Index
INDEX
Absorber technique, 175-176, 180, 182 Acid aluminum oxide, 394 Activated carbon adsorption, 388-389 Activation cross-section(s), 250 for ' Isln(n,y), 246 for 14-MeV neutron activation analysis, 114-136 Adsorption of trace elements, 388-39 I Advantage factors for epithermal neutron reactor analysis (ENAA). 7-13 Advantages and disadvantages of prompt analysis, 146-147 Aegean pottery, 443 Aerosol analysis, 372, 509,547-548: see also Atmospheric particulates Aging and trace element concentrations, 333-334 Agricultural applications, 567-574 Air, 505-506 Airborne particles; see Atmospheric particulates Air dust; see Atmospheric particulates Air-metering devices, 520 Alloy and metal studies, 4 6 8 4 7 1 Alloys, nitrogen in, 200 a-Induced prompt y-rays, 169-172 a-Neutron sources, 241 a-Part~clebombardment. 149 Alumina determination in bauxite, 274, 279-280 Aluminum anodized, 20 1 body levels in renal failure, 4 2 2 4 2 3 nuclear magnetic resonance, 204 Aluminum anodic oxygen films, 201 Aluminum shields, 114 Alumosilicates, 429 Alzheimer's disease, 339 2 4 ' ~ m - B e25 , 1 , 256 Am-Be neutron cross-section, 252 Amberlite IRA-4000,394 Ammonium pyrrolidinedithiocarbamate (APDC), 395-396 Amniotic tluid, 337, 339 Ancient metals. 4 6 7 4 7 7 Animal feeds, 23 1 , 233 Animal tissue element concentrations, 339-341 Annular rarget of KORONA neutron source, 77 Anodiized aluminum, 201 Anomalous isotopic abundances, 108 Archaeological analysis of ancient metals, 4 6 7 4 7 7 of bones, 4 6 3 4 6 7 of clay and pottery, 4 2 9 4 4 5 of glass. 4 4 5 4 5 2 of natural glass, 4 5 2 4 5 8 photoexcitation analysis in, 231 prompt y-ray spectroscopy in, 173 of rock materials, 4 5 8 4 6 3
Archaeometry, 428-429 Arsenic in sillcon, 585. 599 Ash content in coal, 253,260,263 Atmospheric halogens, 549 Atmospheric particulates, 228, 233; see also Dust; Particulate emissions coal, 37 1-374 data evaluation. 539-540 data processing, 5 3 6 5 3 8 relative and monostandard methods, 541-543 sample and standard preparation, 532 sampling conditions, 522-531 sampling methods, 508-532 toxic, 549-558 In various localities, 543-549 Atomic absorption analysis of copper artifacts, 472 in gunshot residue analysis, 4 9 3 4 9 4 of iron artifacts, 477 of silver artifacts, 474 of steatite, 462 Average cross-sections, 246,249-250
Background effects in CINAA, 27 Banti syndrome, 338 Basalt. 463 Bauxite, 274, 279-280 Beam degradation, 1 12-1 14 'Be (y,n), 241 Bem and Ryan's advantage factor, 9 Beryllium, 149, 178-179 charged particle spectrometry, 178-1 79 coincident measurement of complementary particles (CMCP), 208 prompt photon activation analysis, 232 time-of-flight spectroscopy, 190 Betatrons, 222 Biaxial rotators, 86 Binzer filters, 519 Biological materials analysis; see also Botanical applications; In vivo analysis applications of, 333-349 of body composition. 4 1 9 - 4 2 3 of calcium, 193-195 irradiation and y-ray measurement, 328-332 of nitrogen, 208 prompt y-ray spectroscopy, 173 sampling and sample preparation, 324--327 standards in, 327-328 Biological standard reference materials, 329-330 Blood, 3 3 6 3 3 7 Blood serum y-ray spectrum, 5 Body composition studies and clinical applications, 4 19-423 Body fluids, 339-341
610
Activation Analysis, Volume II
Body habitus and nitrogen to hydrogen ratio, 289 Bone(s) archaeological studies of, 4 6 3 4 6 7 human, 28@2-87 NAA studies in, 335 Borehole investigations, 258,267-273, 363-365 Boron, 179,583-584,602 charged particle spectrometry, 179 coincident measurement of complementary particles (CMCP), 208-2 12 delayed neutron photon activation analysis, 230 nuclear magnetic resonance, 199 time-of-flight spectroscopy, 19 1-192 Boron carbide, 173 Boron isotopes, 173,208.21 1 Botanical applications, 341, 567-574 Bowen's kale, 173,542,573 Brain lithium analysis by breath studies, 419 mercury in, 276 trace element concentrations in, 334 Breast milk, 337-338 Breath analysis of radioactive gases, 419 Bremstrahlung spectra, 222-223 British Museum Standard Pottery, 439 Brittle fracture technique, 326 Bromine, 231, 546 Brookhaven adult whole-body counter, 4 1 U 1 5 Brookhaven neutron irradiator, 413 Brookhaven Ohio Red Clay Standard, 439 Brookhaven prompt-y-activation facility, 4 17 Brune and Jirlow's advantage factor, 7-8 Bulgarian glass, 450--45 1 Bulk soils, 570 Bullets, 494-498 Byzantine pottery, 444
Cadmium, 250 in vivo determinations of, 3 15-3 18 neutron activation analysis in vivo, 422 toxicity in human organs, 282-283, 287-288 Cadmium cover in airbome dust irradiation, 534 Calcium biological tracing in vivo, 195-197, 2 8 6 2 8 7 breath analysis of total body, 419 neutron activation analysis in vivo, 4 1 9 4 2 1 time-of-flight spectroscopy, 193-1 95 Calcium isotope fractionation, 535 Calculi, 339 Calibration in in vivo prompt y-activation analysis (IVPGAA), 309 in photoexcitation analysis, 228-229 Canadian cities, air pollution levels, 554-555 Cancer, 338-339 Capture reactions, 256 Carbon, 179 adsorption of, 388-389 capture cross-section of, 259
charged particle spectrometry, 179 in gallium arsenide, 590 neutron activation analysis in vivo, 422 nuclear magnetic resonance, 199 photon activation analysis, 226 in silicon, 584 time-of-flight spectroscopy, 192 total body measurements, 233-234 Carbon foils, 198 Carbon shields, 114 Carbopuron-4n, 39 1 Camalite, 273 Cation exchangers, 399 Cellulose ester water filtration, 382 Celtic glass, 452 Cements, 173 Centrifugation of air dust samples, 508 2 5 2 ~thermal-neutron f irradiation, 279 Chalcogenic glasses, 173 Charged-particle activation analysis, 177-1 83, 345, 472 of airborne lead, 545 in gallium arsenide, 590 of silicon, 583-584 Chelated agent-loaded resins, 395 Chelating resins, 394 Chelex- 100,88, 394-395 Chemical separation of trace elements, 386-399 Chicago air studies, 543 Chlorine in vivo measurements, 284,421 Chlorine logging, 269 Chromium, 183,205 CINAA; see Cyclic instrumental nuclear activation analysis (CINAA) Cincinnati air studies, 543 Clay and pottery, 4 2 9 4 4 5 ; see also Pottery Coal and coal effluents, 252-267 analysis techniques compared, 36&363 combustion of, 371 main elements in, 254 majorlminor element analysis, 363-369 photon activation analysis, 229 prompt y-ray spectroscopy, 173 standardization, 363 trace element analysis, 369-374 Coal and fly ash air pollution, 547 Coalscan, 365 Coatings, nitrogen-bearing, 200 Coincident measurement of complementary particles (CMCP), 205-2 12 Colostrum, 338 Columbia, Missouri, air studies, 543 Comparative standards, 328 Complementary particles, 205-212 Comptom continuum, 150 CONAC program, 365 Concentration profiles, l74--175, 188 Concentration units, 327 Contamination of specimens, 325-326.599-400. see also Sampling
Copper and copper alloys ancient, 4 7 2 4 7 3 in \,ivo measurements, 422 photon activation analysis, 229 Copper shields, 114 Coprecipitation, 39 1-393 Coulomb barrier, 150 Counting time. 107, 1 l l Cross-sections for 14-MeV neutron activation analysis, 1 14-136 Crystals, single, 173 Cumulative response equation, 279 Cyclic instrumental nuclear activation analysis (CINAA), 24-32.278.342 Cyclic irradiation of airborne particulates, 534 Cyclic 14-MeV neutron activation analysis, 88-91 Cylindrical crystal sampling, 97
Data concentration/reduction, 539 Data processing in airborne particulate analysis, 536-538 Daughter activity, 28-29 Dead Sea studies, 273 Dead time and pile-up corrections, 29-31 Deconvolution of the spectrum, 175 Delayed activation analysis, 144-145, 230, 583586 Delayed destruction method of silicon profiling, 598-60 1 Delayed neutron photon activation analysis, 230 Delay times, 105-107 Dental calculi. 339 Dental tissue NAA studies, 335 Depth profiling in prompt particle spectroscopy, 175-177 of silicon. 598--605 Dermal-nitrate test of gunshot residue, 492 Desert rock, 463 Detection count rates and neutron or y-ray selfshieldings, 100-101 Detection efficiency in coal inspection, 258 Detection limits, 279 in aerosol studies, 537 of instrumental neutron activation analysis in glass, 450 in silicon. 592-593 in photoexcitation analysis, 228 in thermal neutron activation analysis, 569 of toxic elements, 31 8 of trace elements in gallium arsenide matrix, 590 in germanium, 592 Deuterium time-of-flight spectroscopy, 191 Deuterium profile, 177 Deuteron activation in calcium fractionation stud~es. 535 Deuteron beam angle variations, 84 Deuteron bombardment, 149- 150 'D fy, n), 241
Differential pulse cathodic strippmg, 599 Dinonylnapthalene (HD), 399 Double-axis rotators, 91 -92 Dowex AG-IXX,394 Down syndrome. 338 Drying of biological specimens, 326-327 Dust, 506; see also Atmospheric particulates
Effective cross-section, 148 Effective energy. 247-249 Egyptian pottery. 44 1 4 4 2 Ehmann and Tian's generalized advantage factor. 913 Elastic cross-section study, 114 Electrical impaction sample collection, 519 Elemental analysis, 253 of biological forensic evidence, 500-502 of bullet lead and shotshell pellets. 4 9 4 4 9 8 of nonbiological forensic evidence, 501 of paint, 4 9 8 4 9 9 Elemental composition of filter materials, 547 Elements, most favorable reactions for, 8 1 ENAA; see Epithermal neutron reactor analysis Energy resolution in time-of-flight spectrometry, 185-188 Energy straggling, 149. 197 Environmental analyses of coal and coal effluents, 37 1-374 Environmental radioactivity, 573 Epithermal and fast-neutron analysis, 4-23 Epithermal groups, 260 Epithermal neutron reactor analysis (ENAA), 342 343,457,472,534,572 advantage factors for, 7-13 relative advantage of. 10-12 Erosion of marble and limestone, 46 1 Error evaluation, 107-1 14 European cities, air pollution levels, 550-55 1 Evaporation of trace elements, 384-386 Excitation function, 174 Exhaled breath studies. 4 19 Exposure geometry in in ~ V v neutron o activation analysis, 41 2 Eye tissue NAA studies, 335
Factors for (n,y) reactions, 7-1 3 Fast group elements in coal, 253 Fast neutron activation analysis, 279-280, 343-344 of coal and coal effluents. 360-362 vs. (n,p) and (n,a) reactions, 24 Fecralloy, 204 Fertilizer analysis, 573 Filter material elemental compos~tion,547 Filtration sampling of air, 5 18-5 19 of water, 382-383 Fingerprinting of trace elements, 369
612
Activation Analysis, Volume II
Firearms discharge, 4 9 2 4 9 8 Fish products, 23 1 Fissionable elements, 232 Fission spectrum, 242, 2 4 6 2 4 7 Flame atomic absorption spectroscopy of airborne particulates, 536 Flint, 4 5 9 4 6 0 , 4 6 2 4 6 3 Fluorine, 149 delayed neutron photon activation analysis, 230 nuclear magnetic resonance, 201-202 photoactivation analysis, 226 proton activation analysis, 534-535 Flux monitors in calibration, 229 Flux variation in cylindrical sample, 95 Foods, 173 Forensic analysis of biological evidence materials, 500--501 of firearms discharge, 4 9 2 4 9 8 of nonbiological materials other than firearms, 498-500 of paint, 4 9 8 4 9 9 Formalism in analyzing samples of unknown composition, 94--100 Fossil bones, 464; see also Archaeological analysis Fractionation ratio, 372 Freeze-drying of trace elements, 386 Fuel rod analysis, 232 Fungi, 572
Gallium phosphide, 593 Gallstones, 339 y-Neutron activation in human-body element studies, 282 y-Ray(s) in blood serum, 5 in 242Cf,248 contamination of, 602 detection efficiency, 258 dosimetry in vivo, 3 1 1-3 13 in germanium, 247 in human liver, 331-332 measurement in biological specimens, 328-332 interfering, 1 11-1 12 prompt; see Prompt y -rays self-shielding of, 92, 100-101, 108-109 Garden soils, 228 Gas evolution of water, 383 Gas stream sampling, 520 Gaussian distribution, 538 Ge (Li) detector, 255 Geological analysis, 198, 569-572 Geological standards in prompt y-ray spectrometry, 173 Germanium, 247,591-593 Giant resonance region, 221 Glass analysis methods, 4 4 5 - 4 4 9 applications, 4 4 9 - 4 5 2 archaeological studies, 4 4 5 4 5 2 boron in, 199
hydrogen trapping in, 198 nuclear magnetic resonance, 202-203 Gold, archaeological studies of, 476 Gonzales test of gunshot residue, 492 Grass, 572 Gravitational settling, 5 18 Greek pottery, 4 4 3 4 4 4
Hafnium, 279 Hair trace element studies. 228,334-335 Half-life measuremerit, cyclic activation in, 27-28 Halogens, 549 Heat evaporation, 384-386 Heath method, 85 Helium, 177-1 78, 199 Hemodialysis, 338 Hepatitis, 338 High Altitude Sampling Program of DASA, 543 High energy electron photon activation analysis, 230 Homogenization, 326 Human body; see Biological materials analysis; In vivo analysis, of elemental composition, Human body fluids, 336-338 Human hair, 228,334-335 Human liver, 331-333 Hydrated antimony pentoxide (HAP), 347,394 Hydrogen charged particle spectrometry, 177 coincident measurement of complementary particles (CMCP), 207-208 in expired breath, 420 nuclear magnetic resonance, 198-199 profile of, 177 time-of-flight spectroscopy, 189 Hydrous iron oxide adsorption, 389-390 Hyperpure Ge detector, 255 Hypertension and renal cadmium levels, 422
lZ91,573 Impaction sampling, 5 18 Impingement sampling, 5 18 Impurity levels of air filters, 519 INAA; see Instrumental neutron activation analysis (INAA) Inductively coupled plasma emission spectroscopy, 472473 Inelastic neutron activation, 4 1 7 4 1 9 Inelastic scattering, 256, 260 Inhalation pathway for toxic particulates, 505 I5In (n,y), 250 Inorganic ion exchangers, 394 In siru analysis of coal and coal effluents, 362 Instrumental multielement photon activation analysis, 227-228,383-384 Instrumental neutron activation analysis (INAA) airborne particulates, 533-534, 536, 548-549 archaeometry, 428
'
biological materials, 333-336 bullets or shotshell pellets, 49-98 copper artifacts, 473 detection limit in glass, 450 flint, 4 6 2 4 6 3 glass, 4 4 8 4 5 0 iron meteorites, 476 limitations of, 23-25 nonbiological evidence, 498-500 plant analysis, 572 pottery, 430,438 silicon matrix, 581 silver artifacts, 474 soil pollution, 57 1-572 toxic particulates, 549 water samples, 383-384 with X-ray fluorescence, 549 Instrumental proton activation analysis, 344-345, 536 Interference, 1 1 1--112, 15 1, 416 Interference factor equation, 328 Interfering element irradiation times. 103-105 Internal calibration, 229 I965 International Conference on Modem Trends in Activation Analysis, 84-85 International Working Group for Geochemical Standards, 542 I n v r w analysis. 233-234, 280-290 of elemental concentration, 3 15-320 mobile reactors in, 300-309 neutron activation analysis, 407-423 radiation dosimetry in, 309-3 10 total body oxygen, nitrogen, and carbon, 233-234 I n 1Vi~)prompt y-activation analysis (IVPGAA) calibration in, 309 phantom setup in, 305-309 THMER setup for, 301-303 Ion exchange preconcentration, 393--395 Ion source and optical focusing for 14-MeV neutron act~vationanalysis, 98 Iron archaeological studies of, 47-77 photon activation analysis, 229 rn v i w measurements of, 422 Iron shields. 1 14 Irradiation of airborne particulates, 532-536 of biological specimens, 328-332 Irradiation configurations, 81 Irradiation facilities for photon activation analysis, 222-225 Irradiation time, 102-105, 1 l l Isotope properties, 379-381 Isotopic abundance variations, IOX Isotopic neutron source applications, 25 1-252
Japanese alr pollution studies, 546 Jirlow and Brune's advantage factor, 7-8 Joint Research Center of the European Community air sampling, 527
Karlsruhe air pollution studies, 546 Kidney(s); see also Renal failure cadmium in, 416417,315-318,422 elemental studies of, 333-334 NAA studies in, 335 Kidney scans, 314 Kinematics of nuclear reactions, 145-146 KORONA neutron source annular target, 77
Leaching, 373-374 Lead, 226227,229,536,545--546 Lead shielding, 114, 258 Lean body mass estimation, 421LA22 Lichens and mosses, 572-573 Light element photon activation analysis, 226, 581, 586 Limestone, 458-461 Linear accelerators, 222 Liquid cation exchangers, 399 Lithium, 178, 208,419 in v i ~ wdeterminations, 290 time-of-flight spectroscopy, 189-190 Liver; see also Human liver cadmium concentrations in, 282-283,287-288, 315-318,416--417 y-Ray spectrum of, 33 1-332 trace element concenrrations in, 333 Lobster hepatopancreas, 229-230 Logging methods, 269--270 Lognormal distribution, 538-539 Low-energy photon spectroscopy of atmospheric particulates, 533-534 Lung NAA studies, 335
Magmatic rock, 457, 461 Magnesium nuclear magnetic resonance, 203-204 Magnetohydrodynamic coal combustion, 37 1 Manganese, 280 Marble, 4 5 8 4 6 1 Marine dust sampling, 520 Marine sediment, 229,233 Material balance determinations, 37 1 Matrix interference in silver instrumental neutron activation analysis, 475 Mean composition of analytical samples, 508 Medical uses of isotopic neutron source analysis, 280-291; see also I n i t v o analysis Medium and heavy element photon activation analysis, 226-227 Membrane filtration of water samples, 382 Menke's disease, 339 Mercury, 276,3 15-3 18 Metal and alloy studie\, 4 6 8 4 7 1 Metal-DDC extraction, 398-399 Metal foils, 198 Metallic elements, nitrogen in, 200
614
Activation Analysis, Volume II
Metal oxide low-energy resonances, 201 Metals, ancient, 4 6 7 4 7 7 ; see also Archaeological analysis Meteorite studies, 4 7 M 7 7 Method of replicates, 29 14-MeV neutron activation analysis, 548 activation cross-sections for, 1 1 6 136 advantages of, 7 6 7 5 cross-sections for, 115 cyclic, 88-91 fertilizer studies, 573 irradiation, delay, and counting times, 101-107 irradiation facilities and procedures, 8&88 method using reference different from sample, 91101 neutron reactions and cross-sections, 77-80 neutron sources, 7 6 7 7 precision of, 107-1 14 Mexico City, air pollution studies, 546 Microtons, 222 Milk, 337-338 Millipore filters, 519 Mineral metabolism disorders, 421 Minerals investigation, 267-268, see also specific minerals " ~ (n,y), n 250 Mobile reactors; see THMER reactor Molecular radiochemical neutron activation analysis, 349 Monostandard method, 439,542-543 Monte Carlo method, 92-93, 253, 260-261 Mossbauer spectroscopy, 462 Mosses and lichens, 572-573 Mouse and rat organs, 340 Mucocutaneous lymph node syndrome, 338 Multichannel scaling, 367 Multielement neutron activation, 1 1 2 , 4 4 8 4 4 9
Narrow resonance depth profiling of silicon, 603605 Natural glass, 4 5 2 4 5 9 Near Eastern pottery, 4 4 2 4 4 3 Needle biopsy contamination, 325 NE213 scintillator, 242, 291-292 Neon, 202 Neutron activation analysis, 4 agricultural and botanical applications, 568-569 archaeometry, 428 British air pollution studies, 545 copper artifacts, 472 forensic applications, 492-500 glass, 448-449 gold, 476 gunshot residue analysis, 4 9 3 4 9 4 in vivo, 4 0 7 4 2 3 basic principles of, 4 0 8 4 1 0 detector systems, 4 1 2 - 4 15 neutron sources, 4 1 W 12 meteorites, 476
natural glass, 4 5 7 4 5 8 Ohio Red Clay from four laboratories, 440 plant analysis, 572-573 pottery, 44 1 4 4 5 precision and accuracy in, 540 silicon depth profiling, 599 silver artifacts, 474 steatite, 462 water samples, 3 7 7 4 0 0 Neutron activation logging, 269 Neutron and photonuclear reactions with lead, 227 Neutron dosimetry for in vivo prompt y-activation analysis (IVPGAA), 3 10--311 Neutron energy spectrum, 4 Neutron filters, 5-7 Neutron irradiation of airborne particulates, 532534; see also Atmospheric particulates Neutron-neutron method, 268 Neutron self-shielding, 92, 100-1 0 1, 108-1 09 Neutron source in vivo NAA, 41-1 2 14-MeV neutron activation analysis, 7 G 7 7 positioning and, 110 Neutron spectrum from 22"a-~e, 248 Neutron time-of-flight spectroscopy, 183-185 applications of, 189-1 95 concentration profiles, 188 energy resolution, 185-188 spectrometer resolution, 188 New World pottery, 444 n-y -Pulse shape discrimination, 242 Nickel, 183,205 Niobium metal, 173 Nitrogen, 179-1 8 1 charged-particle spectrometry, 179-1 8 1 coal, 2 6 6 2 6 7 neutron activation analysis in vivo, 421 nuclear magnetic resonance, 199-200 photoactivation analysis, 226 in silicon matrix, 586 time-of-flight spectroscopy, 193 total body measurements in vivo, 233-234, 289290 Nitrogen-bearing coatings, 200 Nitrogen to hydrogen ratios in vivo, 289 Nitrogen interference, 1 12 Nonvascular plants, 572-573 Nuclear magnetic resonance, 196-205 Nuclear microprobe techniques, 178- 179, 183 Nuclides formed in nuclear reactors, 3 5 - 4 6 Nucoalyzer, 365
Obsidian, 4 5 2 4 5 9 Ohio Red Clay analyses, 440 Oil industry, 269 '%/'60 ratio, 230 On-line analysis of coal and coal effluents, 255, 362-363 Organic liquid scintillators, 291-292
Oxide layers, 203-204 Oxides, nitrogen in, 200 Oxygen charged-panicle spectrometry, 181- 182 in coal, 253 concentration depth profile of, 600 delayed neutron photon activation analysis, 230 in gallium arsenide, 590 isotope analysis of, 272 nuclear magnetic resonance, 200--201 photoactivation analysis, 226 in silicon, 584 time-of-flight spectroscopy, 193 total body measurements in vivo, 233-234; see also In v i 1 ~ 1analysis Oxygen conversion of coal, 3 6 6 3 6 9
Paint, forensic studies of, 4 9 8 4 9 9 Pancreatic NAA studies. 335 Pan's head studies, 461 Paraffin test of gunshot residue, 492 Parry's improvement factor. 8 Partial-body counters, 4 1 3 4 1 5 Partial body neutron activation analysis, 282 Partial body prompt-y -facility, 418 Particle accelerators, 365 Particle emission photon activation analysis, 222225 Particle emission photonuclear reactions, 225 Particle emission X-ray spectroscopy (PIXE) of obsidian. 457 Particle-induced photon spectroscopy (PIPPS), 149150 application of, 168-172 isotope analysis, 172-173 5ensitivity of, 150 Particulate emissions, 371-374; see also Atmospheric particulates Pattern recognition of trace elements, 369-370 Pelopenesian pottery, 443 Perlman & Asaro standard, 439 Petroglyphs, 463 Petroleum industry, 269 Phantom experiment in viva prompt y-activation analysis (IVPGAA), 305-309 Phosphorus, 204,276-277 Photoactivation analysis ancient metal studies, 472 archaeometry. 428 copper artifacts, 472,473 glass, 4 4 5 4 4 9 provenance study of pottery, 430 silver artifacts, 474 Photoexcitation analysis, 231 Photon activation analysis, 220-221 applications of, 233-234 instrumental multielement, 227-229 irradiation facilities, 222-225 particle emission, 225-227
photoexcitation analysis, 231-232 prompt, 232 rapid. 229-23 1 secondary neutron, 232-233 silicon and carbon studies, 586 Photoneutron interference, 232 PIGME; see Particle-induced photon spectroscopy (PIPPS) Pineal body, 335 Placental tissue, 335, 339 Plant analysis, 572-573, see also Biological materials analysis Po-Be sources, 24 1 Polar ice pollution, 558 Polluted soils. 571-572 Polyacrylate-acrylamide gel matrix, 328 Polycarbonate water filtration, 382 Porosity, 268-269 Potassium, 283 Pottery activation analysis studies, 43 1 4 3 5 provenance studies of, 430 standards of analysis for, 4 3 1 4 3 5 , 4 3 9 4 4 1 Pregnancy, prolonged, 338 Preirradiation concentrations of elements, 347-349 Preirradiation separations, 327 Primer gunshot residue, 4 9 2 4 9 4 Prompt-y-neutron activation analysis advantages and disadvantages, 1 4 6 1 4 7 basic equation for, 415 renal and hepatic cadmium, 4 1-17 total body nitrogen in viva, 415-416 Prompt y-rays, 147, 253 catalog of, 15 1-168 nomenclature of, 151 response of, 256 table of a-induced, 169-172 table of proton-induced, 152-168 Prompt panicle spectrometry, 173-1 74 applications of, 177--183 depth profile calculations, 175--177 Prompt photon activation analysis, 232 Prompt radiation in silicon analysis, 5 8 6 5 8 8 Protein mass, 42 1 Proton activation analysis (PAA) airborne particulates, 535-536 glass, 445, 448 gold artifacts, 476 silver artifacts, 474 Proton bombardment. 149 Proton-induced prompt y-rays, 152-168 Proton-irradiation ''0 low energy resonances, 201 Proton recoil spectrum, 242 Provenance studies; see also Archaeological analysis glass, 45-52 pottery, 438 photoactivation analysis in, 430 Pu-Be sources, 24 1 Pulmonary NAA, 335 Pulsed beams, 189-195 Pulsed neutron generator for field applications, 78
616
Activation Analysis, Volume I1
Pulse shape discrimination, 291 Pulsing reactors, 32-34 Pump sampling, 520
Quality control in coal analysis, 363 Quartz tools in biological studies, 325-326 Quasi-prompt activation analysis, 145
22"a-Be, 246, 248 Radiation dosimetry in vivo neutron activation analysis, 412 in vivo prompt y-activation analysis (IVPGAA). 309-3 15 Radiochemical neutron activation analysis, 345-349 Radioecology, 573 Radioisotopes used for photoexcitation analysis, 224 Radioisotope sources and spectra, 240--246 Rapid photon activation analysis, 229-230 Rare earth elements, 457 Rat and mouse organs, 340 Reaction rate, 248 Reactor neutron activation analysis (RNAA), 9,476 Reference position, 109-1 10 Reflector effect, 269 Relative (multielement standard) method, 541-542 Renal calculi, 339 Renal failure, 3 3 8 , 4 2 2 4 2 3 Renal scan, neutron and y-total dose in, 314 Replicates method, 29 Representative variance of analytical samples, 509 Resonance, 174-175; see also Nuclear magnetic resonance Resonance integral calculation, 247 Resonance integrals for selected elements, 250 Resonance yield, 196 Rexyn-201,394 Risk assessment of radiation dose with THMER facility, 315 RNAA; see Reactor neutron activation analysis Rocks, 233, 2 6 8 , 4 5 8 4 6 3 ; see also specific types Roman pottery, 444 Rotational sample holder, 224 Ryan and Bern's advantage factor, 9
Safety assessment for in vivo prompt y-activation analysis (IVPGAA), 3 13-3 15 Sample holders for photon activation analysis, 223224 Sample of unknown composition, 91-101 Sample position, 109-1 10 Sample preparation, 324--327, 532 Sampling air, 508-532; see also Atmospheric particulates in ancient metal studies, 472
water, 378 Sapphire substrates, 204 ' 2 4 ~ b - ~242 e, Schizophrenia, 338 Screening effect variation, 97 Secondary neutron photon activation analysis, 232233 Selenium, 23 1,341 Self-shielding, 92, 1-101, 108-109 Semiconductor materials, 233,579-594; see also specific materials Sensitivity of analysis, 150 Sewage sludge fertilization, 572 Sheep phosphorus bone studies, 2 7 6 2 7 7 Shield composition, 114 Shielding in coal inspection, 258 Shielding effects in archaeological iron studies, 477 Shotshell pellet analysis, 49-98 Silicon, 183, 279, 548 charged particle spectrometry, 183 depth profiling of, 598-405 nuclear magnetic resonance, 204 oxygen in, 201 prompt y-ray spectroscopy, 173 thermal neutron activation, 580-583 Silicon to hydrogen alloy, 586 Silver, archaeological studies of, 4 7 3 4 7 6 Single crystals, 173 Single irradiation, 85-89 Skeletal calcium measurements, 280-287 Skin NAA, 335 Slowdown method of depth profiling, 601-603 Slowing-down lengths in coal, 256 SODERN pulsed neutron generator, 78 Sodium, 272-273 in vivo body measurements, 284, 288-289 neutron activation analysis in vivo, 421 nuclear magnetic resonance, 202-203 Sodium diethyldithiocarbamic acid (Na-DDC), 395396 Soil analysis, 233, 569-572 Solid waste casks, 232 Solvent extraction, 395-399 Sonic y-lines of I6?b and interfering isotopes, 439 Spanish pottery, 444 Spectrophotometry compared with prompt y-ray spectrometry, 173 Spectrum deconvolution, 175 Stack gas sampling, 520 Standard reference materials for biological studies, 329-330 in coal analysis, 363 Standard sample, 148 Steatite, 4 6 1 4 6 2 Steels, 173 Stopping power, 15 1, 175 Straggling function, 149, 197 Stratospheric aerosols, 520 Sulfur, 204 Sulfurmeter, 365 Summed energy technique, 207,208
Tapered sections. 179, 18 1-182 Target Transformation Factor Analysij. 558 Tea, 572 Technetium, 546 Tetlon contamination, 326 Tektites, 4 5 2 4 5 9 Texas flux monitor~ngconvention. X L X 5 Thermal group elements in coal. 253 Thermalization effect, 247 Thermal neutron absorbers, 13- 16 Thermal neutron activation of sillcon, 580-583 Thermal neutron flux in body, 4 1 0 4 1 2 Thermal neutrons, 249-250 Thermal neutron spectra in coal. 256-257 Themial precipitation simpling. 520 Thick targets. 148 Thin targets, 147 THMER reactor. 30-304, 31 1 employee risk assessment. 3 15 rn ~ , i r , activation o with, 304-309 irr ~ ? v oelemental studies with, 3 18-3 19 safety assessment of. 3 13-3 15 Thre\hold arnpMiers, 175 Threshold energy, 249 Tian and Ehmann's generalized advantage factor, 913 Time-of-flight spectroscopy; \ee Neutron time-offliiht spectroscopy Times in cyclic irradiation, 24 Tin oxide, 394 Tissue-equivalent phantom detection, 277-278 Titanium, 205 Tobacco, 344 Tools used in biological studies, 325-326 Total-body counting, 1 12 Total-body neutron activation technique. 421 Total dose equivalents, 3 14 Toxic and essential elements in IVG proton activation analysis (PAA)-medical diagnosis, 3 17 Toxic elements, 318, 324 Toxic particulate levels, 549-558 Trace element analysis of coal and coal effluents, 362.369-374 Trace element partitioning, 371-372 Trace elements aging and, 333--334 in human liver, 333-334 preconcentration by evaporation, 384-386 in silver artifacts, 475 toxicity of, 374 Transfer time effects in CINAA. 25-27 Transversal flux variation, 95 Triga reactors, 33--34, 546 Tropospheric aerosols, 520 Tsing Hua Mobile Educational Reactor; see THMER reactor
Ultrapure metals, 233 Ultrasound and in vivo prompt y-activation analysis
(IVPGAA). 309 U. K. air studies, 545 Ur~ne.337 U.S. Atomic Energy Commission special report on gunshot residue testing, 493 U S . cities, air pollution levels, 554-555 U.S. Geological Survey \tankard\ for pottery analysis. 439
Vacuum pump sampling, 520 Vanadium, 347 Vanadium pollution, 546 Van der Graaft'accelerators. 222 V;~rnisli-coveredrock\. 463 Vascular plants, 572 Vegetation, 173 Viral hepatitis, 338
Wa\sukani. 443 Waste disposal in coal industry, .\72-374 Water analysis instrumental neutron activation analysis, 383-384 radiochemical separation, 3 9 9 - 4 0 0 sample collection, 178-382 trace element preconcentration, 384-399 Weightcd total dose equivalents per scan, 3 I4 Wet impingement, 508 Whatman filters. 5 I9 Whole body counters. 4 1 2 - 4 13 Whole reactor neutron irradiation of airborne particulates, 532-534 Wilson's disease. 339 World cities, air pollution levels, 552-553, 5 5 6 557
X-ray emission spectroscopy archaeornetry, 430 atmospheric particulates, 545 atmospheric pollution, 546 glass, 449,452 gunshot residue analysis, 4 9 3 - 4 9 4 of natural glass, 4 5 7 4 5 8 in silver and lead studies, 474 of steatite, 462
Yahudiyeh pottery ware, 442 Yemen pottery studies, 443
Zeokarb-226, 394 Zirconium hydride, 33